1639
Dual-Echo UTE Off-resonance Saturation Contrast (dual-UTE-OSC) for Morphological and Quantitative Imaging of Craniofacial Cortical Bone
Arya A Suprana1,2, Jiyo S Athertya2, Justin Chen2, Zijin Yang2, James Lo1,2, Xiaojun Chen2, Saeed Jerban2, and Jiang Du1,2,3
1Department of Bioengineering, University of California, San Diego, La Jolla, CA, United States, 2Department of Radiology, University of California, San Diego, La Jolla, CA, United States, 3Radiology Service, Veterans Affairs San Diego Health Care System, San Diego, CA, United States
1Department of Bioengineering, University of California, San Diego, La Jolla, CA, United States, 2Department of Radiology, University of California, San Diego, La Jolla, CA, United States, 3Radiology Service, Veterans Affairs San Diego Health Care System, San Diego, CA, United States
Synopsis
Keywords: Quantitative Imaging, Bone
Recent developments in ultrashort time echo (UTE) MRI have enabled the detection of short T2 species such as cortical bone. MR-based cortical bone imaging has the potential to serve as a non-invasive alternative to computed tomography (CT). In this study, 3D UTE sequences with a combination of varying echo time and RF pulse duration, with and without off-resonance saturation pulse, are utilized to image the human skull. Image subtraction and normalization are used to highlight cortical bone in the craniofacial region. Magnetization transfer ratio (MTR) maps can also be generated for quantitative bone imaging.Introduction
Conventional clinical MRI techniques are unable to image cortical bone due to its ultrashort T2.(1) The T2 of bone is much shorter than the echo time (TE) used in conventional clinical sequences. This means that, in a conventional sequence, the transverse magnetization of bone has relaxed substantially before data acquisition begins, leading to no signal obtained. Ultrashort echo time (UTE) sequences allow the data acquisition to begin before signals in short-T2 species have substantially or completely decayed.(2,3) The subsequent challenge is about obtaining contrast for bone. Several studies have successfully increased contrast in cortical bone through subtraction.(4–6) Due to its ultrashort T2, the bone is much more sensitive to an off-resonance saturation pulse than fat, water, or other long-T2 species. Therefore, subtraction of UTE images without and with off-resonance saturation can efficiently suppress longer T2 species, isolating cortical bone signal.(4) This idea can also be implemented through the manipulation of MR parameters. TE and RF pulse width can be manipulated such that only a narrow range of short-T2 species are affected.(6) This means that the subtraction of images generated from UTE sequences with varying TE or RF pulse width can be made to suppress signals from species with a certain range of T2 while isolating the rest. Several previous studies have shown that manipulation of TE and RF pulse width differences can be used to isolate cortical bone signals.(5,6) In this study, we combined the idea of TE and RF manipulation with an off-resonance saturation pulse to isolate the cortical bone.Methods
UTE MRI scans were performed on a 3T clinical scanner (MR750, GE Healthcare) using an 8-channel head coil. Human skull images were generated using 3D UTE Cones sequences with a combination of short and long TEs, multiple RF pulse widths, with (MT-ON) and without (MT-OFF) an off-resonance saturation pulse. MT-OFF images were generated using 3D UTE with the shortest TE (32 µs) and a short RF pulse width (64 µs). MT-ON images were generated using 3D UTE with dual-echo and three different RF pulse widths (the same flip angle), respectively. Summation (I+) and subtraction (I-) images were generated through summation or subtraction of MT-OFF images by various MT-ON images. The subtraction images were normalized by their corresponding summation images to enhance bone contrast further. MT-ON and MT-OFF images generated using the same TE and RF pulse width were used to calculate magnetization transfer ratio (MTR) maps, which were derived by dividing the subtraction images by MT-OFF images. The 3D UTE-MT sequence parameters include a Fermi-shaped pulse (duration=8ms and bandwidth=160Hz) for off-resonance saturation with two different MT powers of 700° (MT-ON) and 0° (MT-OFF) and a frequency offset of 2kHz, TR=104.8ms, TE1=32µs, TE2=2.2ms, flip angle (FA)=8°, RF pulse width=64,600, and 1000µs, acquisition matrix=256x256, slice thickness=2mm, 11 spokes acquired per MT pulse, and scan time=3min14sec.Results and Discussion
Figure 1 shows the source images generated from the variation of TE, RF pulse width, and off-resonance saturation pulse. As expected, the MT-OFF image acquired with the shortest TE and a short pulse width of 64µs shows the highest bone signal than the rest of the source images. As RF pulse width was increased, bone signals visibly decreased due to reduced excitation efficiency. The second echo images show little bone signal due to fast T2* decay. Figure 2 shows results involving images generated only by the first TE. As expected, the contrast of cortical bone region in the dual-RF subtraction images is visibly higher than in the single-RF subtraction image, where the cortical bone is barely visible. The contrast of cortical bone is enhanced further in all of the normalized images. The cortical bone is demarcated even in the single-RF normalized image. Figure 3 shows results involving images generated from MT-ON images from the late TE and MT-OFF images from the first TE. As expected, the difference in TE increases bone contrast. The cortical bone is more clearly visible in Figure 3 than in Figure 2. The morphological features of bone are apparent in the normalized images, which show cortical layers of bone enveloping what seems to be a spongy bone construct in the middle. Figure 4 compares the results obtained from 3D UTE sequences with a short RF pulse excitation (64µs), without and with off-resonance saturation. The normalized dual-UTE-OSC subtraction image shows excellent contrast for the craniofacial bone. Volumetric MTR maps were generated for quantitative assessment of the organic matrix density in the skull.Conclusion
The dual-echo dual-RF UTE-OSC sequence can generate high contrast morphological images of the skull. The dual-echo single-RF counterpart (dual-UTE-OSC) produces both qualitative and quantitative MTR mapping of the skull and may be more beneficial for clinical applications.Acknowledgements
The authors acknowledge grant support from the National Institutes of Health (R01AR068987, R01AR062581, and K01AR080257) and GE Healthcare.References
1. Reichert ILH, Robson MD, Gatehouse PD, et al. Magnetic resonance imaging of cortical bone with ultrashort TE pulse sequences. Magn. Reson. Imaging 2005;23:611–618 doi: 10.1016/j.mri.2005.02.017. 2. Du J, Carl M, Bydder M, Takahashi A, Chung CB, Bydder GM. Qualitative and quantitative ultrashort echo time (UTE) imaging of cortical bone. J. Magn. Reson. 2010;207:304–311 doi: 10.1016/j.jmr.2010.09.013. 3. Krug R, Larson PEZ, Wang C, et al. Ultrashort echo time MRI of cortical bone at 7 Tesla field strength: A feasibility study. J. Magn. Reson. Imaging 2011;34:691–695 doi: 10.1002/jmri.22648. 4. Du J, Takahashi AM, Bydder M, Chung CB, Bydder GM. Ultrashort TE imaging with off-resonance saturation contrast (UTE-OSC). Magn. Reson. Med. 2009;62:527–531 doi: 10.1002/mrm.22007. 5. Lee H, Zhao X, Song HK, Zhang R, Bartlett SP, Wehrli FW. Rapid dual-RF, dual-echo, 3D ultrashort echo time craniofacial imaging: A feasibility study. Magn. Reson. Med. 2019;81:3007–3016 doi: 10.1002/mrm.27625. 6. Johnson EM, Vyas U, Ghanouni P, Pauly KB, Pauly JM. Improved cortical bone specificity in UTE MR Imaging. Magn. Reson. Med. 2017;77:684–695 doi: 10.1002/mrm.26160.Figures
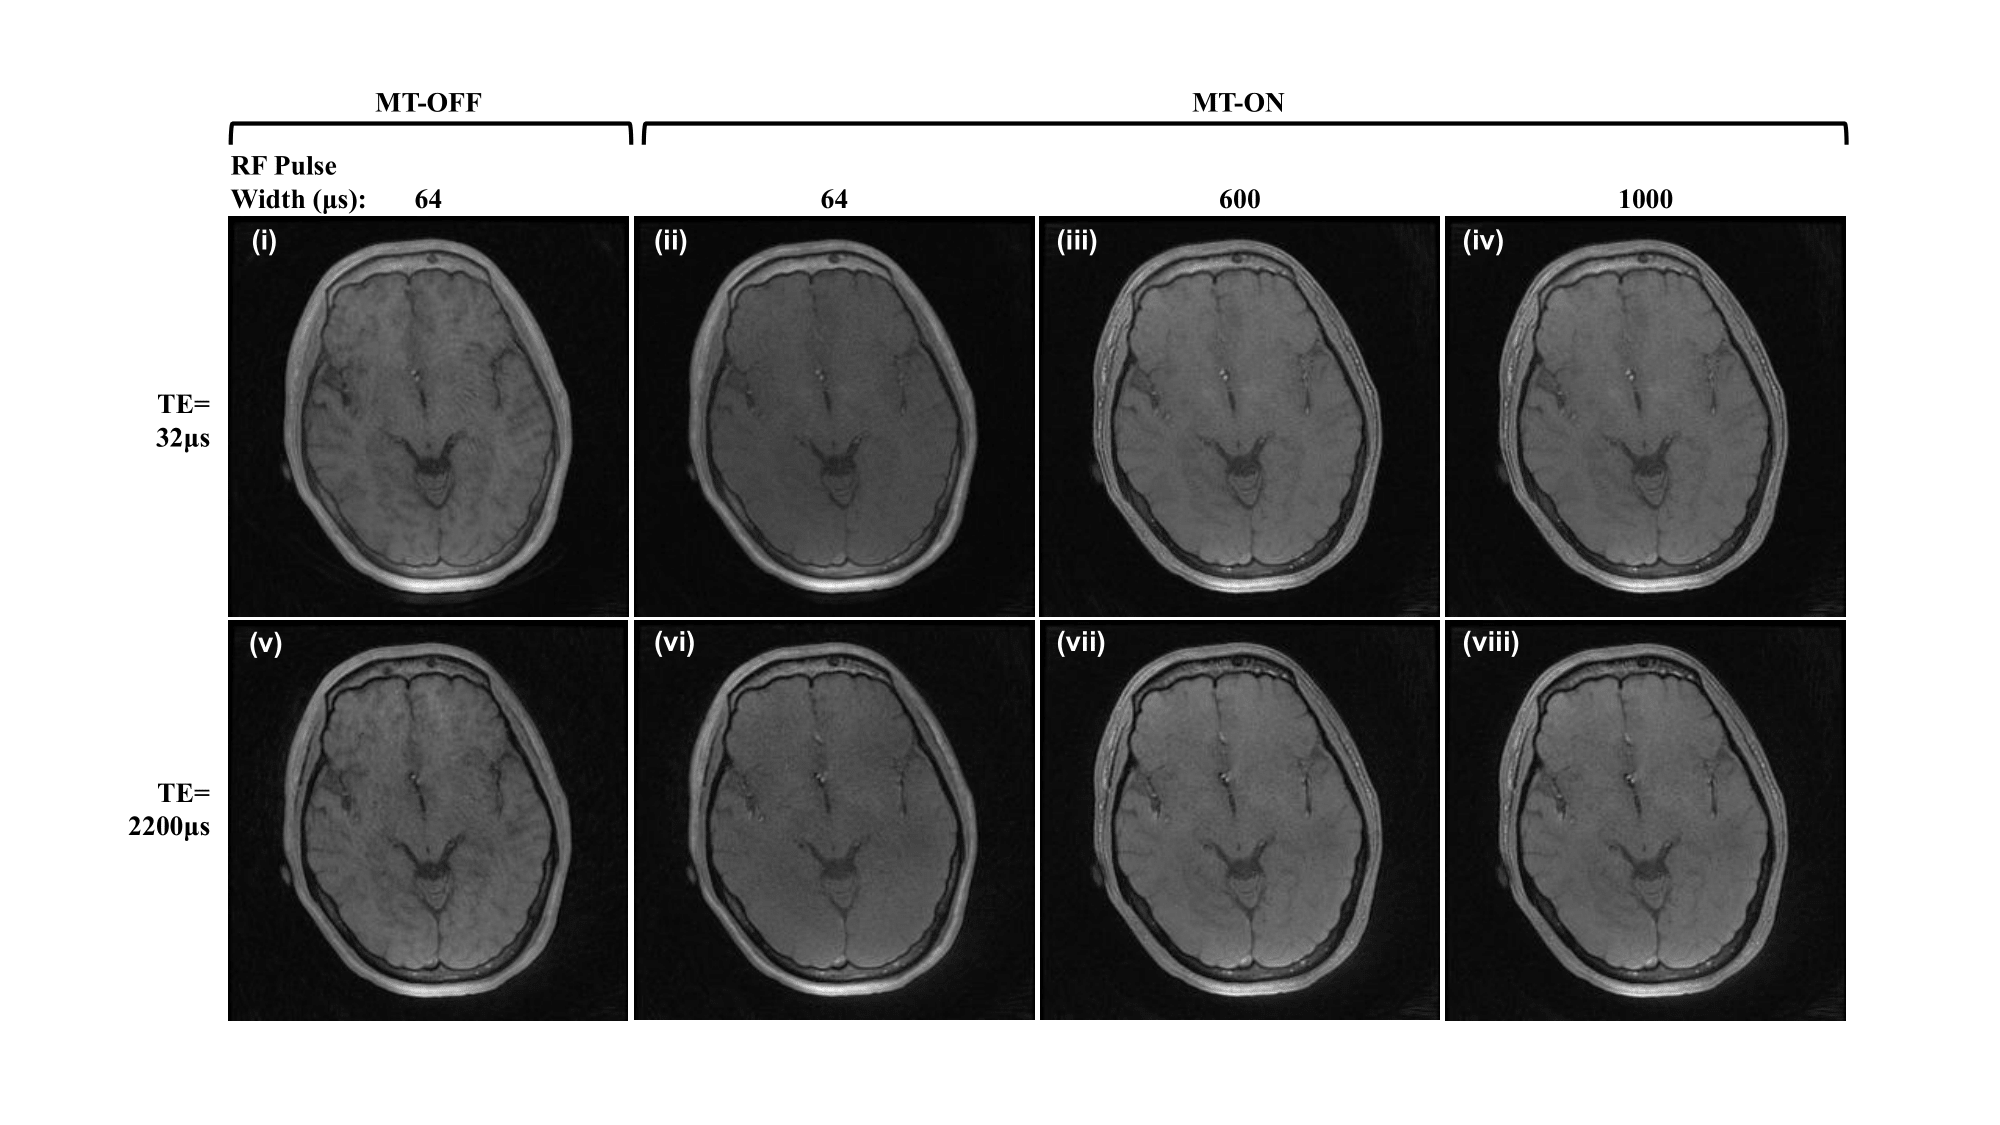
Figure 1. Source images generated from UTE MRI with TEs
of 32 μs (i-iv) and 2200 μs (v-viii); RF pulse width of 64 μs (i, ii, v,
vi), 600 μs (iii, vii), and 1000 μs (iv, viii); without (i,v) or with (ii-iv,
vi-viii) off-resonance saturation pulse at a frequency of 2000 Hz and power of
700°.
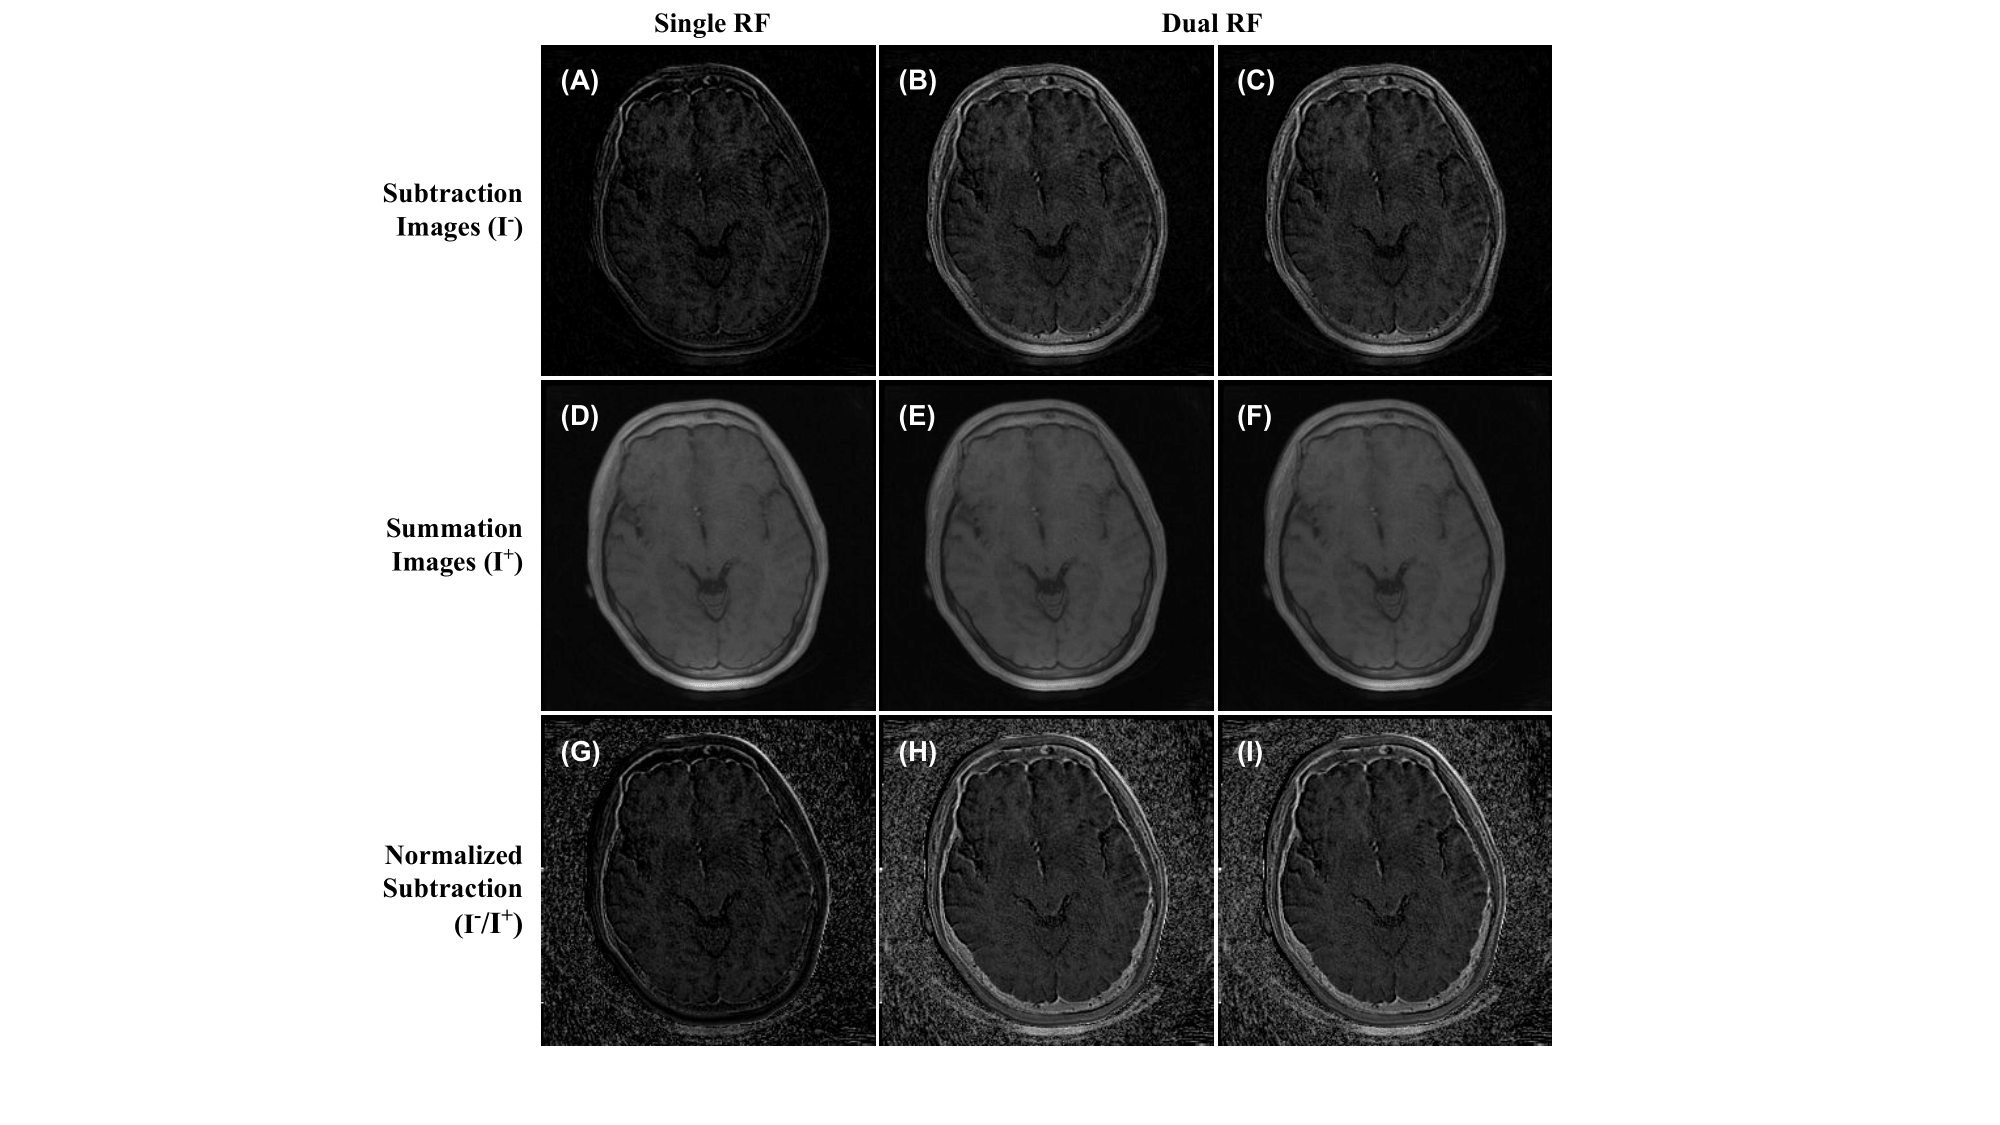
Figure 2. Images of UTE-OSC with single TE (32 μs). (A-C)
Subtraction of figure 1-i by figure 1-ii (A), 1-iii (B), and 1-iv (C). (D-F)
Summation of figure 1-i with figures 1-ii (D), 1-iii (E), and 1-iv (F). (G-I)
subtraction images A-C divided by summation images D-F, respectively.
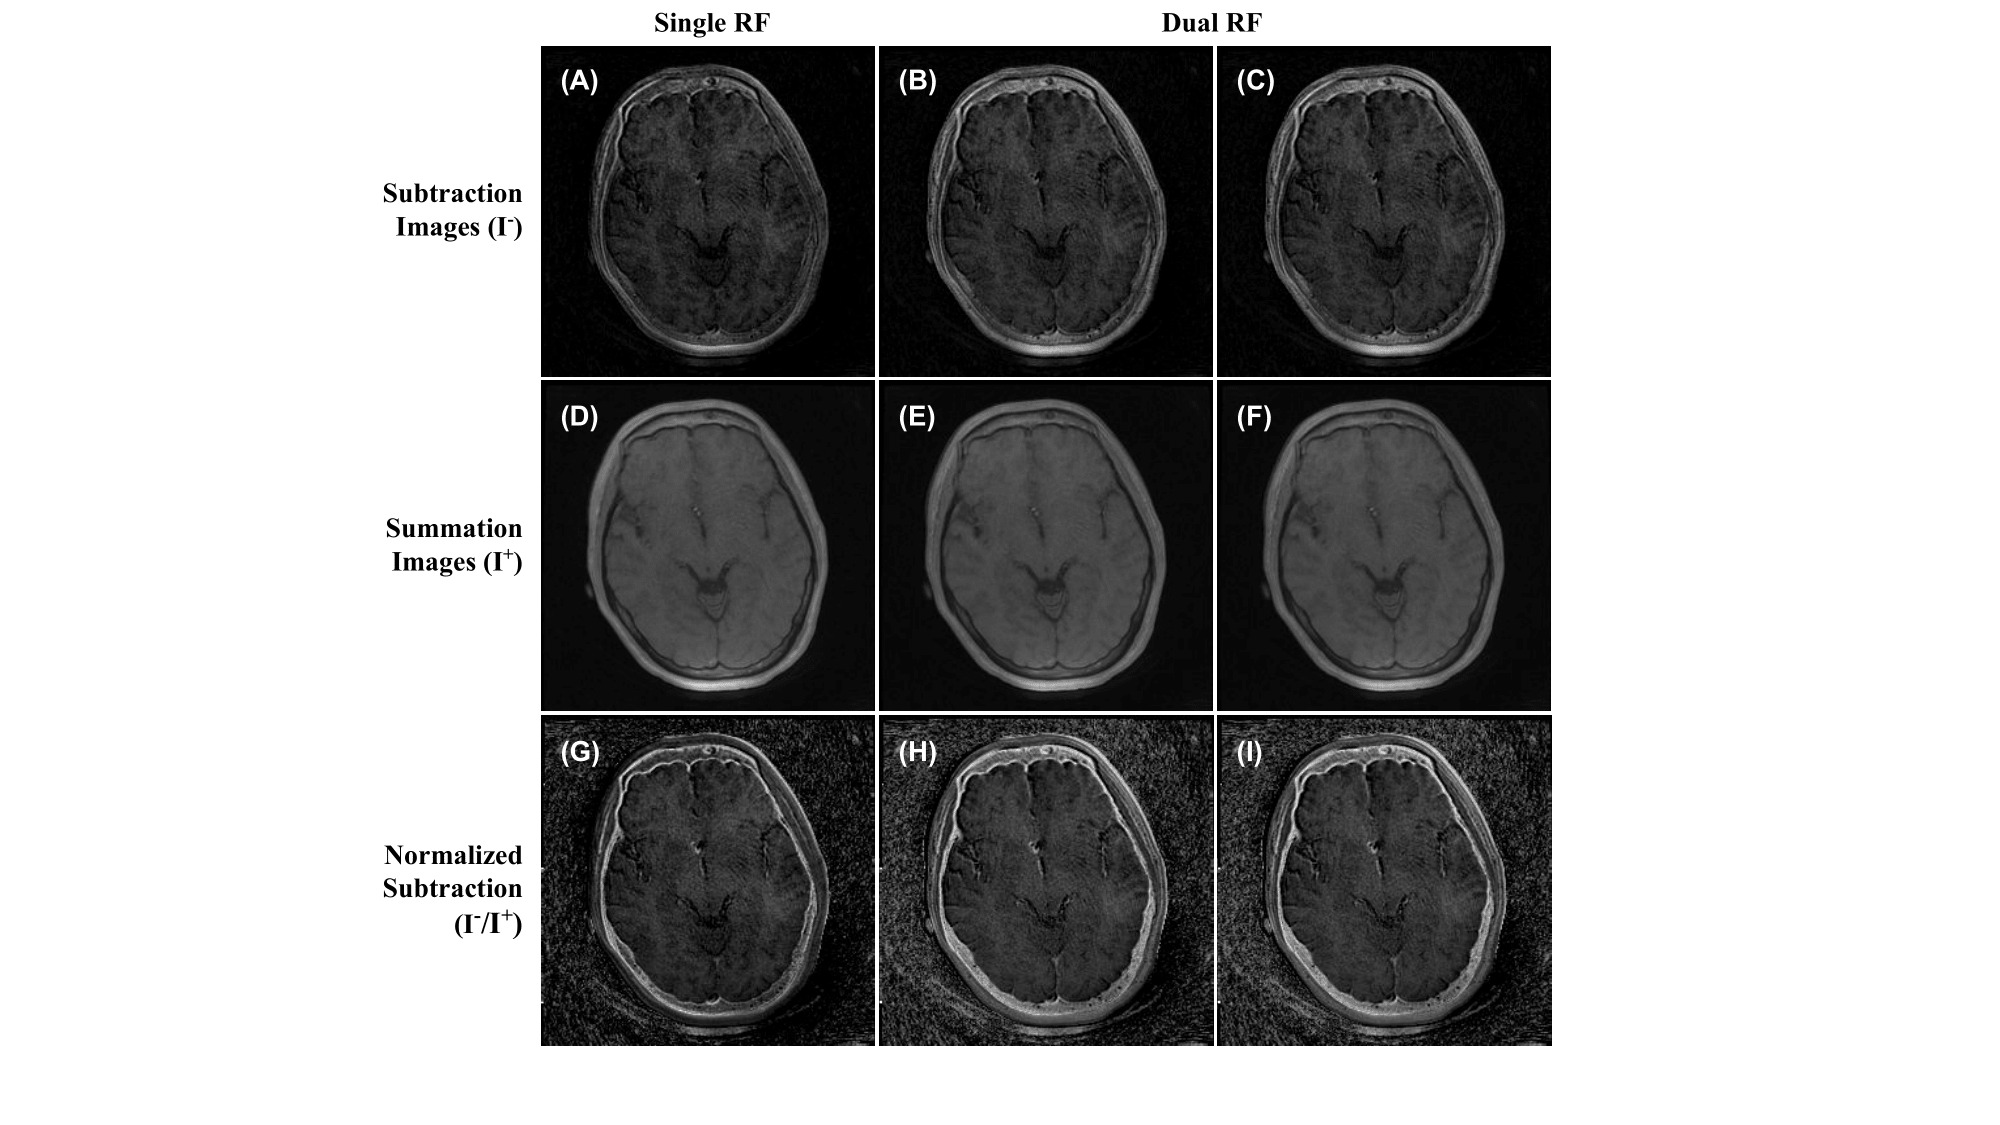
Figure 3. Images of UTE-OSC with dual TE (32 and 2200
μs). (A-C) Subtraction of figure 1-i by figure 1-vi (A), 1-vii (B), and 1-viii
(C). (D-F) Summation of figure 1-i with figure 1-vi (D), 1-vii (E), and 1-viii
(F). (G-I) subtraction images A-C divided by summation images D-F, respectively.
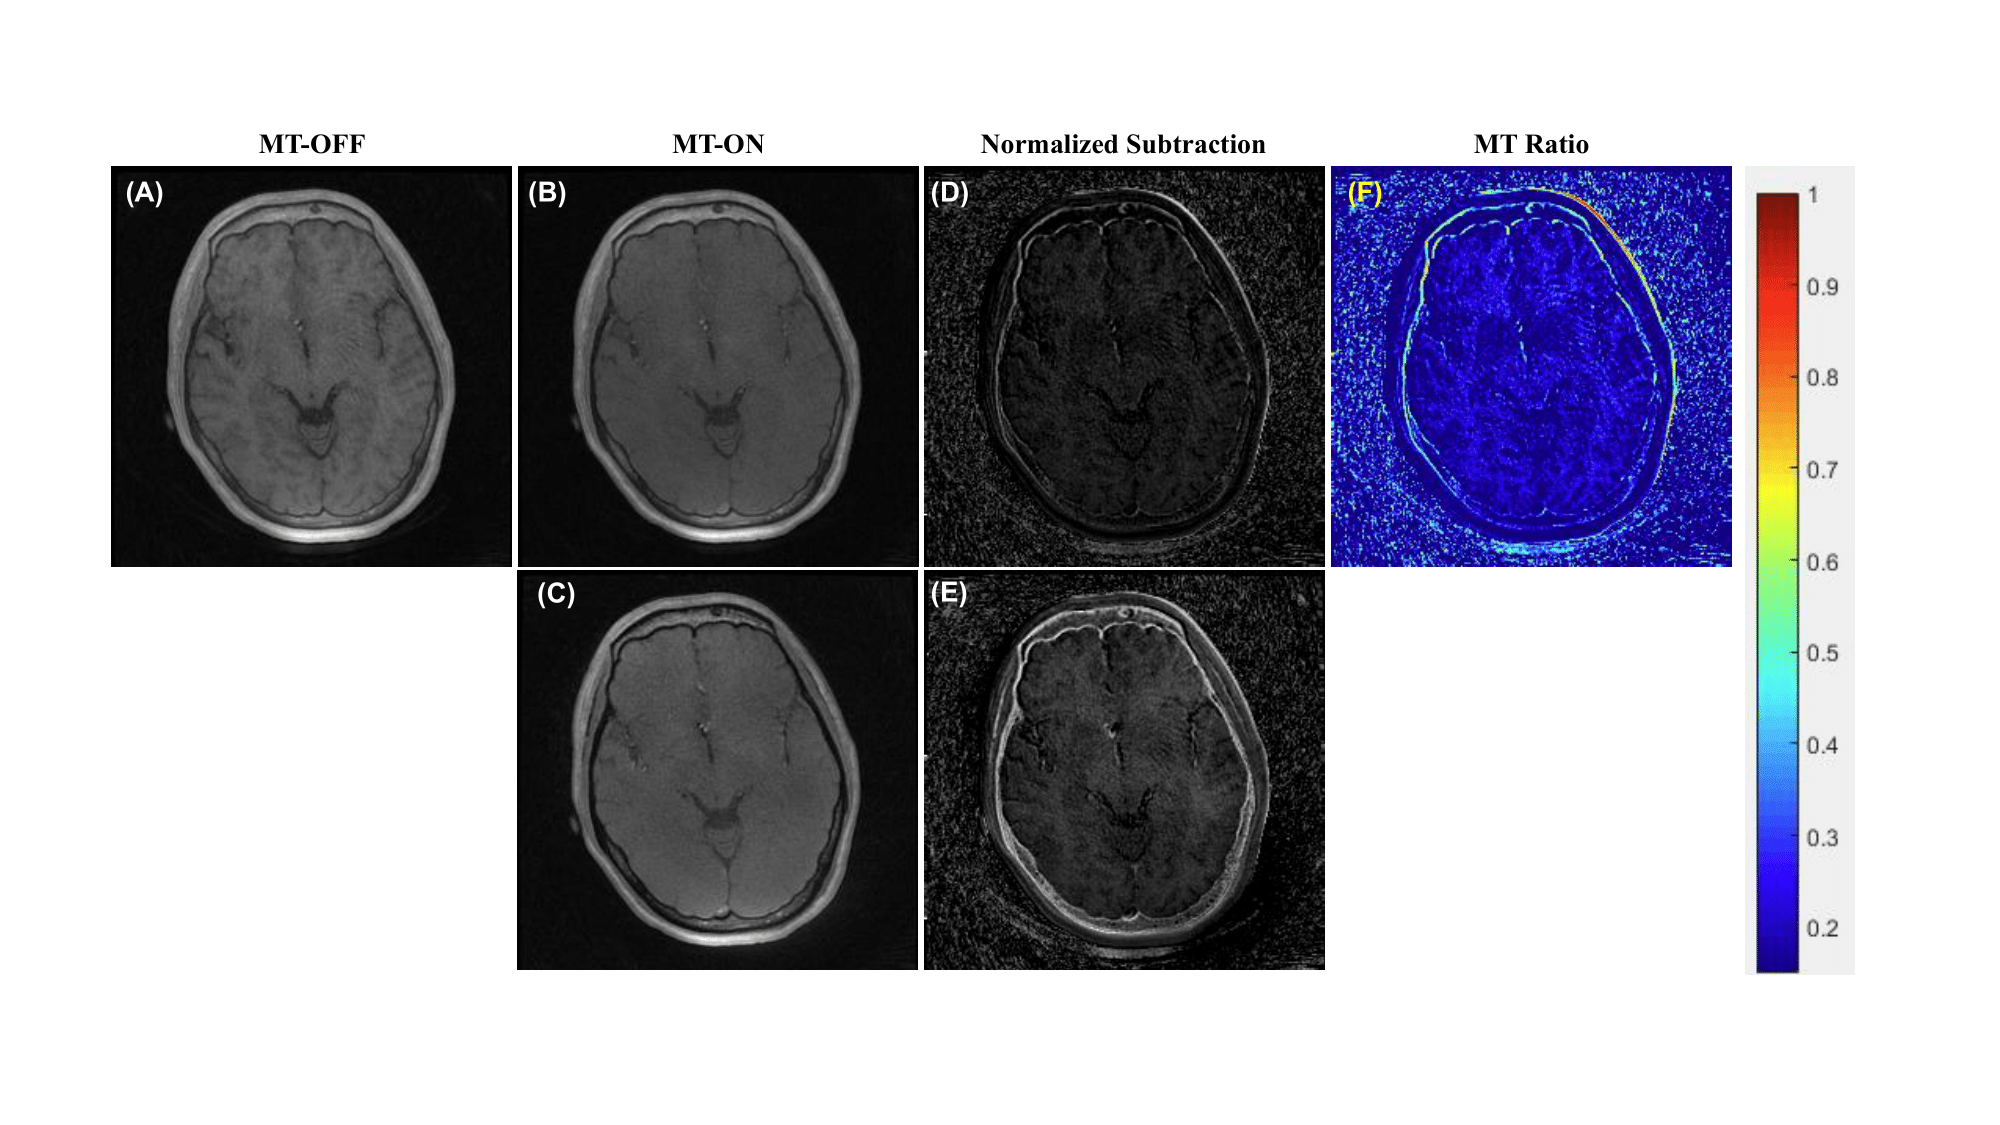
Figure 4. Images of UTE-OSC with single RF pulse width
(64 μs) and dual TE (32 μs) (A, B) and 2200 μs (C). Normalized subtraction
image resulting from the dual-echo sequence is better at showing the morphology
of the cortical bone (D, E). MT ratio map can be generated from the single RF,
single-echo UTE sequences with and without off-resonance saturation pulse (F),
which provides quantitative imaging of collagen backbone protons.
DOI: https://doi.org/10.58530/2023/1639