1638
Quantitative Susceptibility Mapping of Human Kidney Using Multi-echo Gradient Echo with Dual TR: A Preliminary Study1School of Biomedical Engineering, Southern Medical University, Guangzhou, China, 2Deparment of Radiology, Hainan General Hospital, Haikou, China, 3Philips Healthcare, Guangzhou, China, 4Philips Healthcare, Shanghai, China, 5Medical Imaging Center, Nanfang Hospital, Southern Medical University, Guangzhou, China
Synopsis
Keywords: Quantitative Imaging, Quantitative Susceptibility mapping, kidney
QSM of human kidney remains challenging due to chemical shift and respiratory motion. We utilized a dual-TR based multi-echo gradient echo (GRE) sequence and proposed an in-phase method to solve nonconvex optimization problem in water-fat separation for QSM of human kidney. The kidney QSM data were successfully acquired and calculated in all four volunteers. The kidney QSM implemented in our study could provide valuable imaging markers for the assessment of pathophysiological changes of kidney diseases.
Introduction
Renal fibrosis is the common pathway of chronic kidney disease (CKD)1. A non-invasive method for the evaluation of renal fibrosis is crucial for diagnosis, prognosis and antifibrotic therapy. Quantitative susceptibility mapping (QSM) was demonstrated feasible in characterizing inflammation and fibrosis of kidney in a mouse model ex vivo2. However, QSM in human kidney remains challenging due to chemical shift and respiratory motion. In this study, we utilized a dual TR based multi-echo gradient echo (GRE) sequence and proposed an in-phase method to solve nonconvex optimization problem in water-fat separation for kidney QSM of human.Methods
Data Acquisition: Data were acquired in 4 healthy volunteers on 3T clinical scanner (Ingenia, Philips) with a 3D dual-TR multi-echo GRE sequence. The diagram of the dual TR multi-echo GRE sequence was shown in Fig.1. Four in-phase echoes ( TE=2.3, 4.6, 6.9, 9.2ms) were acquired in the first TR and another 4 echoes with an increase TE of 0.76ms were acquired in the consecutive TR. All the other imaging parameters were identical of the two TRs: TR/FA = 21ms/15°, FOV = 350ⅹ350ⅹ60mm3, acquired matrix= 176ⅹ176ⅹ20, SENSE factor = 2, scan duration = 22seconds. The echoes were acquired with unipolar readout gradients to avoid phase offsets between even and odd echoes.Data processing: Fig.2 shows the flowchart of the data processing for kidney QSM.
a) The initial field map (fs) was generated from in-phase echoes by non-linear least square fitting and unwrapped via Graph cuts3.
b) Initial R2* map was fitted from the magnitude images of in-phase echoes via ARLO algorithm4.
c) The unwrapped field map and R2* map generated above were set as the initial values of the multi-peak fat R2*_IDEAL model. The final filed map (B) , the water image, fat image and R2* map were obtained with R2*_IDEAL iterations.
d) The tissue (local) filed (Bl) was extracted by removing the background filed (Bb) from the total field (B) with Laplacian boundary value method5.
e) QSM of kidney was calculated from local field by using MEDI6.
Results
The magnitude image, R2* map, fat fraction and QSM maps of the four volunteers are shown in Fig. 3.The mean QSM of whole kidney, cortex and medulla is illustrated in Table.1. The reported QSM values were determined with reference to paraspinal muscles.
Discussion
Kidney QSM was implemented in our study with a dual-TR based 3D multi-echo GRE sequence, with a practical breathhold scan duration of 22 seconds. The echoes of the first TR that have the water and fat in phase were used to tackle the nonconvex optimization problem in R2*_IDEAL model. The kidney QSM data were successfully acquired and calculated in all four volunteers. The kidney QSM implemented in this study could provide valuable imaging markers for the assessment of pathophysiological changes of kidney diseases.Acknowledgements
No acknowledgement found.References
1. Morrell GR, Zhang JL, Lee VS. Magnetic resonance imaging of the fibrotic kidney. J. Am. Soc. Nephrol. 2017;28:2564–2570 doi: 10.1681/ASN.2016101089.2. Xie L, Sparks MA, Li W, et al. Quantitative susceptibility mapping of kidney inflammation and fibrosis in type 1 angiotensin receptor-deficient mice. NMR Biomed. 2013;26:1853–1863 doi: 10.1002/nbm.3039.
3. Bioucas-Dias JM, Valadao G. Phase Unwrapping via Graph Cuts. IEEE Trans. Image Process. 2007;16:698–709 doi: 10.1109/TIP.2006.888351.
4. Pei M, Nguyen TD, Thimmappa ND, et al. Algorithm for fast monoexponential fitting based on Auto-Regression on Linear Operations (ARLO) of data. Magn. Reson. Med. 2015;73:843–850 doi: 10.1002/mrm.25137.
5. Zhou D, Liu T, Spincemaille P, Wang Y. Background field removal by solving the Laplacian boundary value problem. NMR Biomed. 2014;27:312–319 doi: 10.1002/nbm.3064.
6. Tian Liu, Jing Liu, Ludovic de Rochefort, et al. Morphology enabled dipole inversion (MEDI) from a single-angle acquisition: Comparison with COSMOS in human brain imaging. Magn. Reson. Med. 2011;66:777–783.
Figures
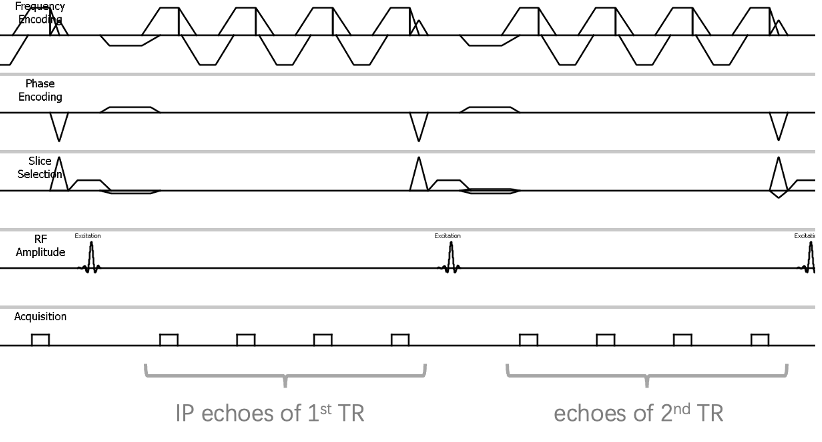
Fig.1 Diagram of dual_TR based 3D multi-echo GRE sequence for kidney QSM. In-phase (IP) echoes for the initialization of R2*_IDEAL model were acquired with unipolar read out gradients in the first TR.
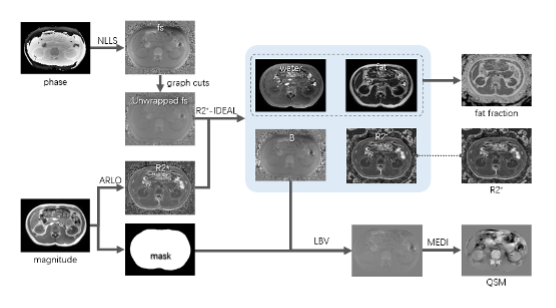
Fig.2 flowchart of data processing of the proposed method for kidney QSM.
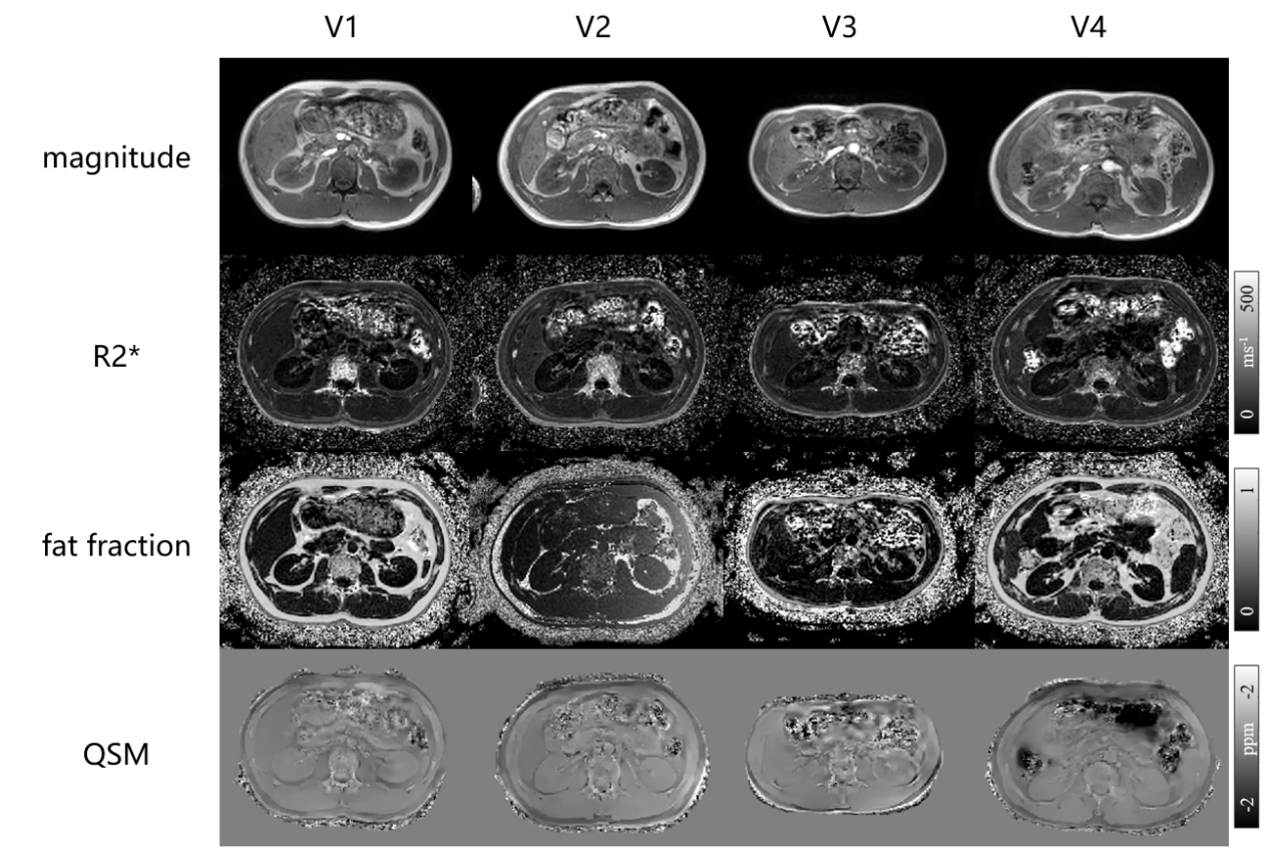
Fig.3. Magnitude images, R2* maps, fat fraction and QSM maps of four volunteers.
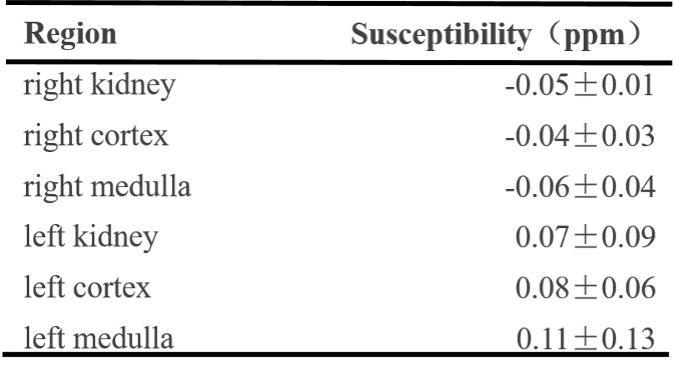
Tab.1. Kidney QSM distributions of healthy volunteers.