1636
Comparison of synthesized and acquired high b-value diffusion-weighted MRI for detection of prostate cancer1Department of Radiation Medicine and Applied Sciences, University of California San Diego, La Jolla, CA, United States, 2Department of Radiology, University of California San Diego, La Jolla, CA, United States, 3Department of Radiology, University of Chicago, Chicago, IL, United States, 4Sanford J. Grossmann Center of Excellence in Prostate Imaging and Image Guided Therapy, University of Chicago, Chicago, IL, United States, 5Department of Radiology, University of California San Diego, San Diego, CA, United States, 6Department of Neurosciences, University of California, La Jolla, CA, United States, 7Halicioglu Data Science Institute, University of California San Diego, La Jolla, CA, United States, 8Department of Radiation Medicine and Applied Sciences, University of California San Diego, San Diego, CA, United States, 9Department of Bioengineering, University of California San Diego, La Jolla, CA, United States
Synopsis
Keywords: Quantitative Imaging, Diffusion/other diffusion imaging techniques
High b-value diffusion-weighted imaging (DWI) plays an important role for accurate detection of clinically significant prostate cancer (csPCa). Synthesizing high b-value images decreases scan time. We compared (normalized) acquired and synthesized high b-value (2000s/mm2) DWI for detection of csPCa in 151 patients who underwent MRI and biopsy. We also compared these to an advanced DWI biomarker called the Restriction Spectrum Imaging restriction score (RSIrs). Synthesized images yielded similar results to acquired images within the prostate but failed to accurately represent the surrounding pelvic tissue. RSIrs was superior to synthesized and acquired high b-value DWI for detection of csPCa.Introduction
High b-value diffusion-weighted MR images are often used for the detection of prostate cancer [1]. However, acquisitions of high b-values (>1000s/mm2) add additional scan time, and the images proved to have a low signal to noise ratio [2]. Synthesized high b-value images are often used to replace acquired high b-value images but may not accurately reflect diffusion properties [3]. In this study, we synthesized (using a mono-exponential model) diffusion-weighted images (DWI) for b=2000s/mm2 and compared the results to acquired images qualitatively and quantitatively for the detection of clinically significant prostate cancer (csPCa, defined as grade group ≥2).Materials and Methods
This study included 151 patients who underwent MRI and biopsy evaluation for csPCa. Images were acquired using a 3T clinical scanner (Discovery MR750, GE Healthcare) in combination with a 32-channel phased-array body coil surrounding the pelvis. On biopsy, 86 of the 151 patients were found to have csPCa, while 65 had benign tissue or grade group 1 cancer. Contours for the prostate and suspicious lesions were defined for all patients per PI-RADS v2.1 by board-certified radiologists. DWI acquisition details are summarized in Table 1. All processing and analysis were performed using in-house scripts implemented in MATLAB (MathWorks, Inc). DWI were corrected for B0 inhomogeneities, gradient nonlinearity and eddy currents [4]. Multiple acquired DWI images were averaged for each b-value and normalized by median signal intensity of urine in the bladder. Synthetic b-value DWI (sDWI) was calculated using the mono-exponential formula below and using b-values up to 500s/mm2 (sDWI500) or up to 1000s/mm2 (sDWI1000).$S(b)=S0e-b ADC$
S(b) is DWI signal for a given b-value, b. S0 is the intercept. ADC is apparent diffusion coefficient. sDWI was calculated to match the acquired b-value DWI (aDWI) at b=2000s/mm2. Differences between sDWI and aDWI were estimated for five regions of interest (ROIs): prostate, prostate plus margin (5mm, 30mm or 70mm), and whole field of view (FOV). Comparisons used the 50th, 95th and 98th percentile of signal intensity for each ROI. The maximum DWI value within each ROI was evaluated for prediction of whether csPCa was found on biopsy. Receiver-operating characteristic (ROC) curves were calculated and the area under the curve (AUC) reported for aDWI and sDWI. ROC curves were also calculated for the Restriction Spectrum Imaging restriction score (RSIrs), a quantitative biomarker based on a multi-exponential DWI model and previously shown to be more accurate than conventional DWI [5–7]. For statistical comparison bootstrapping (N=10,000) was performed and the 95% confidence intervals and p-values were reported [8].
Results and Discussion
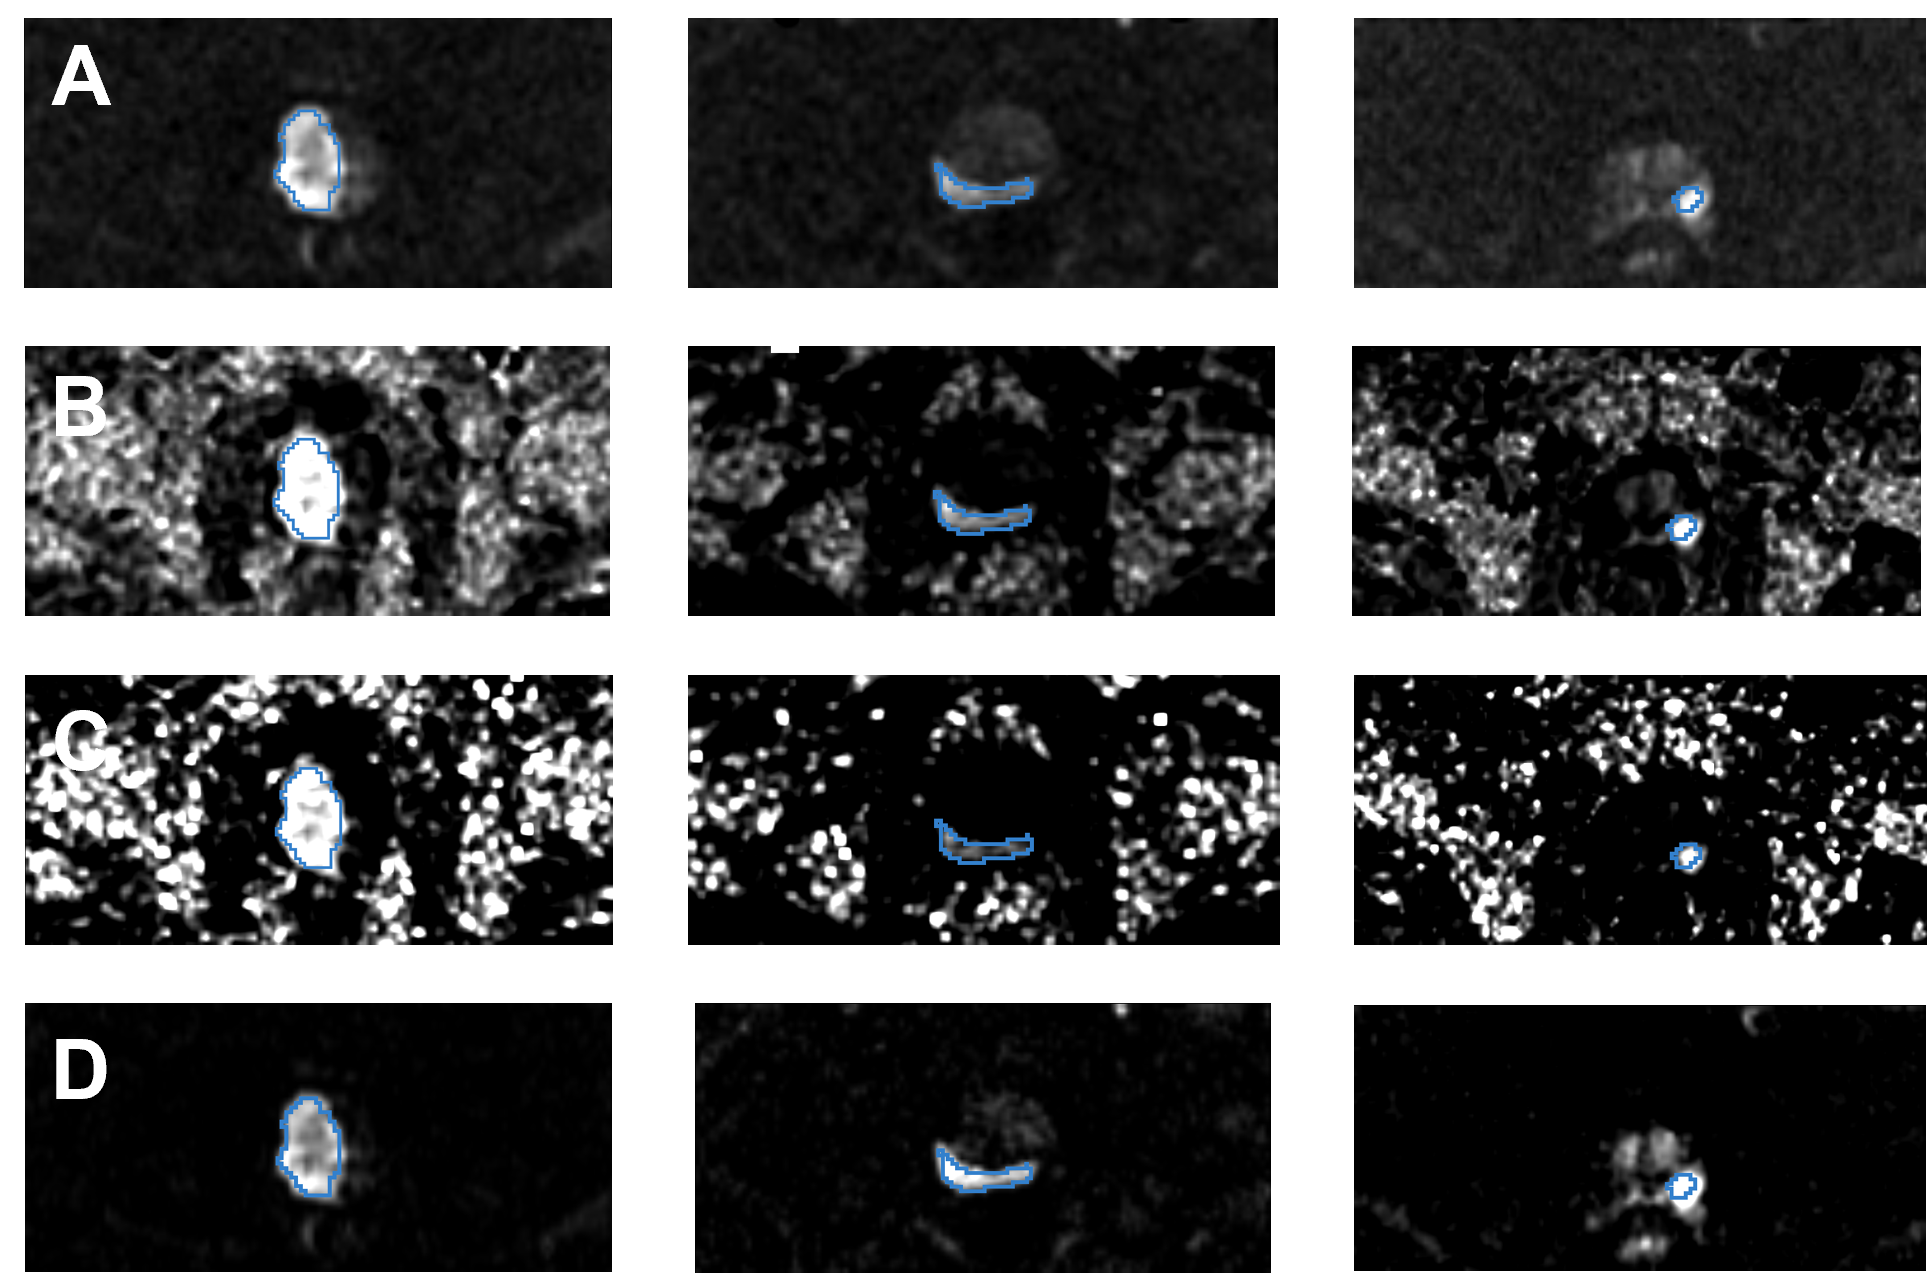
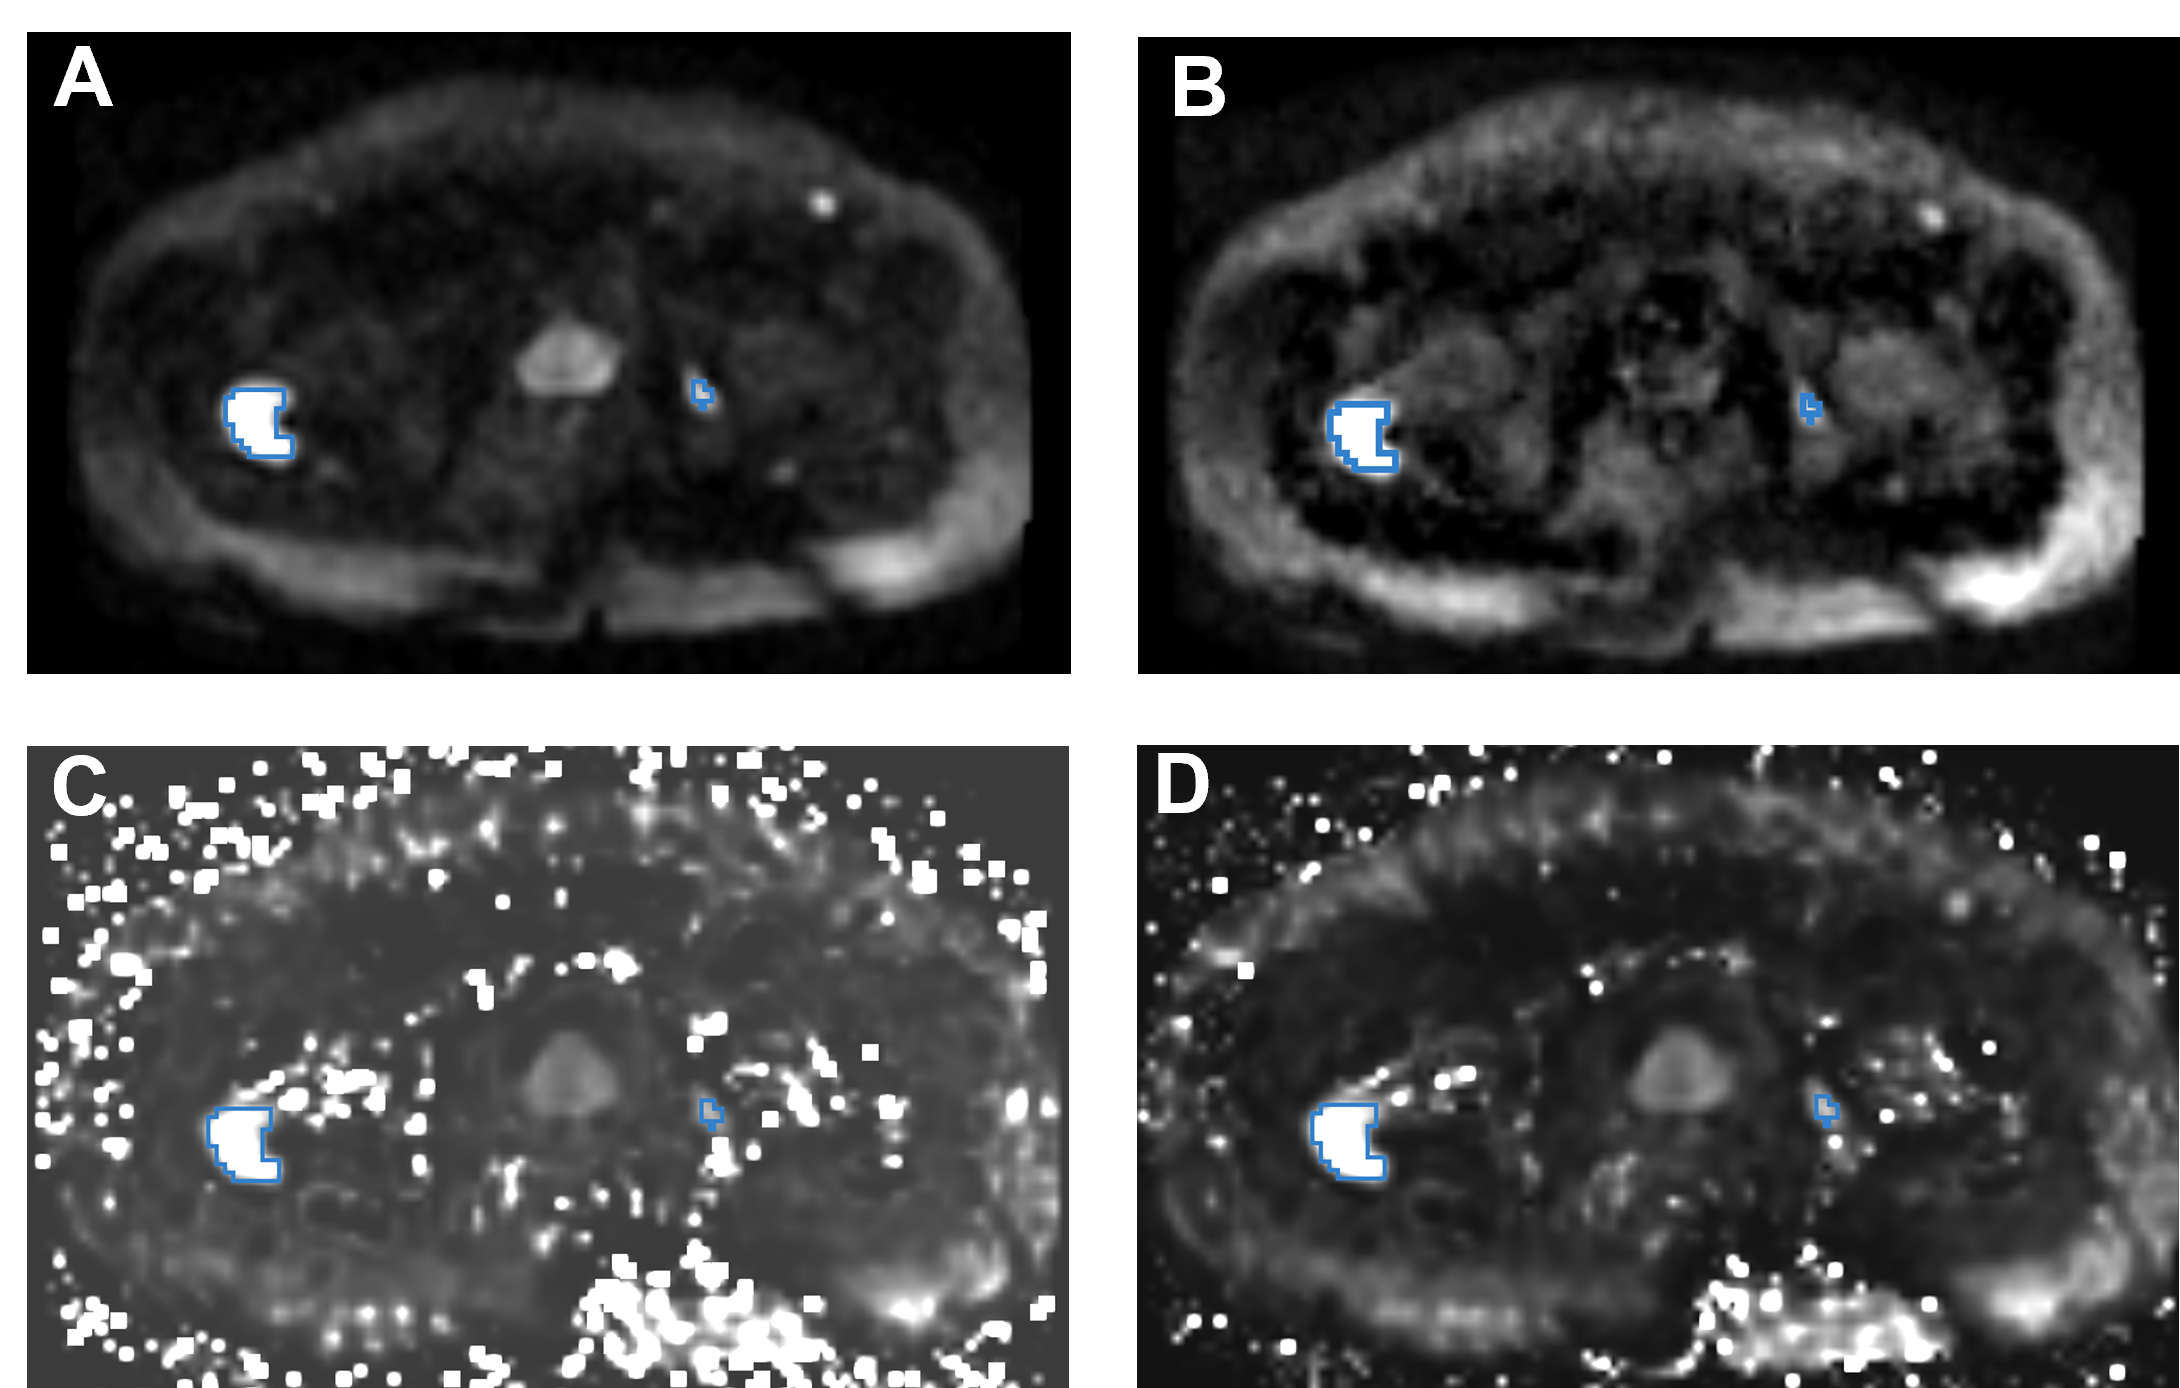
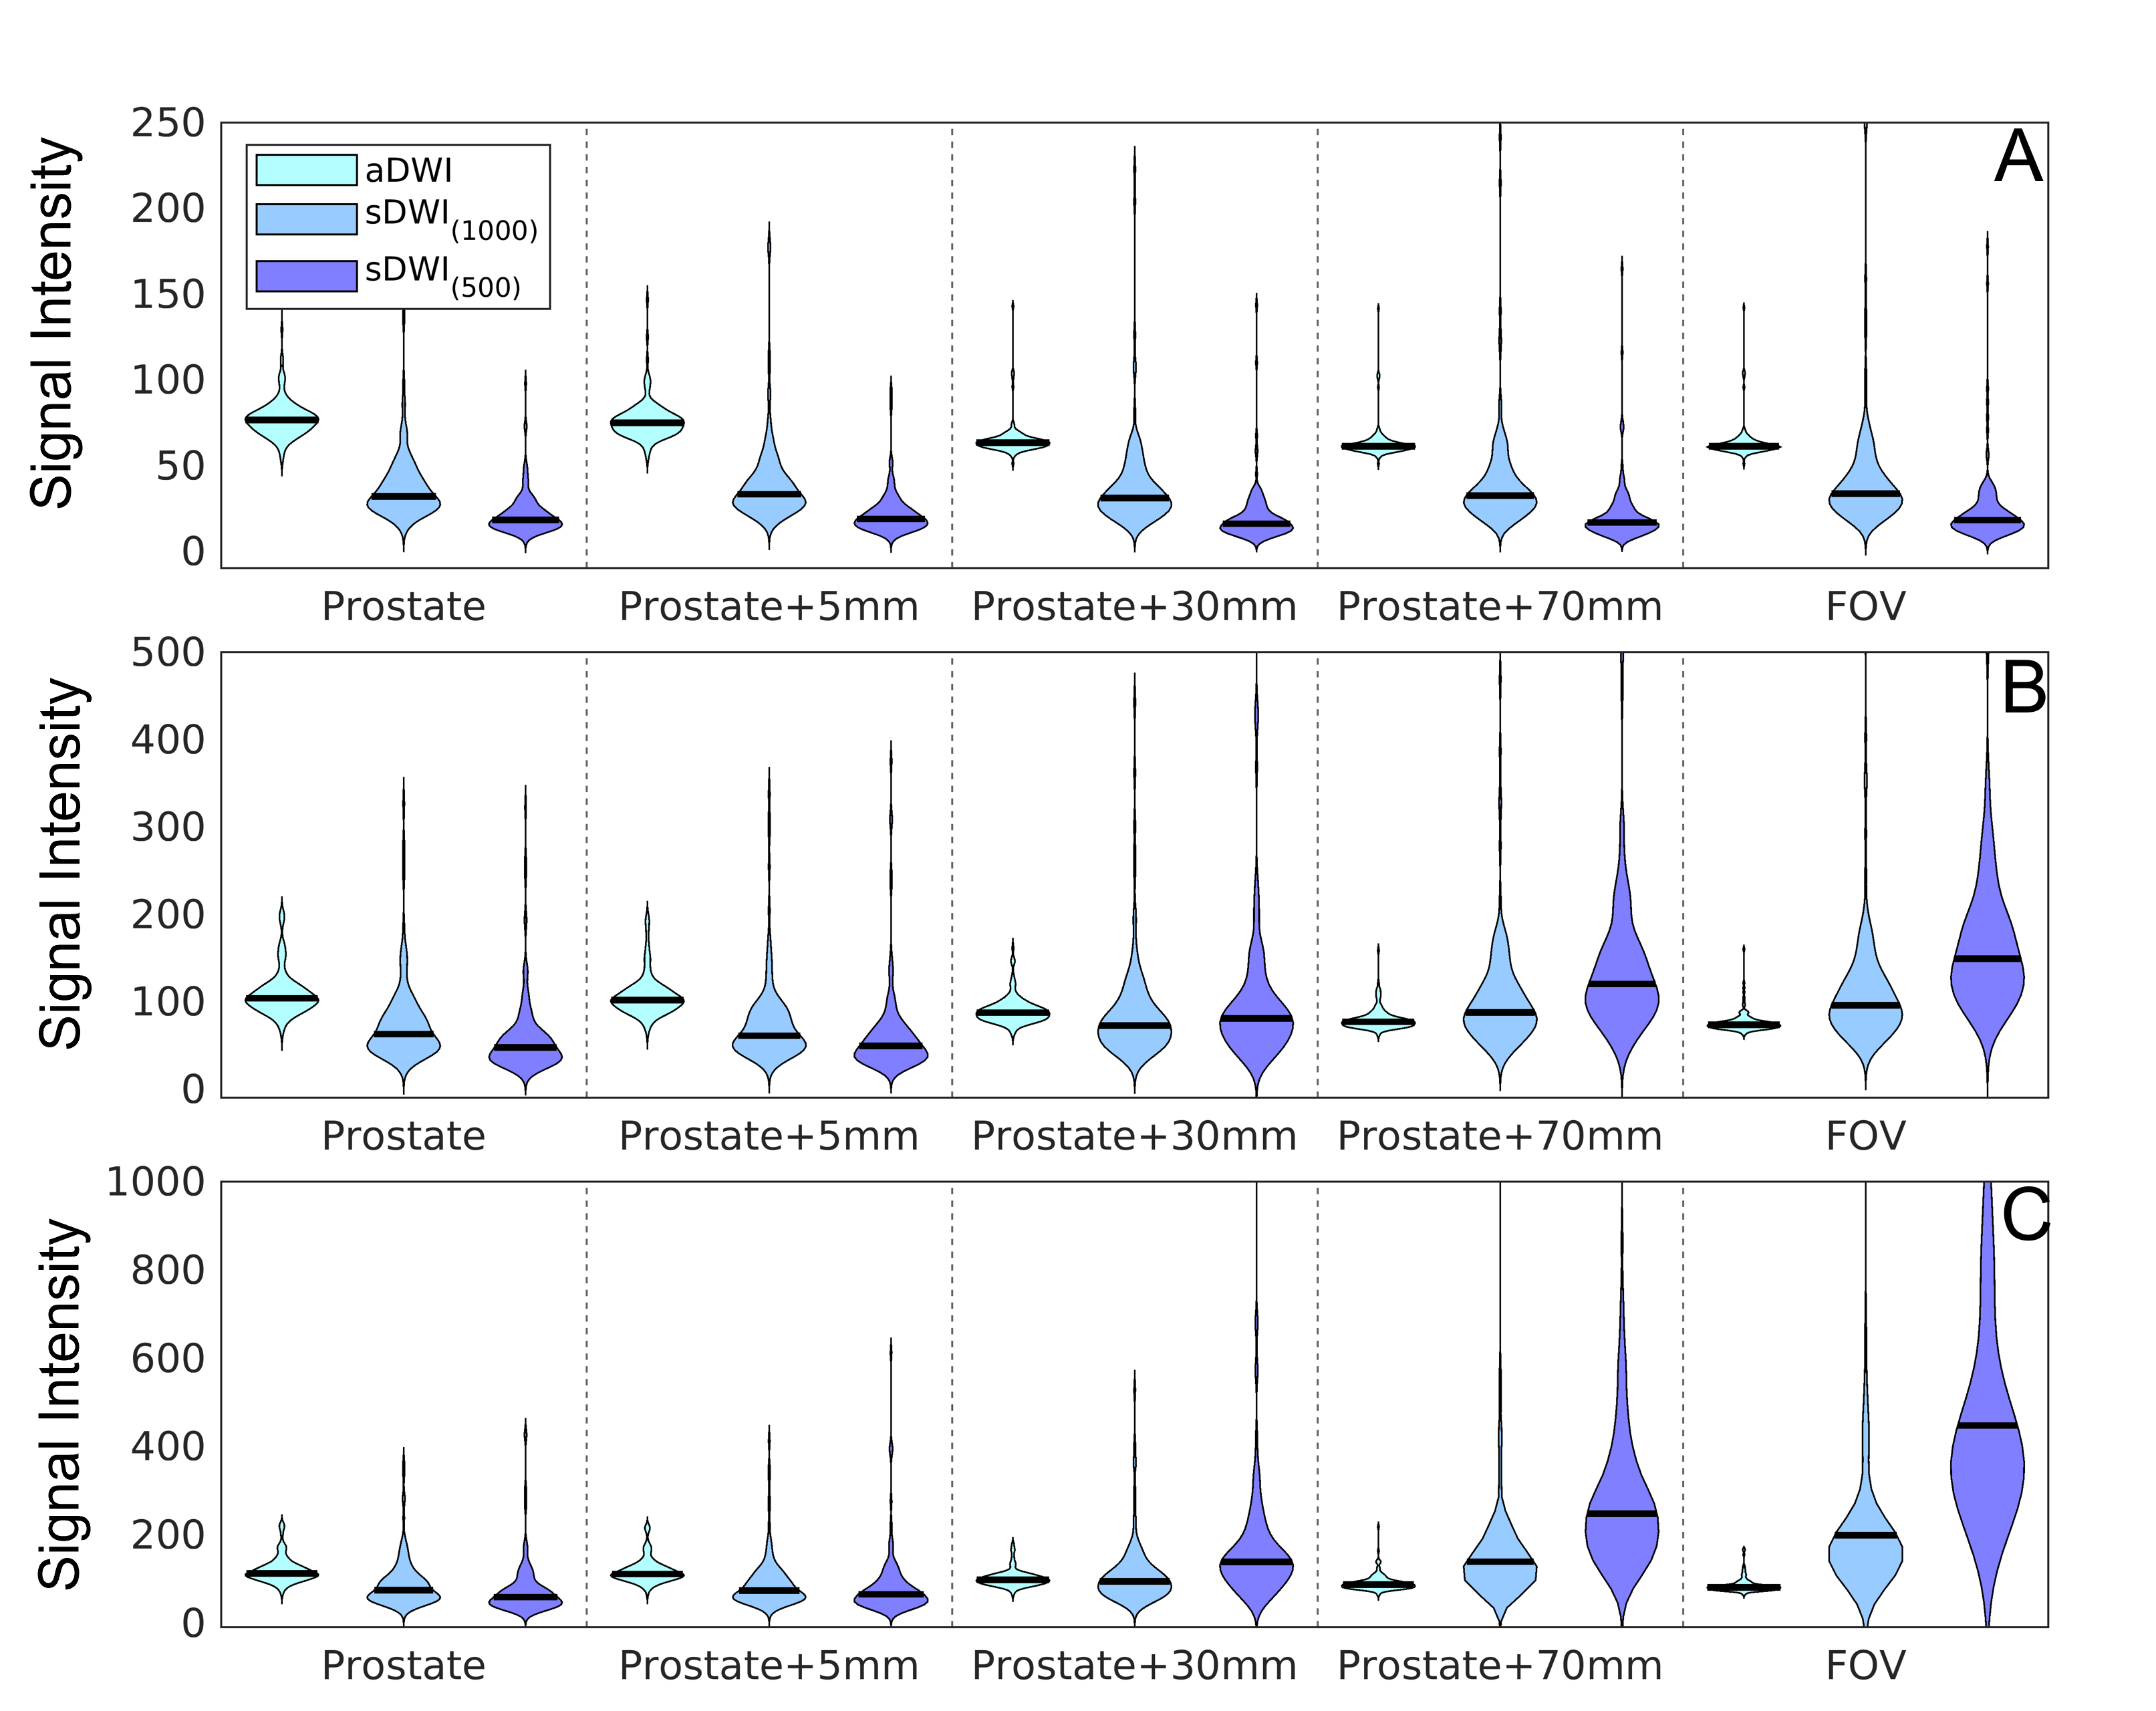
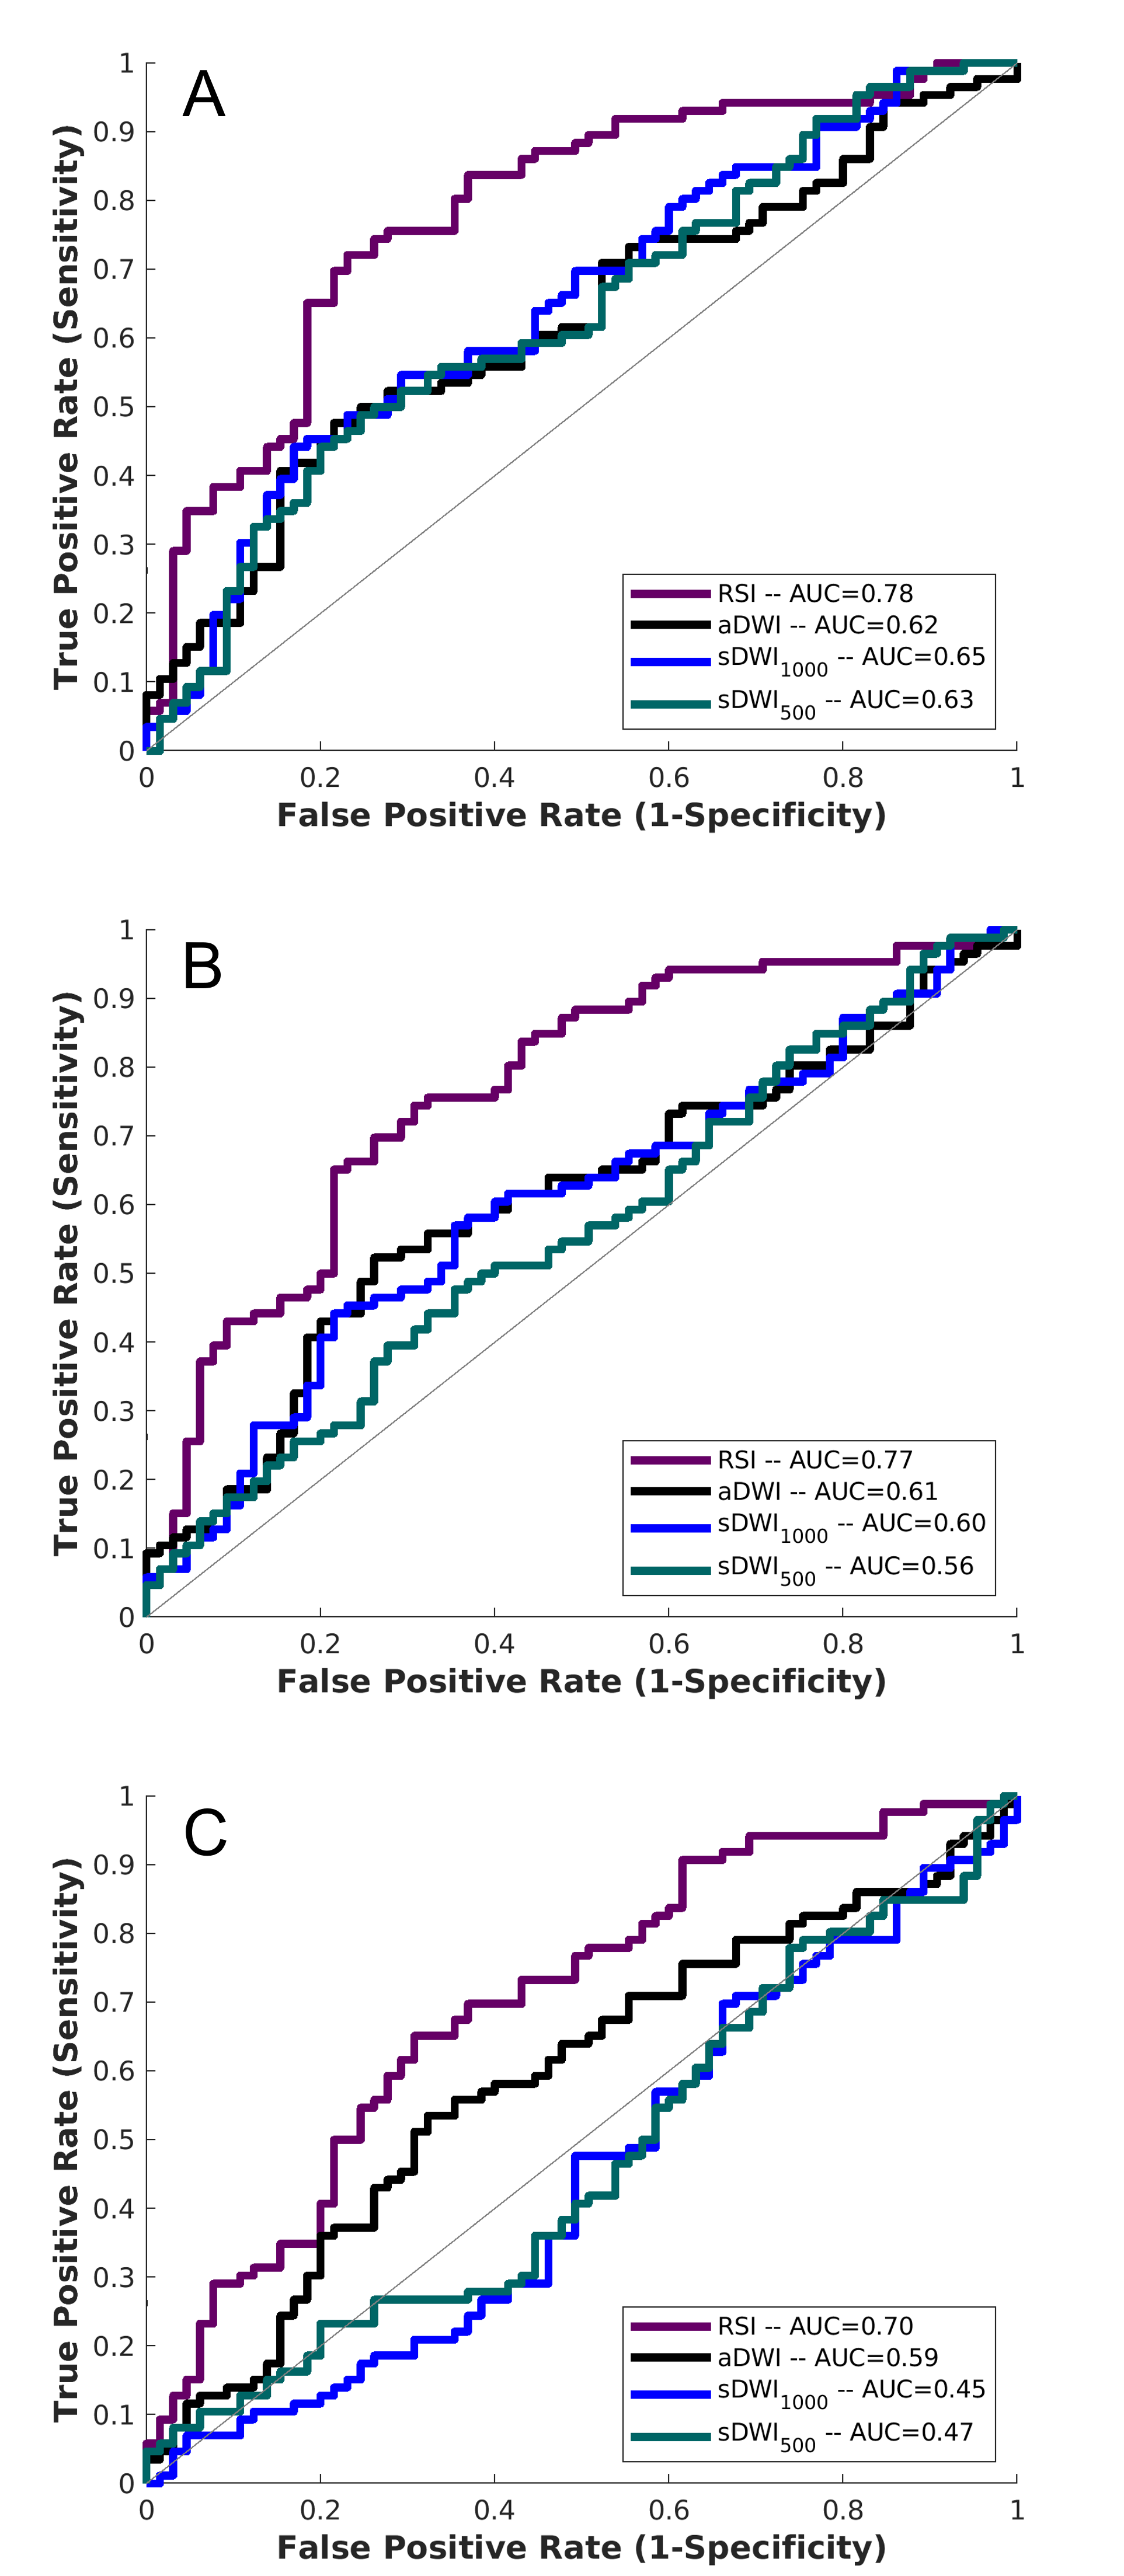
Within the prostate, mean±standard deviation of percent differences between sDWI and aDWI were ‑46±35% for sDWI1000 and -67±24% for sDWI500. A negative error indicates sDWI had lower values than aDWI. Within the prostate plus 5mm margin, the error was ‑46±36% for sDWI1000 and -66±25% for sDWI500. In the whole FOV, the difference was 3.1e28±2.2e29% for sDWI1000 and 2.2e56±1.87e57% for sDWI500. SDWI500 was overall worse than sDWI1000. Images of aDWI, sDWI500, sDWI1000 and RSIrs are presented for three representative patients in Figure 1, all of whom had PI-RADS 5 lesions confirmed as csPCa on biopsy. The tumor was visible with all DWI techniques. However, sDWI showed high signal intensity artifacts outside of the prostate, which could interfere with detection of metastatic lesions (see Figure 2). Figure 3 presents violin plots of the 50th, 95th and 98th percentile of signal intensity within different ROIs (prostate, prostate+5mm margin, prostate+30mm, prostate+70mm and whole FOV) for aDWI, sDWI500 and sDWI1000. For all ROIs, the 50th percentile is higher for aDWI. Signal intensities of sDWI are comparable to aDWI within the prostate and with a margin of 5mm. With increasing margin around the prostate, the variation of the signal increases for sDWI. For 95th and 98th percentile in the whole FOV and the prostate plus 70mm margin, sDWI intensity is overestimated compared to aDWI. In vendor-produced synthesized high b-value images, artifacts introduced by standard (mono-exponential) extrapolation from lower b-values may be filtered or censored and interpolated. How this is achieved is not always readily apparent. Similarly, for a given MRI exam, it is not obvious which parts of the synthesized high b-value images are extrapolations from lower b-values vs. filled in from surrounding voxels. For detection of csPCa, the AUCs for sDWI and aDWI were similar in both the prostate and prostate+5mm (Figure 3). The AUC values for RSIrs, aDWI, sDWI1000 and sDWI500 within the prostate 0.78[95% confidence interval: 0.71, 0.86], 0.62[0.53, 0.71], 0.65[0.56, 0.73] and 0.63[0.54, 0.72], respectively. Within the prostate+5mm, AUCs were 0.61[0.52, 0.69] for aDWI, 0.60[0.51, 0.69] for sDWI1000, and 0.56[0.47, 0.65] for sDWI500. Classification accuracy decreased significantly for sDWI when considering the whole FOV (AUC = 0.45[0.36, 0.54] for sDWI1000 and 0.47[0.38, 0.56] for sDWI500). RSIrs (p<0.01) was superior to sDWI and aDWI for all ROIs. The AUC of RSIrs was 0.77[0.69, 0.84] within prostate+5mm and decreased to 0.70[0.61, 0.78] for the full FOV.Conclusions
Synthetic DWI is qualitatively comparable to aDWI within the prostate. However, high signal intensity artifacts are introduced with sDWI in the surrounding pelvic tissue that interfere with quantitative cancer detection and that might mask metastases. RSIrs, an advanced DWI biomarker, yields superior quantitative csPCa detection than sDWI or aDWI.Acknowledgements
No acknowledgement found.References
[1] Weinreb JC, Barentsz JO, Choyke PL, et al. PI-RADS Prostate Imaging - Reporting and Data System: 2015, Version 2. Eur Urol 2016; 69: 16–40.
[2] Dietrich O, Biffar A, Baur-Melnyk A, et al. Technical aspects of MR diffusion imaging of the body. European Journal of Radiology 2010; 76: 314–322.
[3] Grant KB, Agarwal HK, Shih JH, et al. Comparison of calculated and acquired high b-value diffusion weighted imaging in prostate cancer. Abdom Imaging 2015; 40: 578–586.
[4] Holland D, Kuperman JM, Dale AM. Efficient correction of inhomogeneous static magnetic field-induced distortion in Echo Planar Imaging. Neuroimage 2010; 50: 175–183.
[5] Conlin CC, Feng CH, Rodriguez-Soto AE, et al. Improved Characterization of Diffusion in Normal and Cancerous Prostate Tissue Through Optimization of Multicompartmental Signal Models. Journal of Magnetic Resonance Imaging 2021; 53: 628–639.
[6] Feng CH, Conlin CC, Batra K, et al. Voxel-level Classification of Prostate Cancer on Magnetic Resonance Imaging: Improving Accuracy Using Four-Compartment Restriction Spectrum Imaging. Journal of Magnetic Resonance Imaging 2021; 54: 975–984.
[7] Zhong AY, Digma LA, Hussain T, et al. Patient-level detection of grade group ≥2 prostate cancer using quantitative diffusion MRI. 2021; 2021.05.24.21256461.
[8] McCammack KC, Kane CJ, Parsons JK, et al. In vivo prostate cancer detection and grading
Figures