1630
A 3D large-coverage carotid quantitative vessel wall imaging solution: from imaging protocol to post-processing pipeline1Center for Biomedical Imaging Research, Department of Biomedical Engineering, School of Medicine Tsinghua Univeristy, Beijing, China
Synopsis
Keywords: Quantitative Imaging, Data Acquisition, Data analysis
Carotid quantitative high-resolution MR vessel wall imaging, such as T1- and T2-mapping, showed a great potential to stratify vulnerable plaques. This study proposed a 3D large-coverage carotid quantitative imaging solution including bright- and black-blood quantitative VWI protocol and an efficient post-processing pipeline. The proposed protocol was in excellent agreement with standard mapping in measuring T1 (R2=0.99) and T2 (R2=0.94) validated by phantom study. The volunteer experiment proved that there was no significant difference in measuring T1 (1103.89±50.86 ms vs. 1125.34±50.39 ms, P=0.26) and T2 (31.23±1.50 ms vs. 31.69±1.54 ms, P=0.21) of muscle between the proposed protocol and clinical reference mapping.
Introduction
The high-resolution MR vessel wall imaging (HR-VWI) has been demonstrated to be an optimal non-invasive imaging approach for accurately characterizing carotid vulnerable plaques1. Multi-contrast HR-VWI, including time-of-flight (TOF), T1 weighted and T2 weighted imaging, is recognized as the optimal protocol with the minimum sequences for plaque characterization2. Recently, carotid quantitative HR-VWI, such as T1- and T2-mapping, showed a great potential to better stratify vulnerable plaques3. However, current quantitative HR-VWI technique lacks angiographic information which is important for delineating lumen boundaries, detecting surface calcification and ulceration, as well as measuring luminal stenosis. Since the workload of fitting T1 and T2 values globally for carotid quantitative imaging is challenging, developing an efficient post-processing approach is warranted. In this study, we proposed a 3D large-coverage carotid quantitative imaging solution including bright- and black-blood quantitative VWI protocol and an efficient post-processing pipeline, and validated its feasibility.Methods
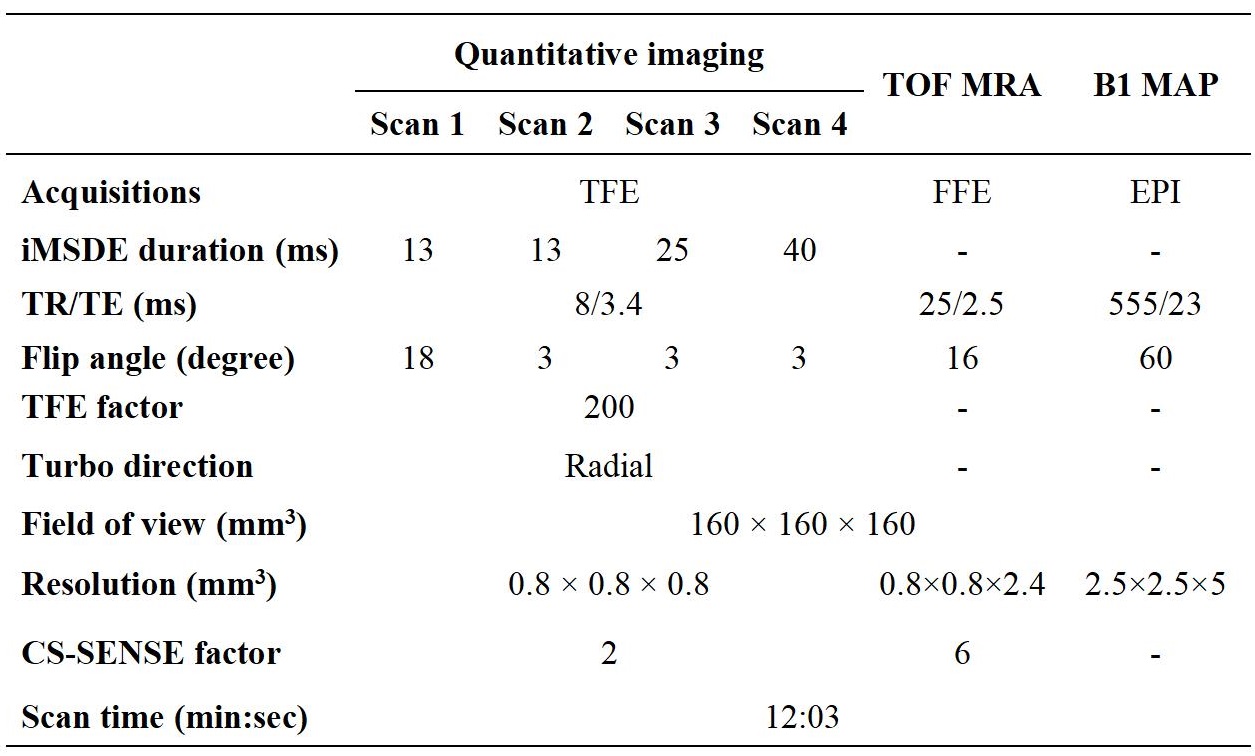
Imaging protocol:The carotid bright- and black-blood quantitative WVI protocol consisted of the following sequences:(a) quick bright-blood TOF imaging for the vessel localization and segmentation; (b) black-blood quantitative imaging (SCAN 1-4) for quantitative T1 and T2 map; and (c) B1 mapping. The SCAN 1-4 adopted variable flip angles, different iMSDE preparation time to generate multi-contrast images which were used to estimate T1 (fitted by SCAN 1-2) and T2 (fitted by SCAN 2-4) maps according to the equation (1). The coverage of these imaging sequences was optimized to cover both intracranial and extracranial carotid arteries. The detailed imaging parameters are shown in Table 1. Then, compressed sensing-sensitivity encoding reconstruction (CS SENSE, factor=2) was applied in the SCAN 1-4 to reduce the scan time. In total, the acquisition time of these imaging sequences is 12 minutes.
$$M = Asin\alpha\frac{(1-e^{-\frac{TR}{T1}})}{1-e^{-\frac{TR}{T1}}cos\alpha}e^{\frac{-TE^{prep}}{T2}} (1)$$
Post processing pipeline:
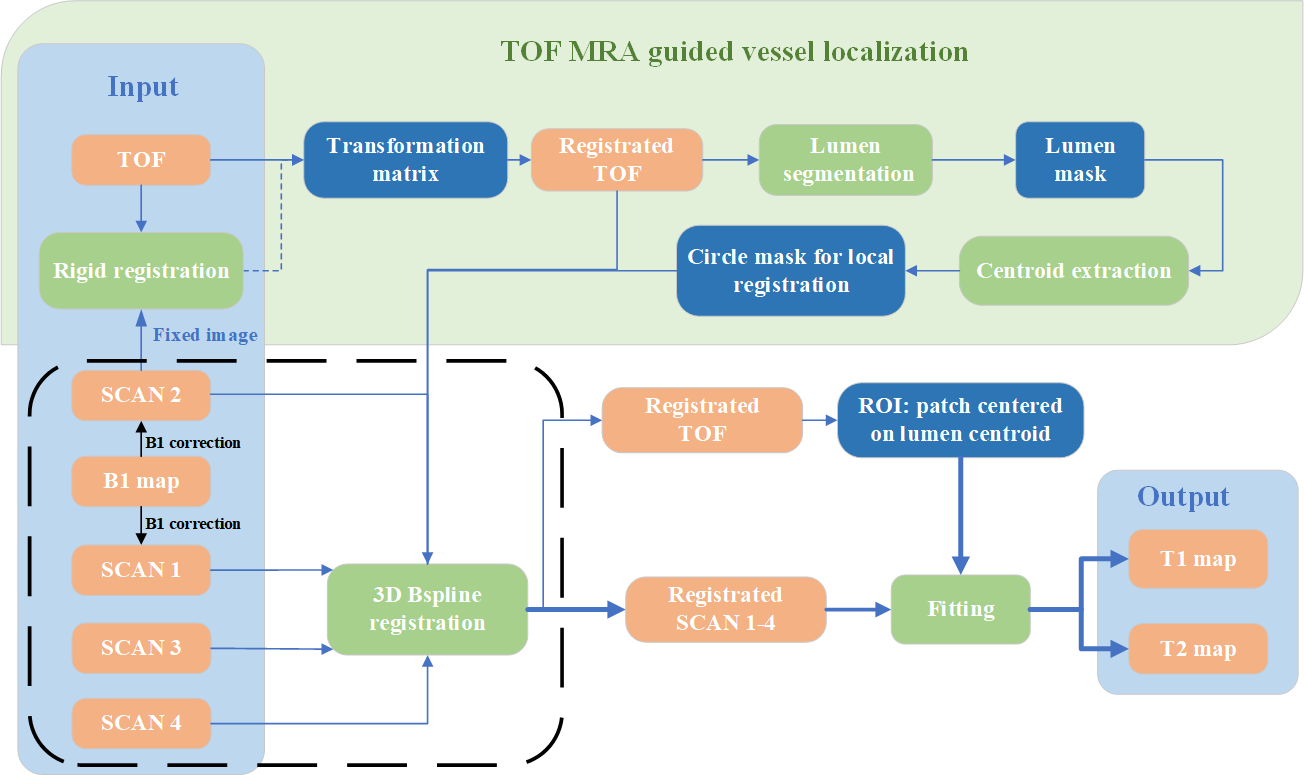
Traditionally, the off-line fitting of carotid black-blood quantitative VWI (SCAN 1-4) is time-consuming. A TOF-guided automatic fast post-processing pipeline for the mapping estimation was proposed (Figure 1).
First, a rigid registration was performed on TOF and SCAN 2 images to achieve an global alignment. Second, the lumen of the registered TOF image was segmented in two steps: (1) a rough threshold-based segmentation to generate initial lumen area; (2) a level-set-based4 algorithm using the shrunken initial lumen boundary to perform precise segmentation. Subsequently, the centerline of the lumen was extracted according to Euclidean distance. Third, local vessel wall B-spline5 registration between TOF and SCAN 1-4 images was performed using a circular vessel mask of 10 mm whose center was determined by the centerline on TOF images. In this way, the lumen and its surrounding area on the TOF and SCAN1-4 images is strictly aligned with each other. Finally, T1 and T2 mapping of the operator determined patch around lumen area in SCAN 1-4 was estimated by least square algorithm provided by Matlab 2021a (MathWorks, Inc. Natick, Massachusetts, USA).
Phantom experiment:
Phantom experiments were performed to validate the accuracy of carotid black-blood quantitative imaging (SCAN 1-4) in calculating T1 and T2 values. A phantom with different T1 and T2 values was scanned using the black-blood quantitative imaging and standard mapping sequences (inversion recovery spin echo for T1 mapping and spin echo for T2 mapping) on a 3.0 T MR scanner (Ingenia CX, Philips Healthcare, Best, the Netherlands) with the 32-channel head coil.
Volunteer experiment:
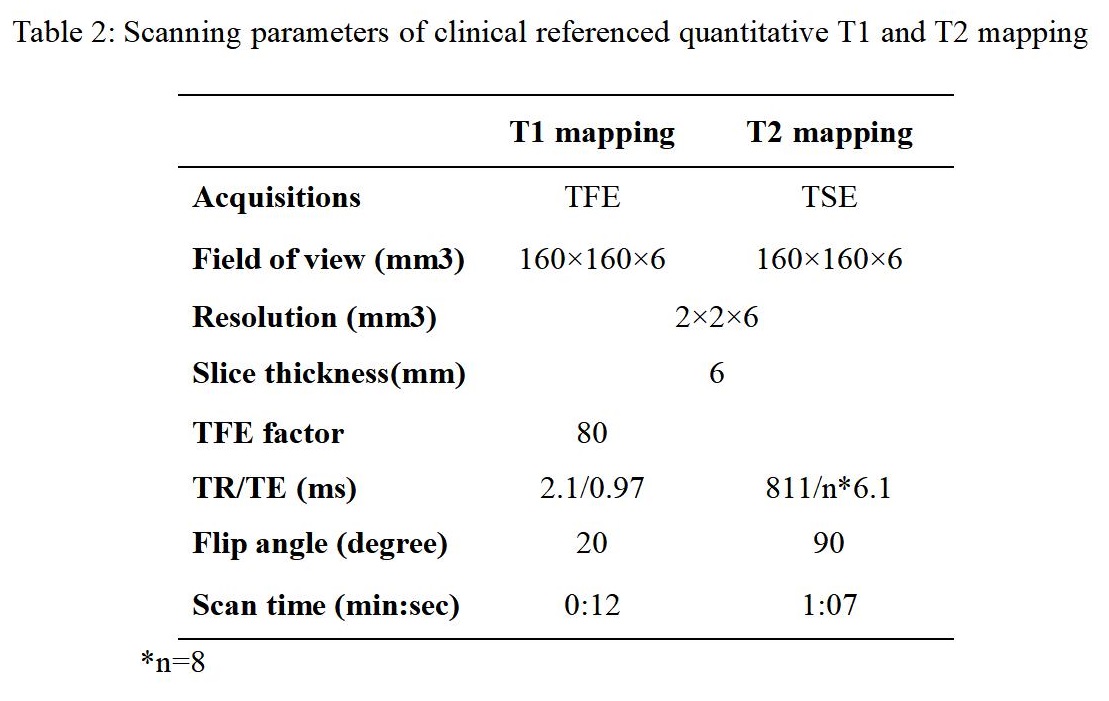
Ten healthy volunteers (24.1±1.8 yrs, 5 males) were recruited in this study. The proposed protocol and clinical referenced quantitative T1 and T2 mapping (Table 2) sequences were acquired for all subjects on a 3.0 T MR scanner.
Image analysis:
The T1 and T2 values of the phantom were fitted using least square algorithm provided by Matlab 2021a. The T1 and T2 values of healthy subjects were calculated using the proposed post-processing pipeline.
Statistical analysis:
The correlation of T1 and T2 values measured by the carotid black-blood quantitative VWI with them measured by standard mapping in phantom experiment was assessed by linear regression. The differences in T1 and T2 value of cervical muscle measured on the proposed bright-black quantitative VWI and clinical referenced quantitative maps in volunteer experiment was assessed by paired t-test.
Results
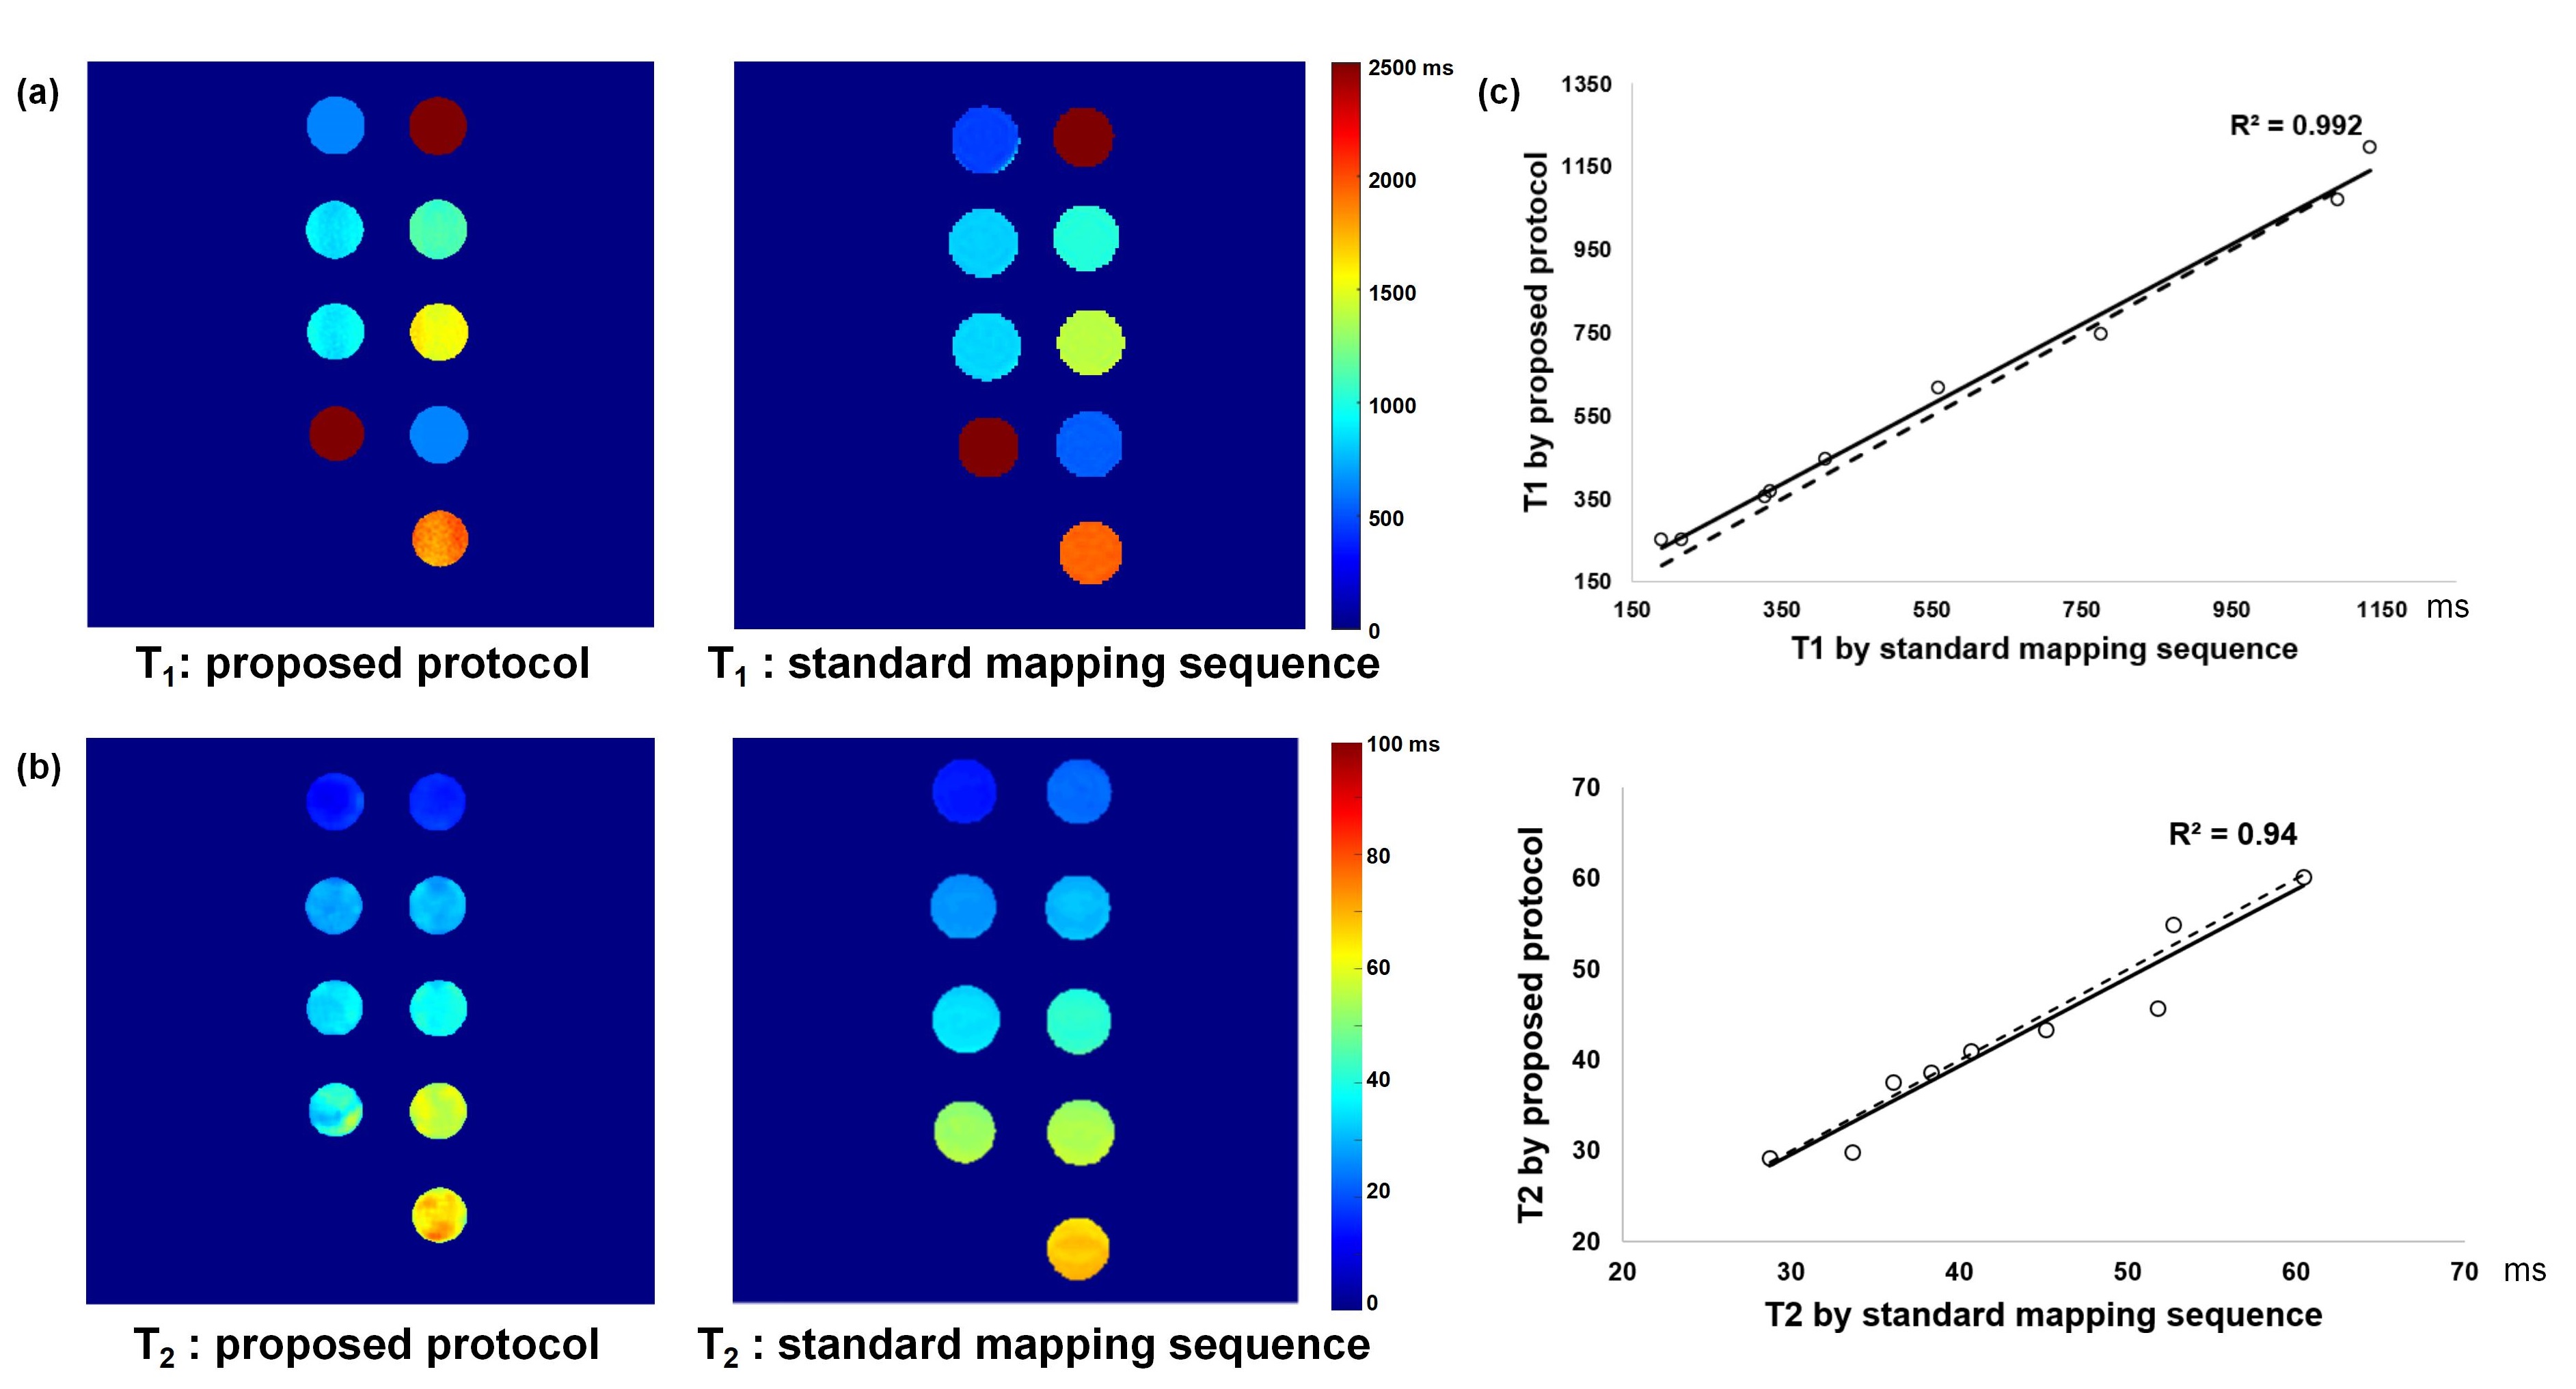
Phantom experiment:Figure 2 showed that the carotid black-blood quantitative VWI had an excellent agreement with the standard maps in measuring T1 (R2=0.99) and T2 (R2=0.94) values of phantoms.
Volunteer experiment:
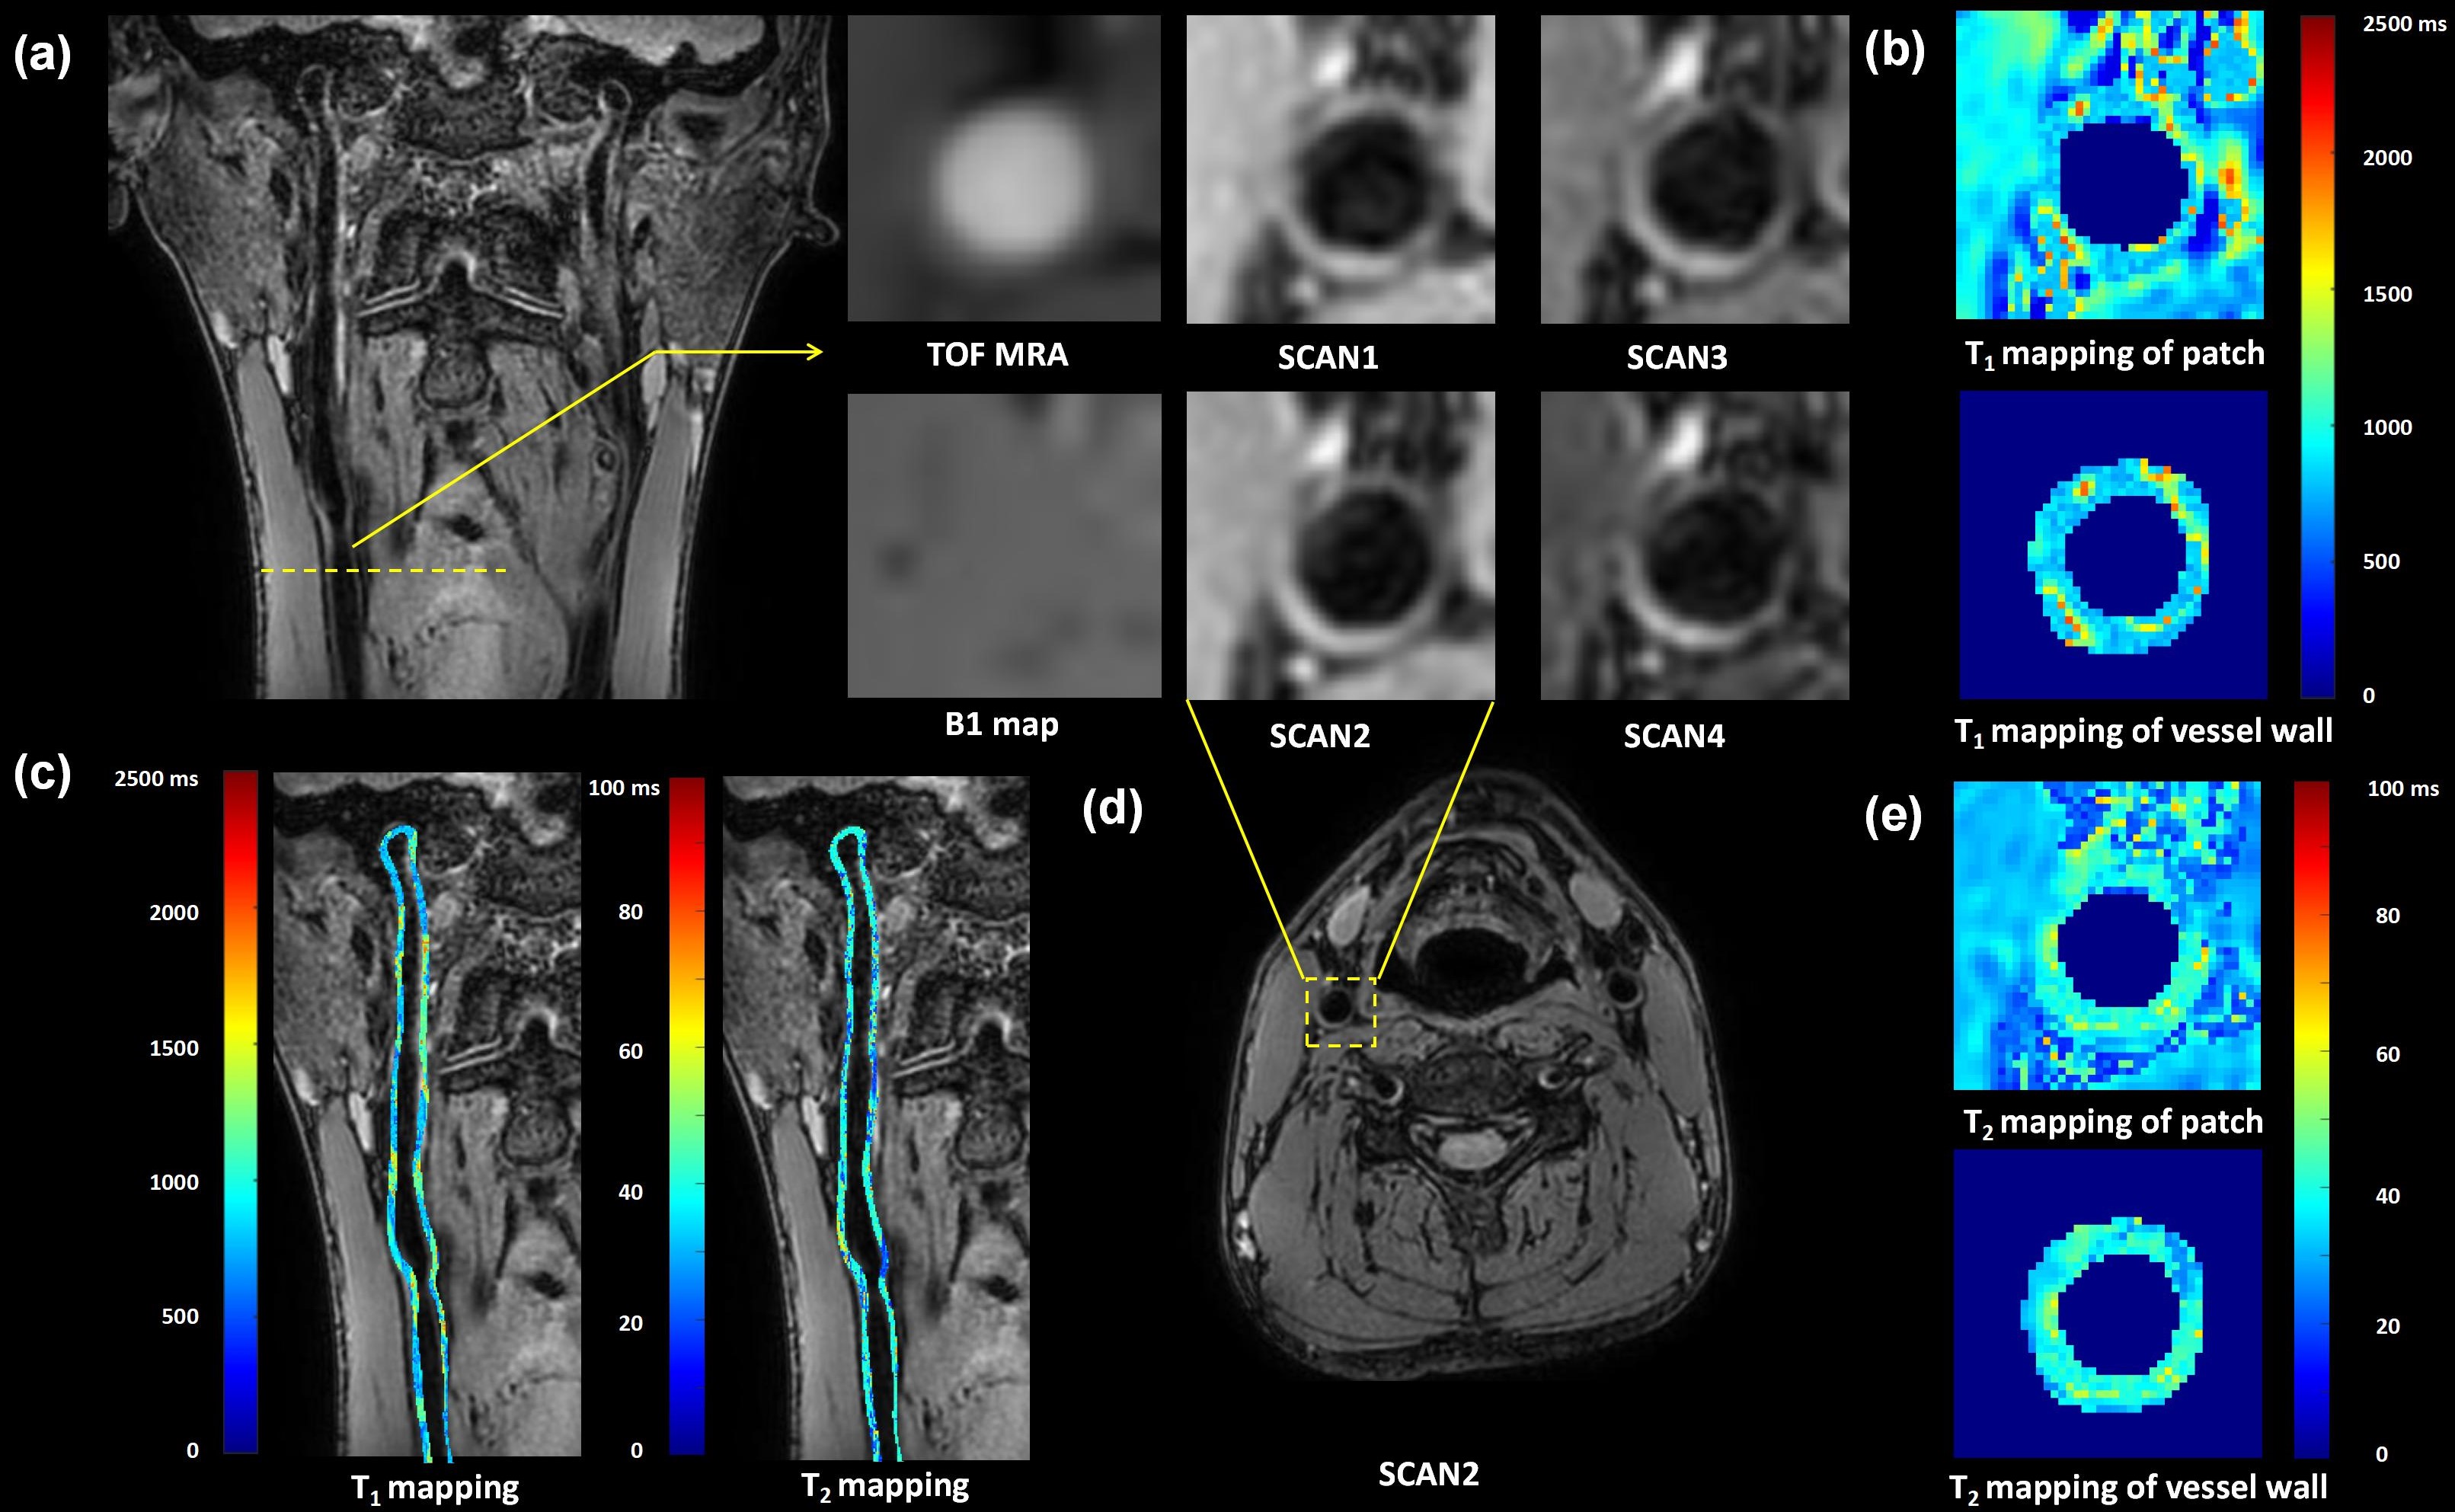
No significant differences were found in T1 (1103.89±50.86 ms vs. 1125.34±50.39 ms, P=0.26) and T2 (31.23±1.50 ms vs. 31.69±1.54 ms, P=0.21) values of cervical muscle between the proposed protocol and clinical referenced quantitative maps. The T1 and T2 values of carotid vessel wall of healthy volunteers were 996.96±33.61 ms and 39.19±1.14 ms, respectively. Large-coverage carotid vessel wall images acquired and analyzed by the proposed solution are shown in Figure 3, demonstrating the feasibility of the imaging protocol and post-processing pipeline.
Discussion and Conclusion
This study proposed a 3D large-coverage carotid atherosclerotic quantitative imaging solution and validated its feasibility in accurately evaluating carotid vessel wall. Compared with global fitting method, the local fitting method achieved by the proposed pipeline largely cut off the calculation time. Future studies to investigate the value of such solution in characterizing carotid atherosclerosis are warranted.Acknowledgements
None.References
1. Cai JM, Hatsukami TS, Ferguson MS, et al.Classification of human carotid atherosclerotic lesions with in vivo multicontrast magnetic resonance imaging. Circulation. 2002;106:1368-1373.
2. Saam T, Hatsukami T S, Takaya N, et al. The Vulnerable, or High-Risk, Atherosclerotic Plaque: Noninvasive MR Imaging for Characterization and Assessment. Radiology, 2007; 244(1):64-77.
3. Chai JT, Biasiolli L, Li L, et al. Quantification of Lipid-Rich Core in Carotid Atherosclerosis Using Magnetic Resonance T2 Mapping: Relation to Clinical Presentation. JACC Cardiovasc Imaging. 2017;10:747-756.
4. Li C, Xu C, Gui C, et al. Level set evolution without re-initialization: A new variational formulation. 2005 IEEE Computer Society Conference on Computer Vision and Pattern Recognition (CVPR'05), 2005.1: 430-436.
5. Klooster R V, Staring M, Klein S, et al. Automated registration of multispectral MR vessel wall images of the carotid artery. Medical Physics, 2013, 40(12).
Figures