1629
Exploration of an optimal ROI measurement for predicting tumor and node stage in rectal adenocarcinoma using 3D CEST-MRI
Yigang Pei1, Xiao Wang1, Wenguang Liu1, Wenzheng Li1, and Weiyin Vivian Liu2
1Xiangya Hospital Central South University, Changsha, China, 2GE heathcare, Beijing, China
1Xiangya Hospital Central South University, Changsha, China, 2GE heathcare, Beijing, China
Synopsis
Keywords: Quantitative Imaging, CEST & MT
Three dimensional chemical exchange saturation transfer (3D-CEST) can provide some quantitative values, such as amide proton transfer weighted-signal intensity (APTw-SI) and magnetization transfer (MT). Different ROI approaches (ss-ROI: single slice ROI; ts-ROI: three-slice ROI; wt-ROI: whole-tumor ROI ) affected the clinic feasibility of APTw-SI and MT in predicting tumor and node (TN) staging. We found MT assisted TN staging of RA patients with a good AUC for all three ROI approaches. Furthermore, MT with ss-ROI is easier to perform in clinical work than ts-ROI and wt-ROI and can be used for clinical diagnosis in the future.Synopsis
Three dimensional chemical exchange saturation transfer (3D-CEST) can provide some quantitative values, such as amide proton transfer weighted-signal intensity (APTw-SI) and magnetization transfer (MT). Different ROI approaches (ss-ROI: single slice ROI; ts-ROI: three-slice ROI; wt-ROI: whole-tumor ROI ) affected the clinic feasibility of APTw-SI and MT in predicting tumor and node (TN) staging. We found MT assisted TN staging of RA patients with a good AUC for all three ROI approaches. Furthermore, MT with ss-ROI is easier to perform in clinical work than ts-ROI and wt-ROI and can be used for clinical diagnosis in the futureIntroduction and Purpose
An accurate preoperative assessment of TN staging is vital to determine therapy strategies for RA patients. However, it is still difficult to precisely assess the TN staging for RA with a high-resolution magnetic resonance imaging possibly due to the limited radiologist’s experience in tumor pathology and morphology. A quantitative MRI parameter, apparent diffusion coefficient (ADC), offers quantitative information about tumor microstructure, but it is challenging to identify benign from malignant lesions due to the large variance. A novel three-dimensional chemical exchange saturation transfer (3D-CEST) sequence directly reflect molecular component in tissues and may predict TN staging via quantitative APTw-SI and MT value. This study aimed to explore the feasibility of 3D-CEST using the three ROI approaches (ss-ROI, ts-ROI and wt-ROI), and further dig out the optimal ROI approach for staging in RA patients in clinics.Methods
This prospective study was approved by our institutional review board-approved. Fifty-eight RA patients (36 males and 22 females, mean age: 60±10 years; age range: 34 - 82 years) confirmed with pathologically TN staging underwent 3D-CEST and DWI on 3.0 T MRI (Discovery MR750W, GE Healthcare, USA) (Fig 1). All 3D-CEST data were automatically post-processed to generate the APT and MT weighted images. APTw-SI, MT and ADC values were measured using three ROI approaches (ss-ROI, ts-ROI, and wt-ROI) on APT, MT and DW images to analyze the TN staging (T staging: T1-2 vs T3-4; N staging: N- vs N+) and extramural vascular invasion (EMVI) status respectively (Fig 2). The diagnostic performance of 3D-CEST imaging and DWI in the determination of TN staging and EMVI status was assessed based on the areas under the curve (AUC) using receiver operating characteristic (ROC) analyses. The optimal ROI strategy was determined by the maximum AUC, or by the easiest approach when they had the similar AUC. Two radiologists independently evaluated TN staging and EMVI status on all high-resolution sagittal, coronal and axial T2WI with a criterion in Fig 3. All patients were divided into T1-2 and T3-4, N- and N+, EMVI- and EMVI+ groups according to the pathological findings (Fig 3).Results
Demographics, clinical and pathological characteristics of 58 patients were shown in Table 1. Totally, this study included 58 patients who were classified into stage T1-2 (n=23) and T3-4 (n=35), N- (n=36) and N+ (n=22), EMVI- (n=38) and EMVI+ (n=10) groups. For assessment of TN staging and EMVI state on T2WI by two readers, the accuracy, sensitivity and specificity of identifying T1-2 from T3-4 staging were 81.0%, 69.6%, 88.6% (reader 1) and 70.7%, 65.2%, 74.3% (reader 2), N- from N+ statue were 70.7%, 88.9% , 40.9% (reader 1) and 62.1%, 52.8%, 77.3% (reader 2), and EMVI- from EMVI+ group were 82.8%, 83.3%, 80.0% (reader 1) and 72.4%, 75.0%, 60.0% (reader 2). For the three ROI approaches, there were no significant differences in APTw-SI and ADC values in differentiating T1-2, N- and EMVI- from T3-4, N+ and EMVI+ groups, respectively (all P > 0.05). But significantly different MT values were observed between T1-2 and T3-4 staging (ss-ROI: 25.12 ± 0.58 vs. 26.40 ± 1.01, P < 0.001; ts-ROI: 25.12 ± 0.56 vs. 26.31 ± 0.94, P < 0.001; wt-ROI: 25.12 ± 0.56 vs. 26.31 ± 0.94, P < 0.001) and between N- and N+ status (ss-ROI: 25.43 ± 0.87 vs. 26.66 ± 0.92, P < 0.001; ts-ROI: 25.42 ± 0.84 vs. 26.53 ± 0.85, P < 0.001; wt-ROI: 25.39 ± 0.72 vs. 26.52 ± 0.85, P < 0.001) except for EMVI status (P > 0.05) (Table 2, Fig 4). For the MT values, the AUCs for distinguishing T1-2 from T3-4 staging using ss-ROI was 0.860 (0.743 - 0.937, P < 0.001) and for assessment of lymph nodes involvement was 0.852 (0.735-0.932, P < 0.001), similar to ts-ROI (T stage: 0.856 [0.739 - 0.934]; N stage: 0.831 [0.710 - 0.917]) and wt-ROI (T stage: 0.833 [0.712 - 0.918]; N stage: 0.848 [0.729 - 0.929]) (Table 3, Fig. 5).Discussion and conclusion
Our study showed that MT values were more useful than APTw-SI as a non-invasive biomarker in evaluating TN stages in RA subjects. Furthermore, MT values obtained with ss-ROI have a good predictive performance in TN staging for RA patients, which is similar to that with ts-ROI and wt-ROI measurements. The reason may be that MT is more easily affected by cystic, necrotic and hemorrhagic components and thus was sensitive to the tumor heterogeneity[1,2]. However, the ss-ROI is easier to implement with comparison of ts-ROI and wt-ROI. Overall, 3D-CEST derived MT value could be a potential approach to perform a preoperative assessment of TN staging for the RA patients in the future.Acknowledgements
N/AReferences
1. Sun Y, Xiao Q, Hu F, et al (2018) Diffusion kurtosis imaging in the characterisation of rectal cancer: utilizing the most repeatable region-of-interest strategy for diffusion parameters on a 3T scanner. Eur Radiol 28:5211–5220.2,
2. Lambregts DMJ, Beets GL, Maas M, et al (2011) Tumour ADC measurements in rectal cancer: effect of ROI methods on ADC values and interobserver variability. Eur Radiol 21:2567–2574.
Figures
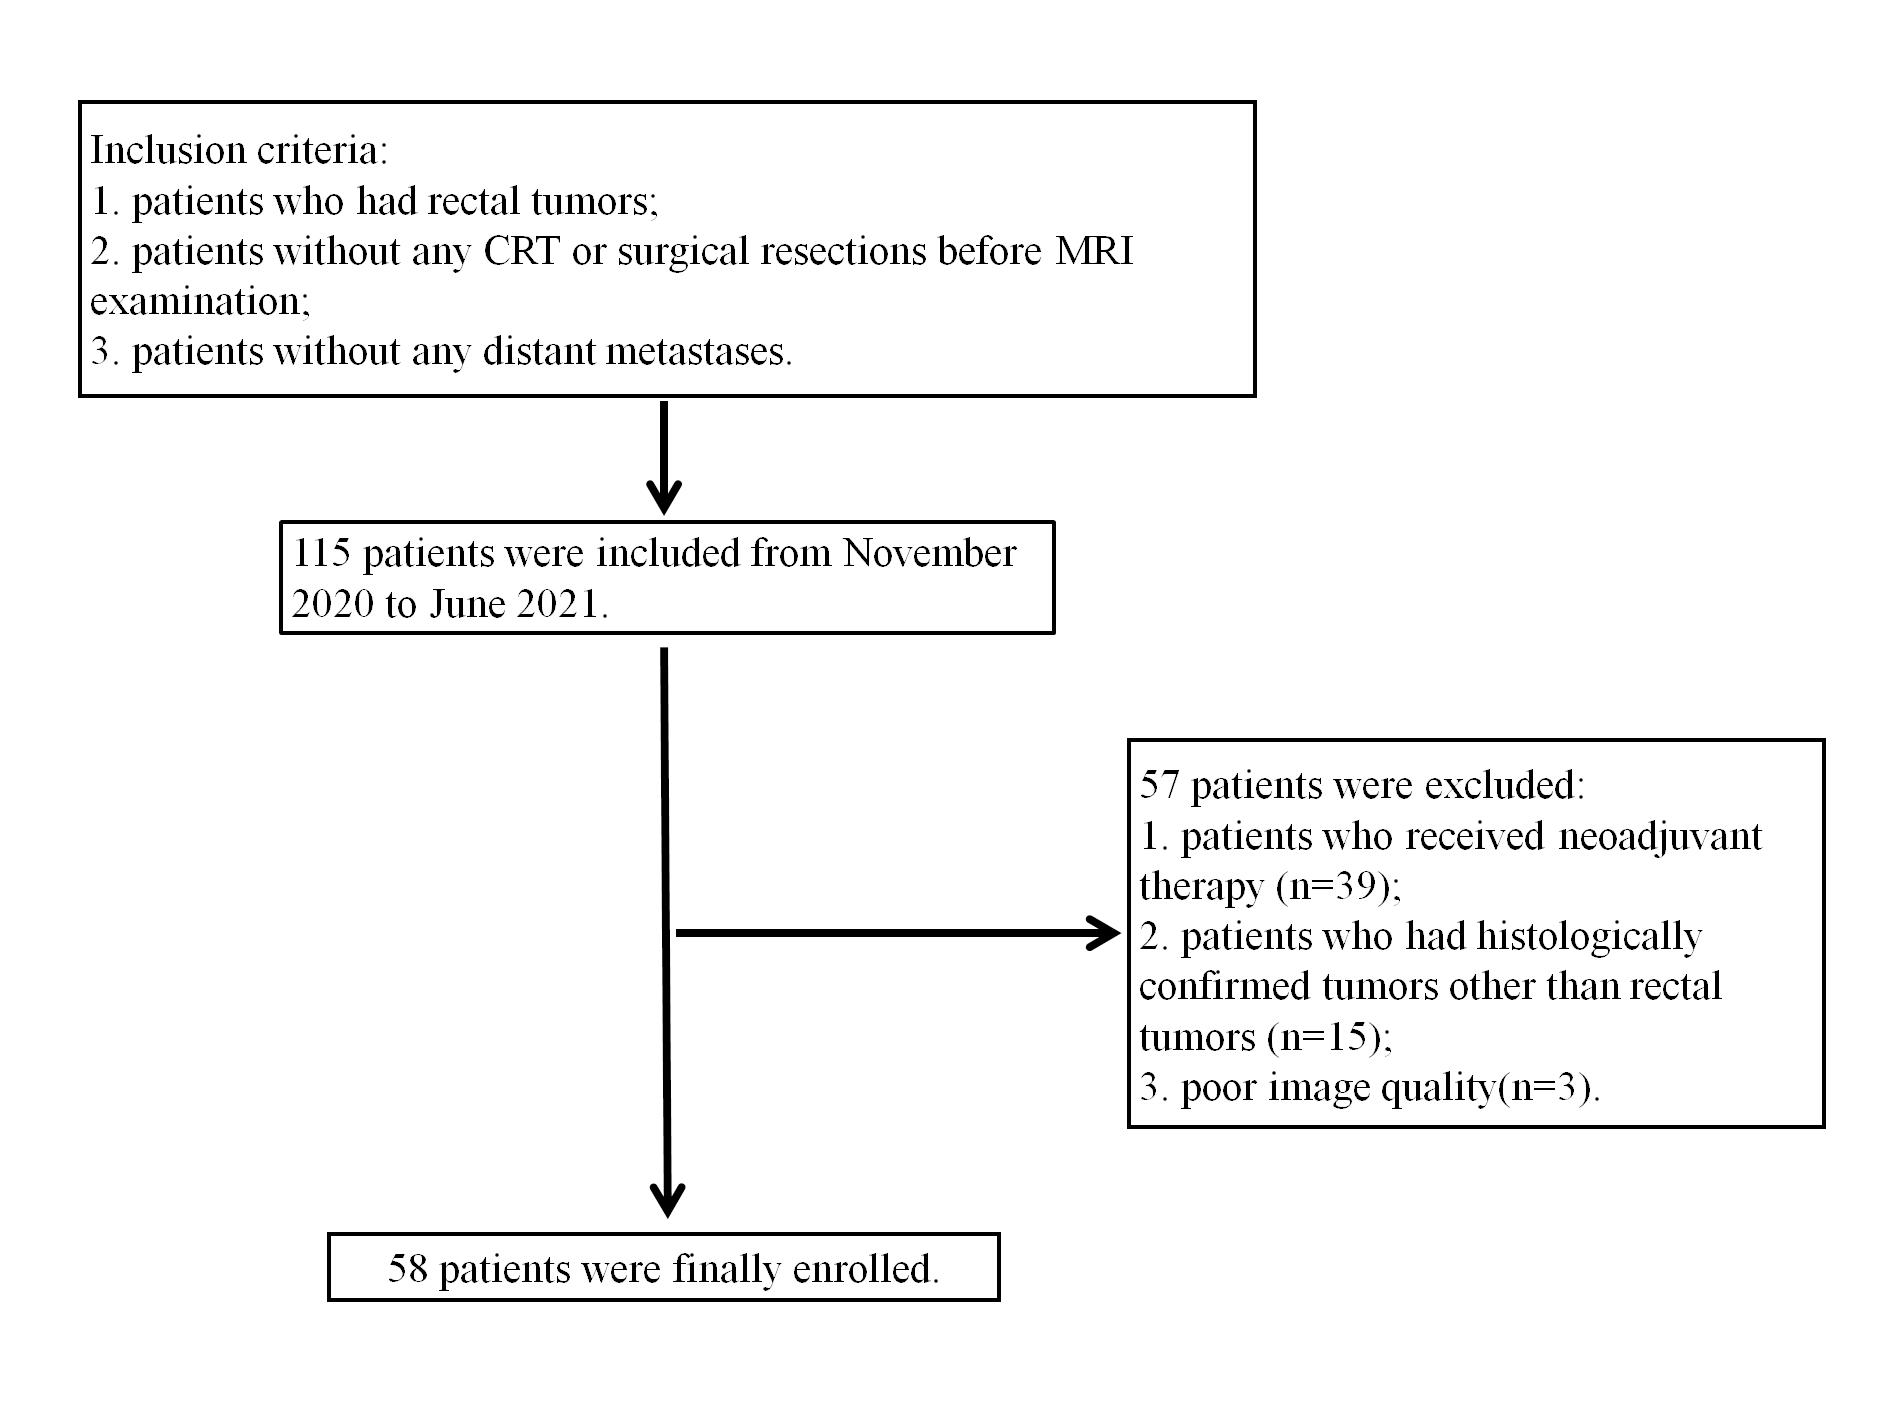
Fig 1. Flowchart of patient selection
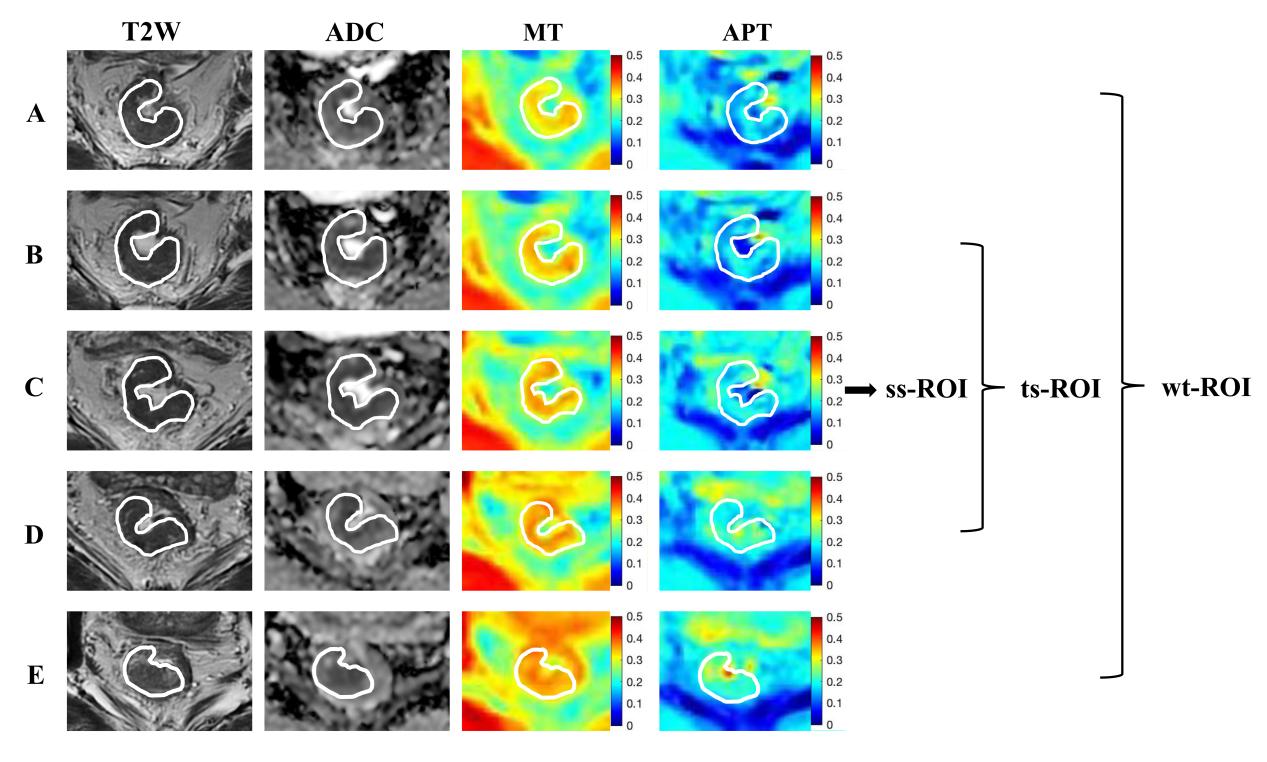
Fig 2. Illustrated three sketched ROIs on a 72-year-old RA patient (T3N0 staging). Figure A-E presents the continuous ROIs drawing the whole tumor on T2WI. C was the ss-ROI, B-D were the ts-ROIs and A-E were the ws-ROIs. Then they were copied to the corresponding ADC, MT and APT maps for obtaining the mean ADC (ADCss, ADCts and ADCwt), MT (MTss, MTts and MTwt) and APTw-SI (APTw-SIss, APTw- -SIts and APTw-SIwt) values respectively.
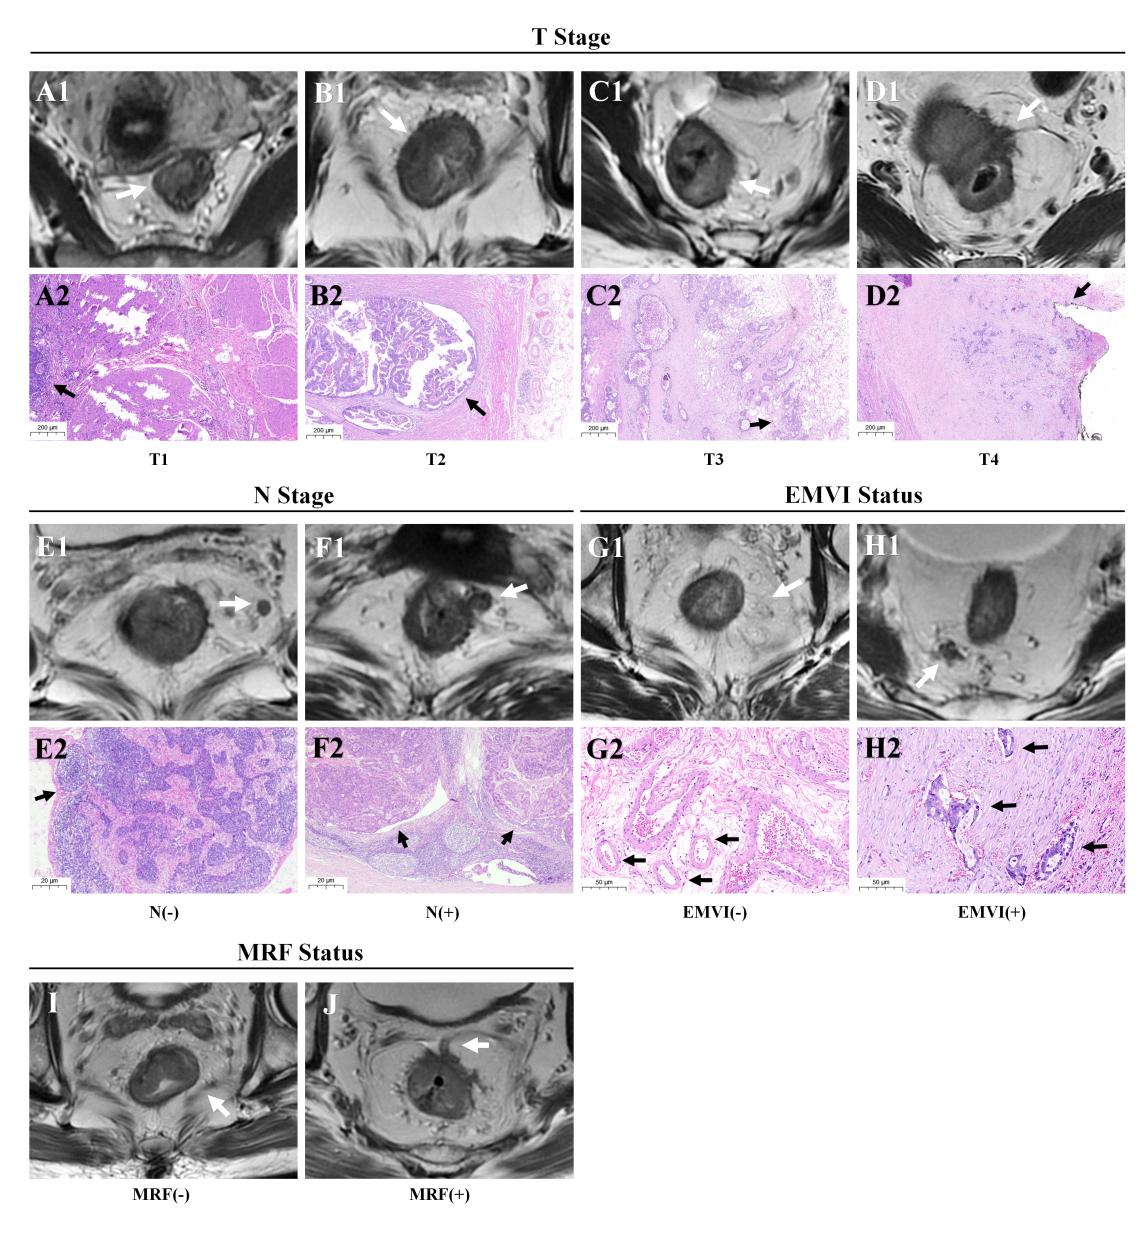
Fig 3.A diagram of assessment criteria for TN staging, EMVI and MRF status with MRI and pathology. T staging, N staging and EMVI statuses of MRI and histopathological examination (H.E staining, ×4.0 for the former two; ×20.0) were shown respectively in Figures A1-D1, A2-D2, Figure E1-F1, E2-F2 and Figure G1-H1, G2-H2.
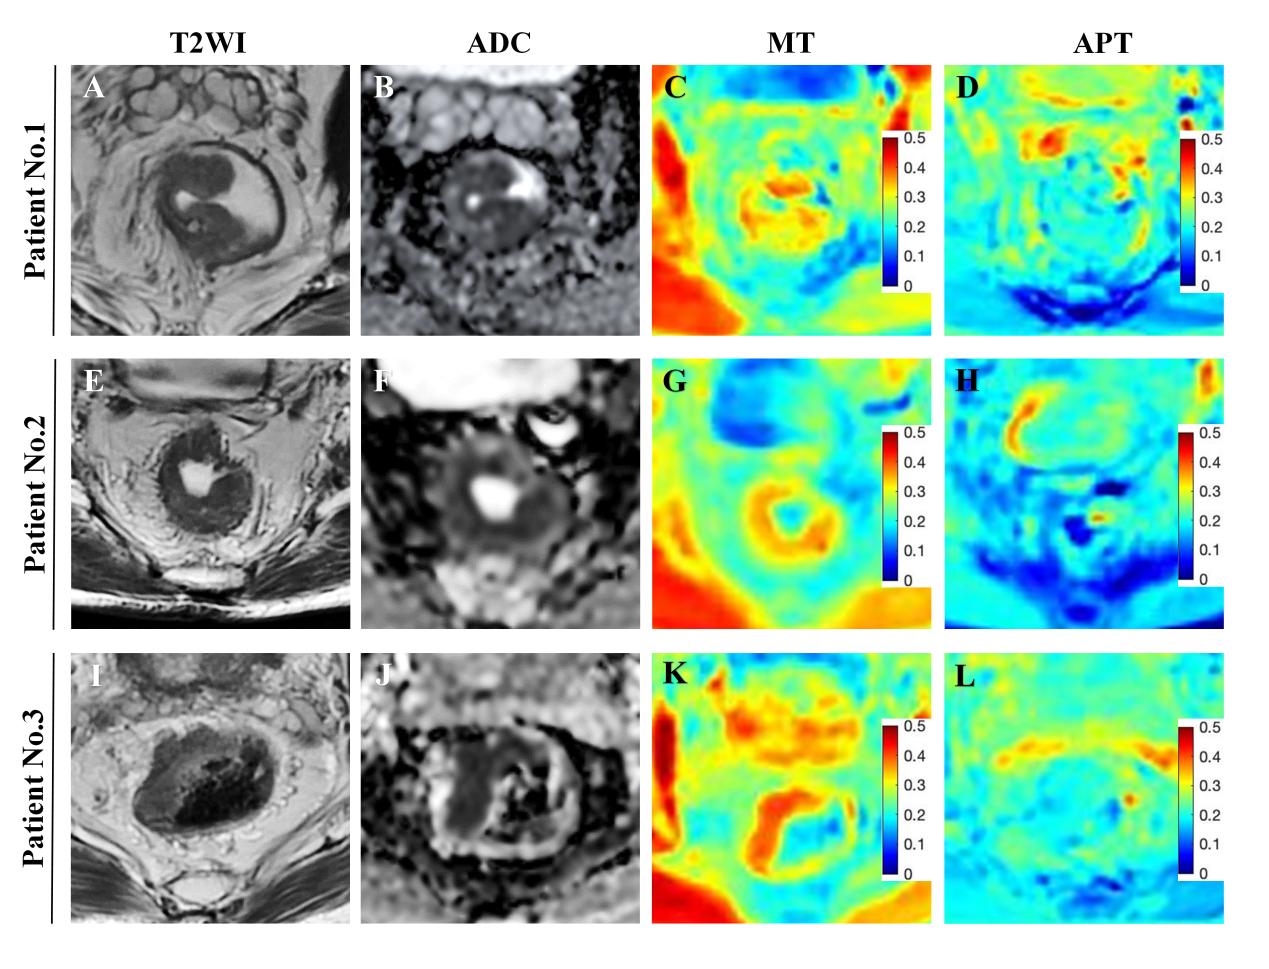
Fig 4. Illustrated images including T2WI, ADC, MT and APT maps of patients with different-stage rectal adenocarcinoma(RA).Figure A-D (case 1): A RA patient with T2N0 staging.. Figure E-H(case 2): A RA patient with T3N0 staging. Figure I-L(case 3): A RA subject with T3N2 staging. there were no significant differences in APTw-SI and ADC in differentiating T1-2 from T3-4, and N- from N+. But significantly different MT values were observed between T1-2 and T3-4 staging beteew case 1 and case 2 (25.26% vs 26.04%), and N- from N+ between case 2 and case 3 (26.04% vs 27.35%).
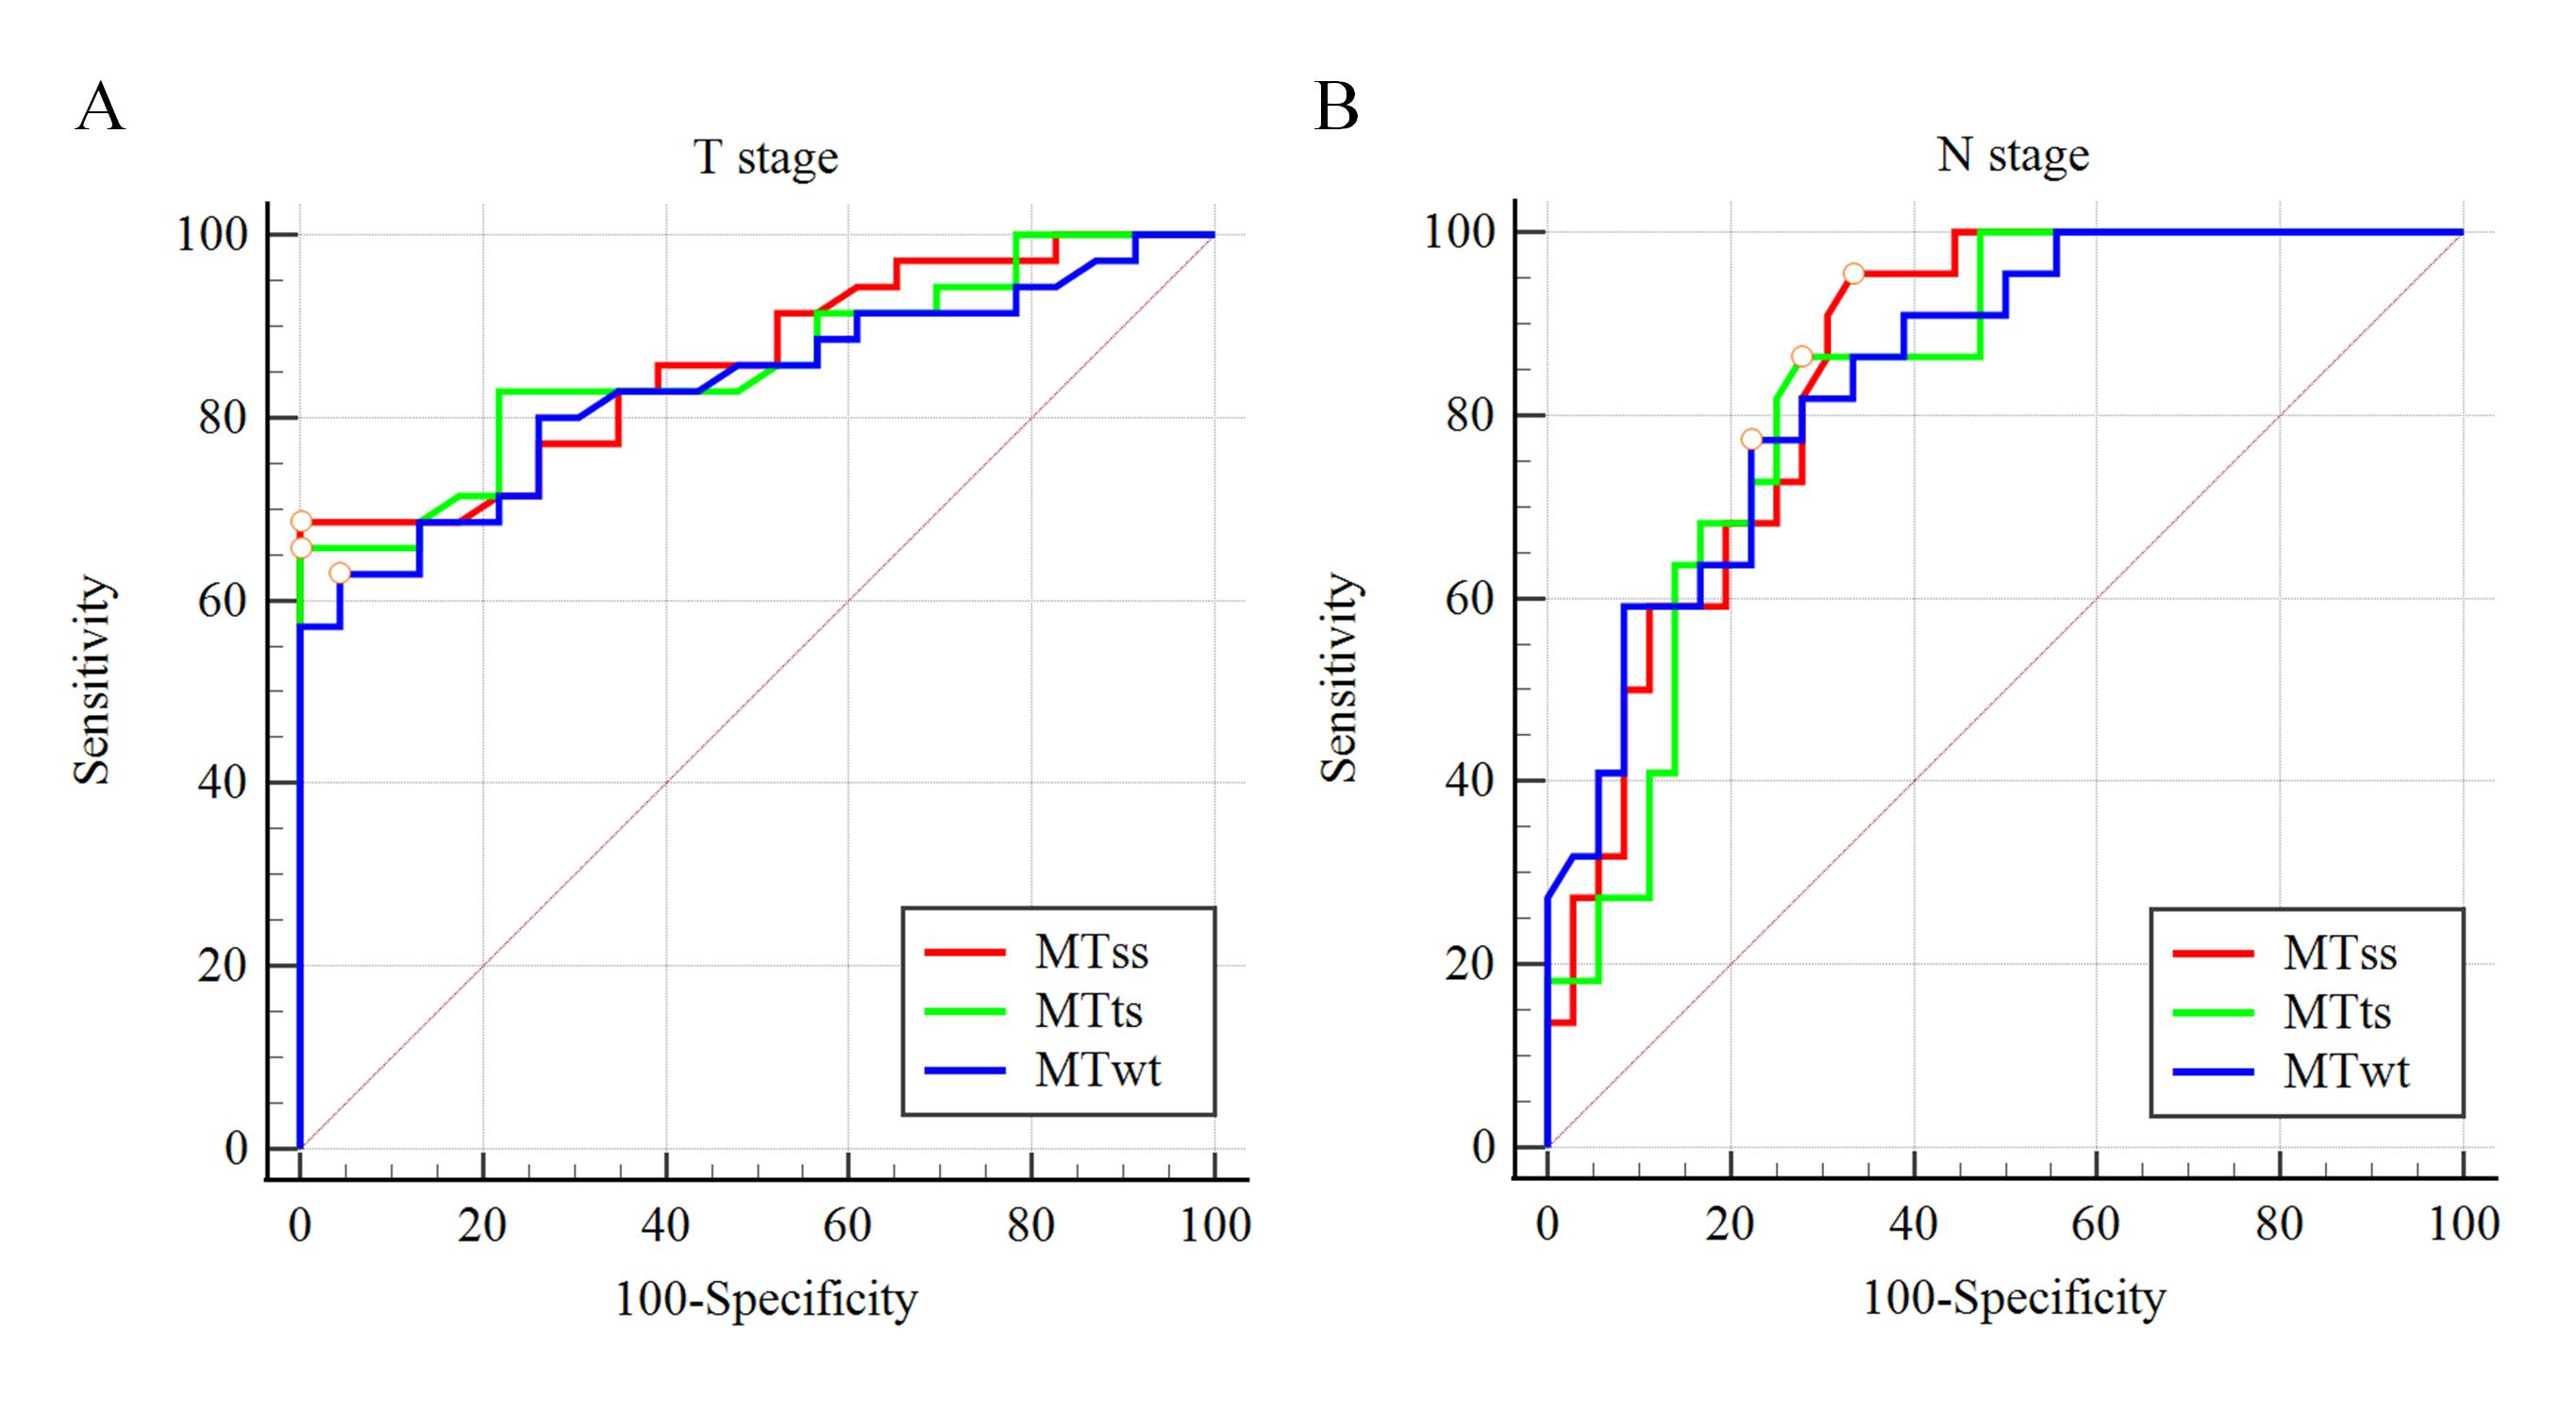
Figure 5. ROC curves of ss-ROI, ts-ROI and wt-ROI measurement for predicting pTN staging. A. T stage (T1-2 vs. T3-4). There were no significant differences between MTss and MTts (p = 0.877), MTss and MTwt (p=0.185), MTtw and MTwt (p=0.210) groups. B. N stage (N- vs. N+): There were also no significant differences between MTss and MTts (p=0.621), MTss and MTwt (p = 0.325), MTtw and MTwt (p = 0.438) cohorts.
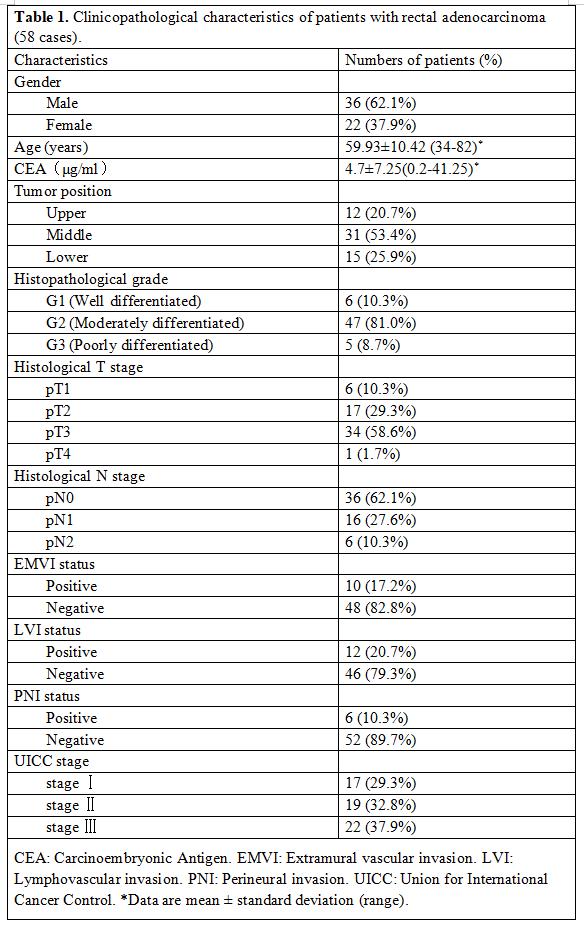
Table 1
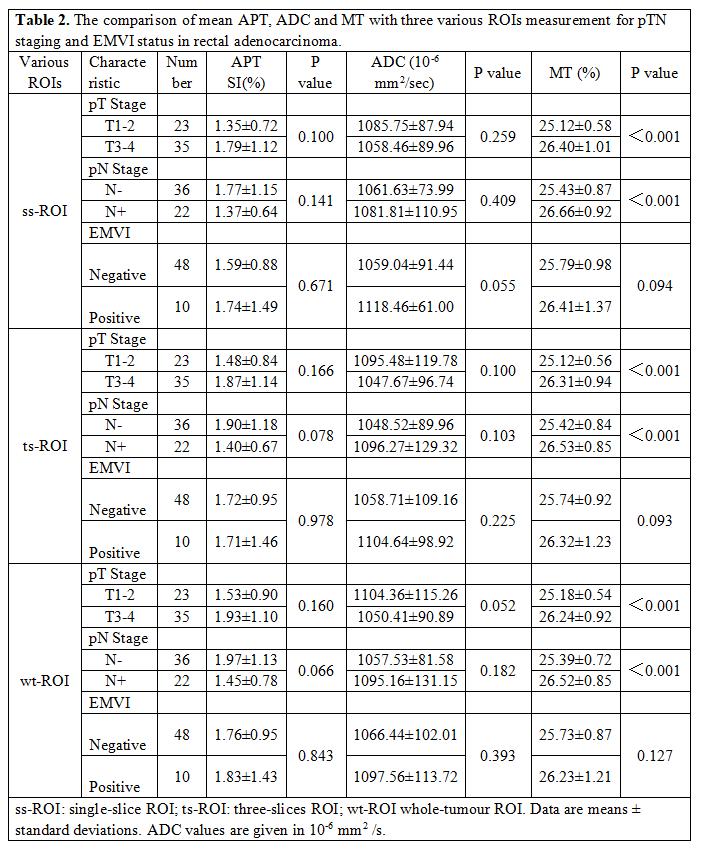
Table 2
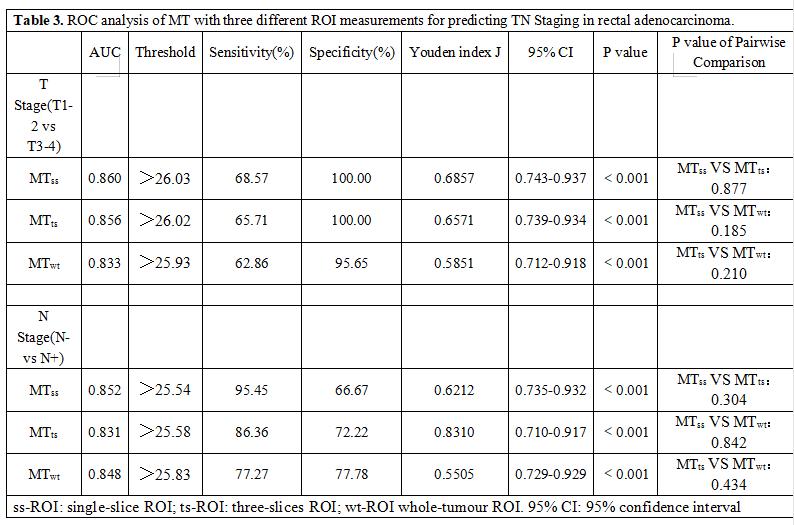
Table 3
DOI: https://doi.org/10.58530/2023/1629