1626
Robust reconstruction of electrical conductivity using anatomically-informed quadratic fit
Flavy Savigny1, Julien Lamy1, and Paulo Loureiro de Sousa1
1ICube, Université de Strasbourg-CNRS, Strasbourg, France
1ICube, Université de Strasbourg-CNRS, Strasbourg, France
Synopsis
Keywords: Quantitative Imaging, Electromagnetic Tissue Properties
Magnetic resonance electrical properties tomography (MREPT), aiming at reconstructing the electrical conductivity and permittivity at radio frequencies. The related reconstruction algorithm relies on the numerical approximation of the Laplacian of the transceiver phase, an operation sensitive to noise. In this work, we evaluate whether 3D parabolic phase fitting combined with anatomical information obtained from T1-weighted and T2-weighted images can be used to improve the reconstruction of conductivity maps of the human brain at 3T.Introduction
Phase-based MREPT is a non-invasive technique to reconstruct tissue electrical properties using the transceiver phase information from a spin-echo or a bSSFP sequence [1,2]. Most of the MREPT studies rely on the homogeneous Helmholtz model, which assumes piecewise constant electrical properties. The related reconstruction algorithm relies on the numerical approximation of the Laplacian of the transceiver phase, an operation sensitive to noise. Spatial derivatives are usually computed by convolving the acquired MR images with finite difference kernels [3]. Replacing the finite difference calculation by parabola-fitting improves the results for complex conductivity distributions [4]. To minimize the impact of noise on the estimation of electrical properties, relatively large kernels in combination with Gaussian apodization are often adopted. Differences conductivity or permittivity between adjacent tissues violate the piecewise-constant assumption and cause artifacts along boundaries when the reconstructed algorithm is applied on inhomogeneous data [2]. One strategy to ensure the homogeneity of a region, even in large kernels, is to use only similar voxels for the parabolic fit [4,5]. Since the electrical conductivity of biological tissues depends mainly on their water content [6], our hypothesis is that similar regions in T1- and T2-weighted images, both sensitive to water content, will also be similar in conductivity. In this work, we evaluate whether 3D parabolic phase fitting combined with anatomical information obtained from T1-weighted and T2-weighted images can be used to improve the reconstruction of human brain conductivity maps at 3T.Methods
In this work, eight phase-cycled 3D bSSFP scans were acquired with respective RF phase increments of 0°, 45°, 90°, 135°, 180°, 225°, 270°, and 315°. Other sequence parameters were TR/TE = 4.8 ms / 2.4 ms, 1.25 mm isotropic voxel size, 540 Hz/px bandwidth and 192x192x132 matrix, non-selective excitation with 30° flip angle. A single bSSFP scan took 100 s. Standard 1 mm isotropic MPRAGE was acquired and registered to bSSFP images. Experiments were performed on a 3T clinical MR system using a quadrature head coil for transmission and reception. The transceiver phase $$$φ^±$$$ was estimated directly from the bSSFP complex data [6]. The local conductivity was then reconstructed from the transmit phase $$$φ^+=\frac{φ^±}{2}$$$ (transceive phase assumption), via the simplified homogeneous Helmholtz equation $$$σ = \frac{∇²φ^+}{μ_0ω_0}$$$, in which σ is the conductivity, $$$μ_0$$$ the magnetic vacuum permeability, and $$$ω_0$$$ the Larmor frequency. Assuming a piecewise-constant conductivity, $$$∇²φ^+$$$ can be estimated by a quadratic least-square fit inside a kernel. First, the conductivity was reconstructed using spherical kernels with four different sizes (diameters of 7, 11, 17, and 23 pixels), to evaluate the effect of the kernel size on the quality of the reconstruction. Then, using the same sizes, we applied an additional intensity criterion, and performed the fit on voxels whose intensity on the T2-weighted image (defined as the F0 mode of the phase-cycled bSSFP [6,7]) matched that of the kernel center. Finally, we applied a similar intensity criterion on both T2-weighted and T1-weighted images. Our intensity criterion is defined as follows: given a reference image, a voxel is considered matching if the difference between its intensity and that of the kernel center is less than 5% of the maximum of the intensity of the image. When using both T1-weighted and T2-weigthed images, a voxel must match both criteria to be included.Results
Figure 1 shows representative slices of the acquired T1-weighted image (MPRAGE), the T2-weighted image (the F0 mode of the phase-cycled bSSFP) and calculated transceiver phase $$$φ^±$$$ estimated directly from bSSFP complex data [6]. As expected, larger kernels without the use of anatomical information reduce the impact of noise on conductivity estimation (figure 2), but lead to a overly strong smoothing of the structures and to significant artifacts along the interfaces. On figure 3 (middle column), we can see that using T2-weighted images to delineate areas of similar properties improves the reconstruction of the conductivity but is not sufficient to distinguish certain structures such as the cortical ribbon. Adding a similarity criterion based also on the T1w image improves the definition of these areas (figure 3, right column). The histogram of the conductivity inside the region defined by the blue box in figure 3 is shown on figure 4. The two peaks on the histogram correspond to conductivity values of 0.499 S/m and 0.883 S/m respectively.Discussion/Conclusion
The combination of parabola-fitting and structural information from T1-weighted and T2-weighted images improves conductivity reconstruction in human brain. The region defined on figure 3 contains both white matter and gray matter, whose conductivities at 20 °C at 128 MHz (Larmor frequency at 3T) are respectively 0.340 S/m and 0.583 S/m [9]. By extrapolating those values by an increase of 2% per degree [9] to the normal human body temperature of 37 °C, we obtain 0.454 S/m for the white matter and 0.788 S/m for the gray matter. Those values match the ones we reported in vivo (0.499 S/m and 0.883 S/m), up to absolute errors of respectively 9% and 10%. A systematic study with more subjects to evaluate reproducibility and robustness of this approach is under way. The next step will be to evaluate whether using parametric images instead of weighted images can improve conductivity mapping.Acknowledgements
No acknowledgement found.References
- Zhang, X., Liu, J., & He, B. (2014). Magnetic-resonance-based electrical properties tomography: a review. IEEE reviews in biomedical engineering, 7, 87-96.
- Katscher, U., & van den Berg, C. A. (2017). Electric properties tomography: Biochemical, physical and technical background, evaluation and clinical applications. NMR in Biomedicine, 30(8), e3729.
- Mandija, S. et al. (2021). Brain tissue conductivity measurements with MR-electrical properties tomography: an in vivo study." Brain topography 34.1 (2021): 56-63.
- Katscher, U. et al. (2012). Estimation of breast tumor conductivity using parabolic phase fitting. In Proceedings of the 20th Annual Meeting of ISMRM (p. 3482).
- Katscher, U., Gagiyev, M., & Meineke, J. (2016). Conductivity determination of deep gray matter nuclei utilizing susceptibility-based delineation. In Proceedings of the 24th Annual Meeting of ISMRM (p. 3336).
- Gabriel, S., Lau, R. W., & Gabriel, C. (1996). The dielectric properties of biological tissues: II. Measurements in the frequency range 10 Hz to 20 GHz. Physics in medicine & biology, 41(11), 2251.
- Iyyakkunnel, S., Schäper, J., & Bieri, O. (2021). Configuration‐based electrical properties tomography. Magnetic Resonance in Medicine, 85(4), 1855-1864.
- Zur, Y., Wood, M. L., & Neuringer, L. J. (1990). Motion‐insensitive, steady‐state free precession imaging. Magnetic resonance in medicine, 16(3), 444-459.
- Gabriel, C.. Compilation of the Dielectric Properties of Body Tissues at RF and Microwave Frequencies, Report N.AL/OE-TR- 1996-0037, Occupational and environmental health directorate, Radiofrequency Radiation Division, Brooks Air Force Base, Texas (USA), 1996.
Figures
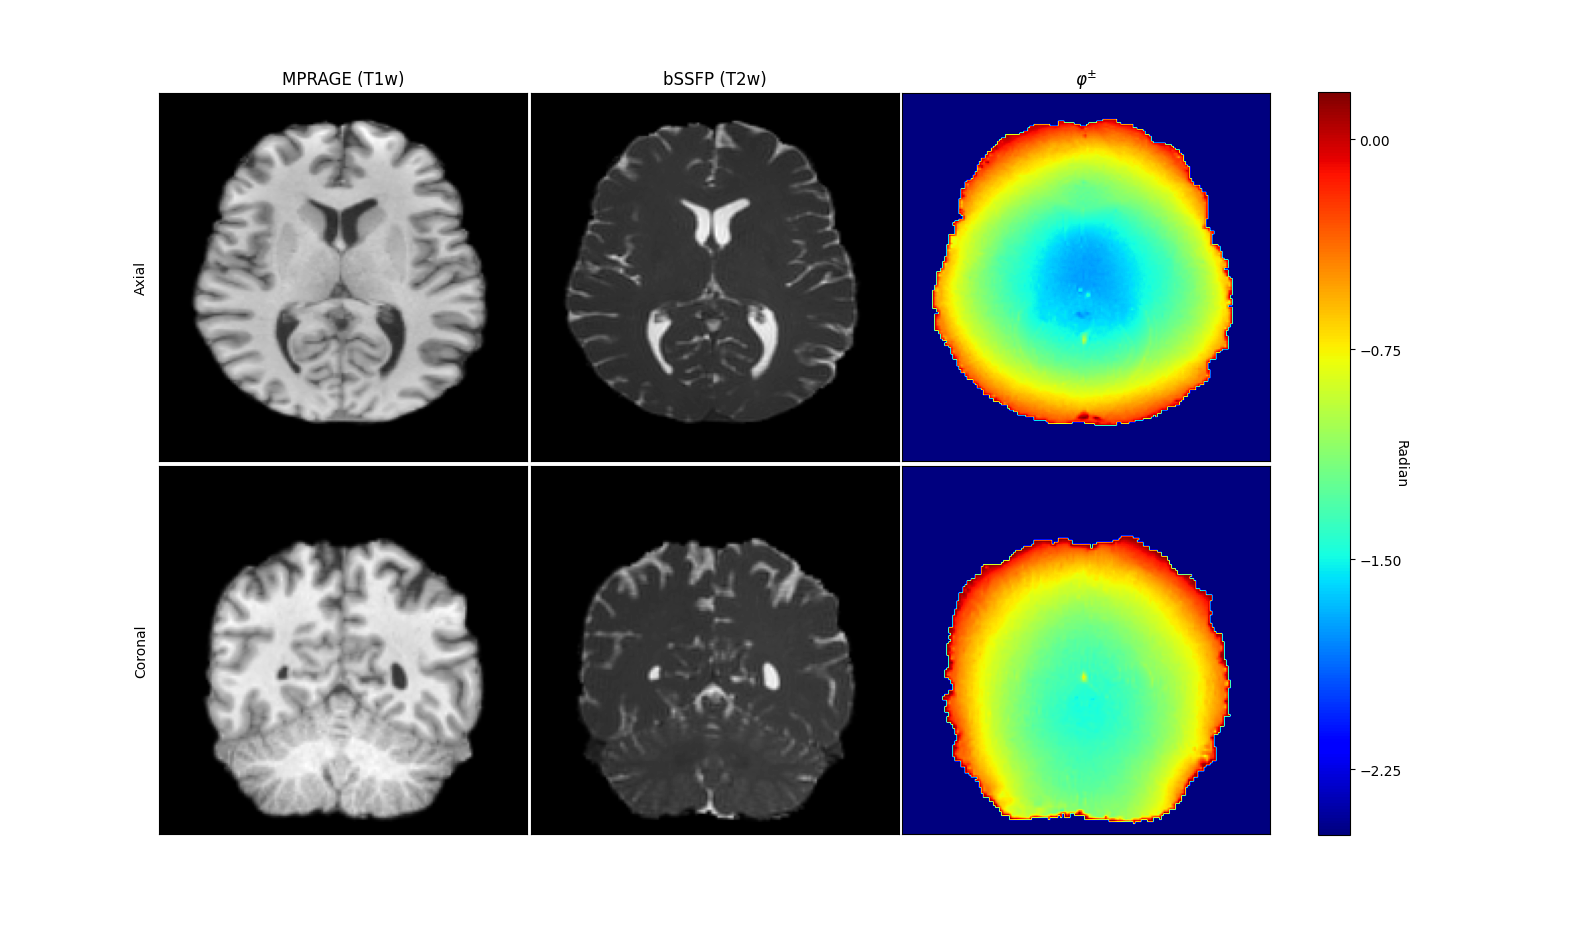
Axial and coronal slice of the MPRAGE mostly weighted on T1, the mode0 of the bSSFP (mostly weighted T2), and the transceive phase.
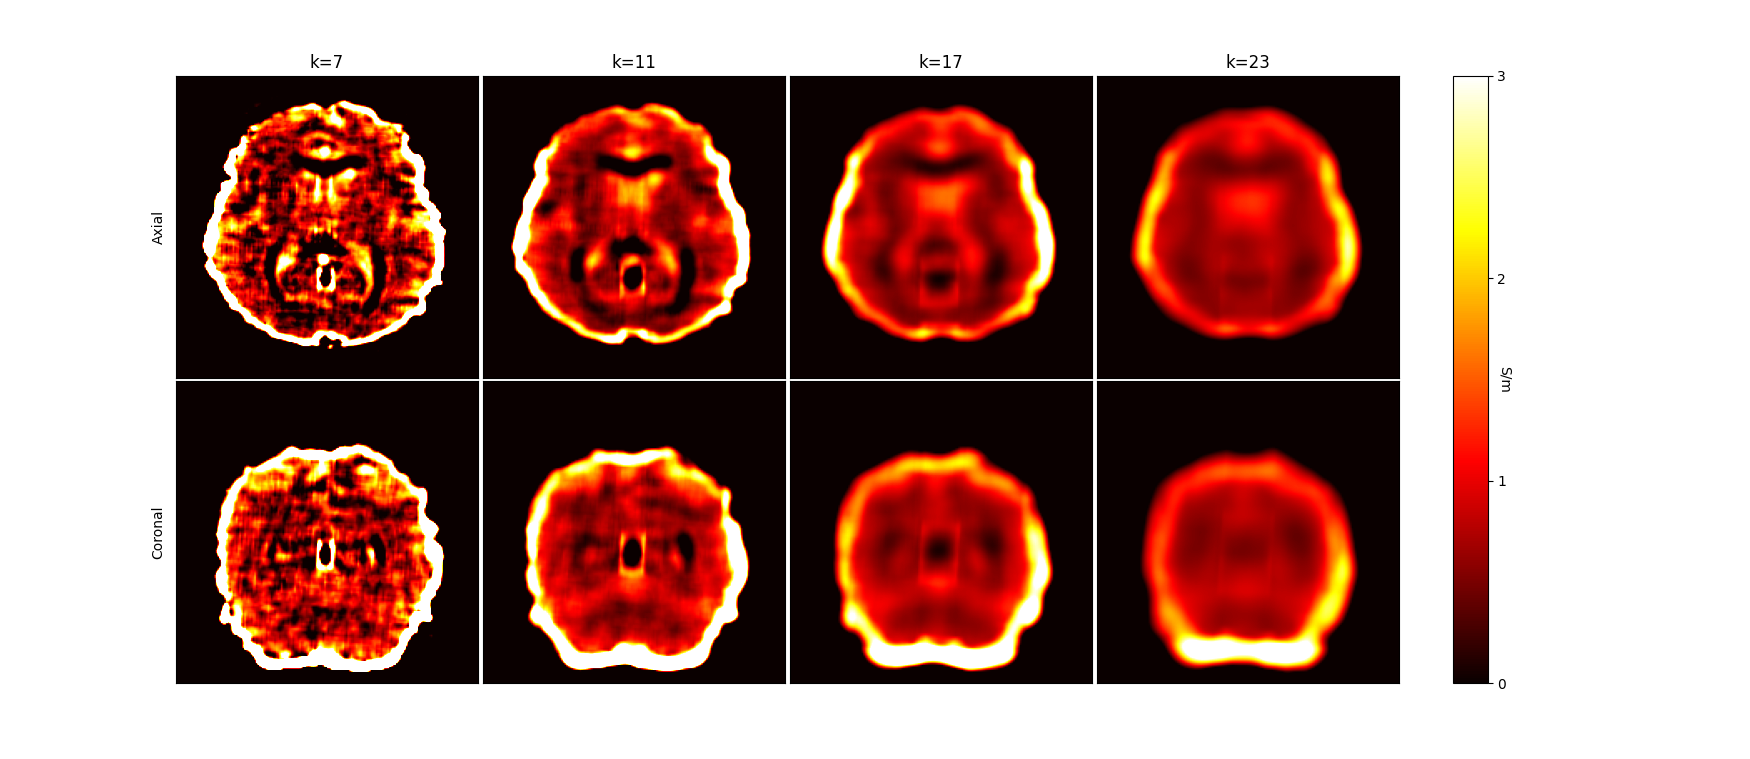
Influence of the kernel size on the reconstruction of the conductivity map. Bigger kernel size mean less noise but will occur more blur.
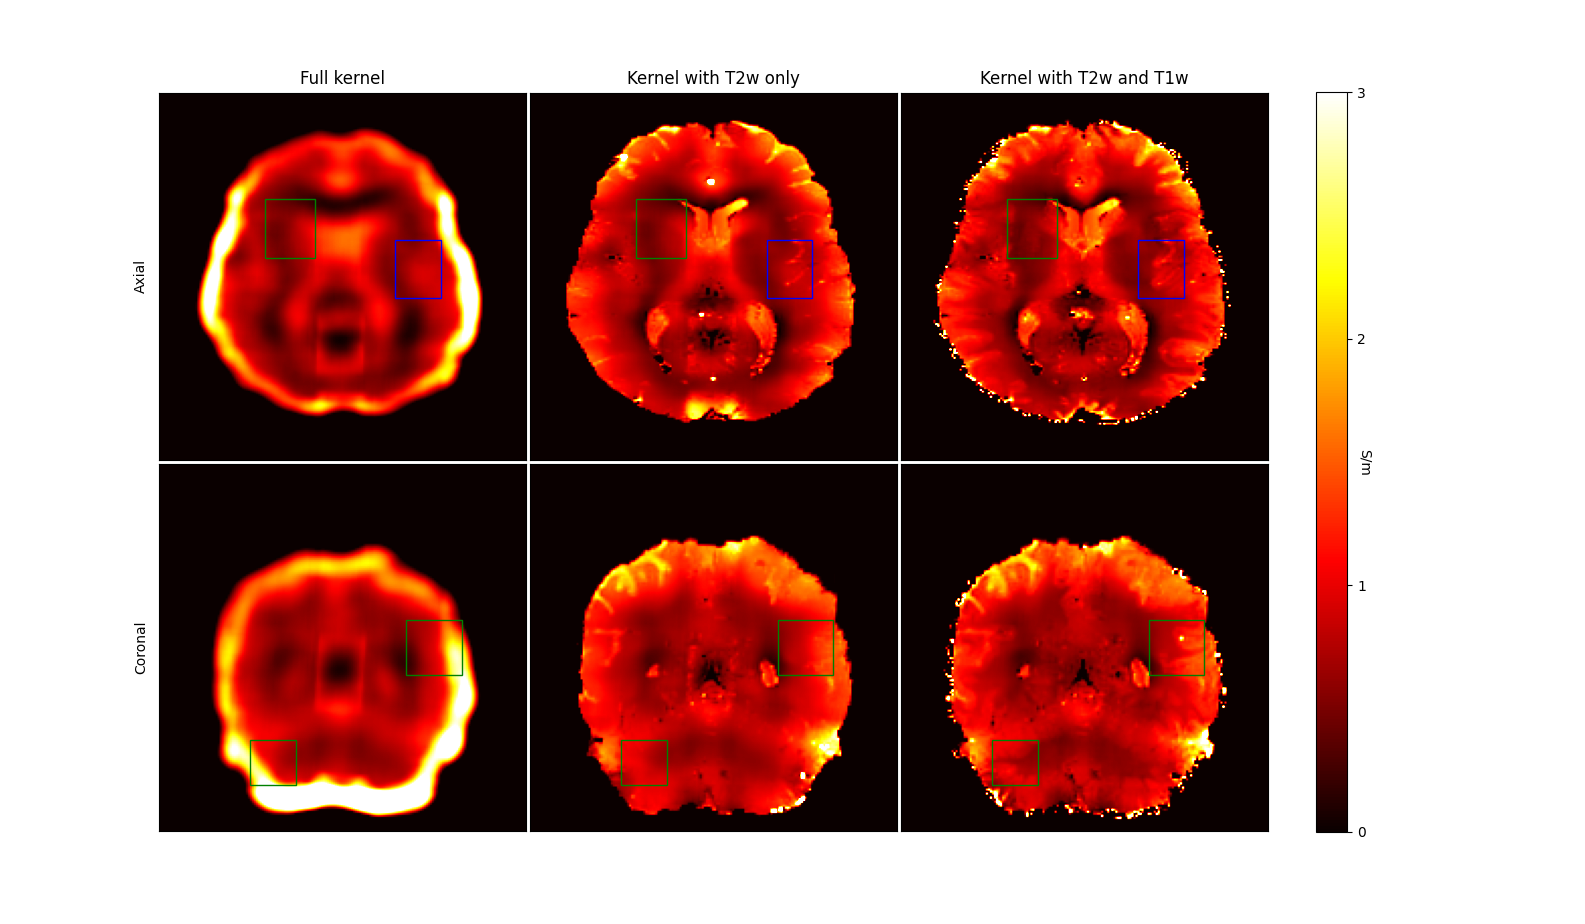
Conductivity map calculated using differents methods. The kernel size is constant (17 pixels diameter). Left image is with just the kernel, central image is conductivity map with the kernel segmented by T2w image, and the right image is the conductivity map with the kernel segmented by both the T2w and T1w images.
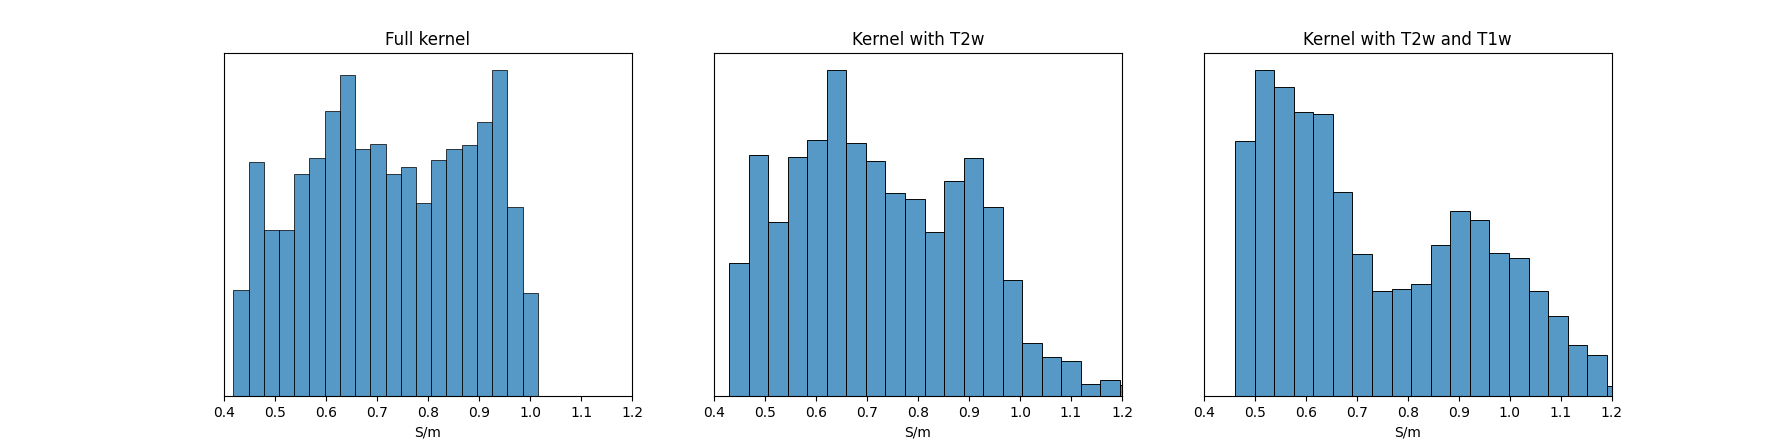
Histogram of the blue ROI of the figure 3. Left histogram correspond to
the full kernel, te center one to the kernel with T2w only, and the last
one with T2w and T1w.
DOI: https://doi.org/10.58530/2023/1626