1623
In vivo T1 and T2* relaxation times of fast relaxing tissues of the healthy knee
Maik Rothe1, Selina Riedel1, Andreas Deistung1, Brill Richard1, Walter Alexander Wohlgemuth1, and Alexander Gussew1
1University Clinic and Outpatient Clinic for Radiology, University Hospital Halle (Saale), Halle (Saale), Germany
1University Clinic and Outpatient Clinic for Radiology, University Hospital Halle (Saale), Halle (Saale), Germany
Synopsis
Keywords: Quantitative Imaging, Relaxometry
In this study, we used a method for fast in vivo T1 and T2* mapping of fast relaxing tissues of the knee using a high resolution 3D spoiled gradient ultrashort echo time research application sequence with spiral read out to quantitatively describe different tissues. We manually segmented 10 different tissues in five healthy young volunteers and found good agreement with literature values for fast relaxing tissues. The bivariate histograms showed tissue specific clusters, which can be used for tissue differentiation. Additional information, such as phase images, could further improve bivariate histogram-based tissue differentiation and should be explored in future studies.Introduction:
The imaging of fast relaxing tissues like tendons or ligaments is challenging due to their fast T2* relaxation and the required minimal echo time. Ultra-short echo-time (UTE) techniques enable quantitative imaging of such tissues with mapping of relaxation parameters1. A previously shown method2 allows T1 and T2* mapping of these tissues of the knee with submillimeter resolution in less than 9 minutes. To transfer quantitative UTE imaging into clinical decision-making and to utilize it for knee tissue segmentation normative values are essential. However, there are still hardly any reliable quantitative values in these tissues. Therefore, we investigated T1 and T2* in different knee tissues to assess their specific ranges and clusters in bivariate histograms, and to validate the proposed 9 minute UTE imaging protocol.Methods:
Five female volunteers (24.6 ± 5.1 years) with no history of knee injury were examined on a 3T MR-scanner (MAGNETOM Vida, Siemens Healthcare, Erlangen, Germany) using an 18-channel transmit/receive knee coil. For fast T1 and T2* mapping, two measurements with an isotropic spatial resolution of 0.8 mm were conducted using a 3D spoiled gradient echo UTE research application sequence with stack of spirals readout3,4. The acquisition and processing scheme is summarized in Figure 1. The T2* map was calculated based on two in-phase echoes (0.03/4.92 ms) obtained in measurement 1. For T1-mapping, a T1 look-up-table (LUT) was computed to allocate the ratio of two gradient echo signals (S1/S3) with identical TEs by using discrete 1 ms T1 steps ranging from 1-2500 ms. The T1 map was calculated by applying the LUT to the ratio of the first echo (0.03 ms) of measurement 1 (S1, TR1: 9.92 ms; FA1: 16°) and measurement 2 (S3, TR2: 4.45 ms; FA2: 3°). T1 maps were corrected for B1+-fields by considering the additionally acquired flip angle distributions. Anterior cruciate ligament (ACL), posterior cruciate ligament (PCL), quadriceps tendon, patella tendon, bone skin, cartilage, bone marrow, Hoffa´s fat pad, subcutaneous adipose tissue and skeletal muscle were manually segmented (3D Slicer, https://www.slicer.org5) on the UTE subtraction images (measurement 1, S1-S2) and in additionally acquired 3D turbo spin echo (SPACE) images (TR/TE: 900/49 ms, FA: 120°, isotropic voxel size: 0.8 mm). SPACE images were used for all tissues with longer T2* relaxation times, which were not visible in the subtraction image. Tissue labels were applied to relaxation maps to assess the tissue specific T1 and T2* distributions. Tissue specific bivariate histograms were generated by using the T1 and T2* values of all volunteers.Results:
Figure 2 shows representative labels of segmented tissues. Table 1 summarizes the T1 and T2* relaxation times of the different tissues together with corresponding literature values6–14. The T1 relaxation times of almost all tissues were in a comparable range to the literature values. The patella tendon and the cartilage were slightly underdetermined. The T2* relaxation times of the fast relaxing tissues are in the order of magnitude of the literature values. The ACL shows an almost doubled T2* time compared to the other tendons. Tissue specific T1-T2*-clusters are shown in Figure 3. Overall, the bivariate histograms show tissue specific clustering for the different tissue types, whereas cartilage shows a broad and a narrow cluster.Discussion and conclusion:
The proposed UTE-based T1 and T2* mapping technique allows quantification of fast relaxing tissues with submillimeter spatial resolution in a clinically appropriate acquisition time of 9 minutes. The acquired relaxation times of the selected tissue types were comparable to literature values but several differences are still noticeable. For T2* relaxation times greater than 20 ms (e.g. in skeletal muscle), the signal difference between the used echo times of 0.03 ms and 4.92 ms is too small to obtain reliable results, yielding values lower than the ones reported in literature. The doubled T2* value of the ACL with respect to the other tendons could be the result of the angulation (up to 45°) of the ACL to the static magnetic field. Compared to the T1 relaxation time, the T2* relaxation time depends much more on the orientation of a structured tissue to the static magnetic field15. The quadriceps and patella tendon show two-times higher T2* compared to the literature, which could be a result of the selected echo times for T2* mapping. The reference value was calculated with a three-point fit utilizing TE=0.1/2.48/4.9 ms. We used only two-points (TE=0.03/4.92 ms) for T2* mapping, whereas after 4.92 ms most of the signal was decayed in these tendons, which may lead to increased T2* values. With respect to its bivariate histogram, the cartilage forms two T1-T2*-clusters that could be ascribed to a superficial and a deep cartilage layer, which are known to differ in relaxation times11. Even though different tissues show areas of overlap in the bivariate histogram, tissue differentiation appears to be possible based on the histograms. Additional information, such as phase images, could further improve bivariate histogram-based tissue differentiation and should be explored in future studies. Overall the proposed 9 minute 3D UTE method reveals valid T1 values for all tissues; more accurate T2* values can be achieved by including an additional echo at 2.46 ms and performing three-point fitting.Acknowledgements
The authors thank Siemens Healthcare for providing the 3D spiral UTE research application sequence, Thomas Benkert (MR Application Predevelopment, Siemens Healthcare GmbH, Erlangen, Germany) for technical support and Klaus Bohndorf for valuable discussions on anatomical segmentation.References
1. Wehrli FW. Magnetic resonance of calcified tissues. J Magn Reson. 2013;229:35-48. doi:10.1016/j.jmr.2012.12.0112. Rothe M, Deistung A, Brill R, Wohlgemuth WA, Gussew A. Validation of fast in vivo T1 and T2* mapping of tissues in the knee using 3D UTE. In: Joint Annual Meeting ISMRM-ESMRMB. ; 2022:1342.
3. Qian Y, Boada FE. Acquisition-weighted stack of spirals for fast high-resolution three-dimensional ultra-short echo time MR imaging. Magn Reson Med. 2008;60(1):135-145. doi:10.1002/mrm.21620
4. Mugler JI, Fielden SWMCH, A. AT, et al. Breath-hold UTE Lung Imaging using a Stack-of-Spirals Acquisition. In: 23rd Annual Meeting ISMRM. ; 2015:1476.
5. Fedorov A, Beichel R, Kalpathy-Cramer J, et al. 3D Slicer as an Image Computing Platform for the Quantitative Imaging Network. Magn Reson Imaging. 2012;30(9):1323-1341. doi:doi:10.1016/j.mri.2012.05.001
6. Ma YJ, Zhao W, Wan L, et al. Whole knee joint T1 values measured in vivo at 3T by combined 3D ultrashort echo time cones actual flip angle and variable flip angle methods. Magn Reson Med. 2019;81(3):1634-1644. doi:10.1002/mrm.27510
7. Warth RJ, Zandiyeh P, Rao M, et al. Quantitative Assessment of In Vivo Human Anterior Cruciate Ligament Autograft Remodeling: A 3-Dimensional UTE-T2* Imaging Study. Am J Sports Med. 2020;48(12):2939-2947. doi:10.1177/0363546520949855
8. Krämer M, Maggioni MB, Brisson NM, et al. T1 and T2* mapping of the human quadriceps and patellar tendons using ultra-short echo-time (UTE) imaging and bivariate relaxation parameter-based volumetric visualization. Magn Reson Imaging. 2019;63(July):29-36. doi:10.1016/j.mri.2019.07.015
9. Jordan CD, Saranathan M, Bangerter NK, Hargreaves BA, Gold GE. Musculoskeletal MRI at 3.0 T and 7.0 T: A comparison of relaxation times and image contrast. Eur J Radiol. 2013;82(5):734-739. doi:10.1016/j.ejrad.2011.09.021
10. Gold GE, Han E, Stainsby J, Wright G, Brittain J, Beaulieu C. Musculoskeletal MRI at 3.0 T: Relaxation times and image contrast. Am J Roentgenol. 2004;183(2):343-351. doi:10.2214/ajr.183.2.1830343
11. Behzadi C, Welsch GH, Laqmani A, et al. Comparison of T2* relaxation times of articular cartilage of the knee in elite professional football players and age-and BMI-matched amateur athletes. Eur J Radiol. 2017;86:105-111. doi:10.1016/j.ejrad.2016.10.028
12. Maggioni MB, Krämer M, Reichenbach JR. Optimized gradient spoiling of UTE VFA-AFI sequences for robust T1 estimation with B1-field correction. Magn Reson Imaging. 2021;82(June):1-8. doi:10.1016/j.mri.2021.06.011
13. Zuo CS, Sung YH, Simonson DC, et al. Reduced T2* Values in Soleus Muscle of Patients with Type 2 Diabetes Mellitus. PLoS One. 2012;7(11):7-12. doi:10.1371/journal.pone.0049337
14. Okuda M, Kobayashi S, Toyooka K, et al. Quantitative differentiation of tendon and ligament using magnetic resonance imaging ultrashort echo time T2* mapping of normal knee joint. Acta radiol. Published online 2021. doi:10.1177/02841851211043834
15. Hänninen N, Rautiainen J, Rieppo L, Saarakkala S, Nissi MJ. Orientation anisotropy of quantitative MRI relaxation parameters in ordered tissue. Sci Rep. 2017;7(1):1-11. doi:10.1038/s41598-017-10053-2
Figures
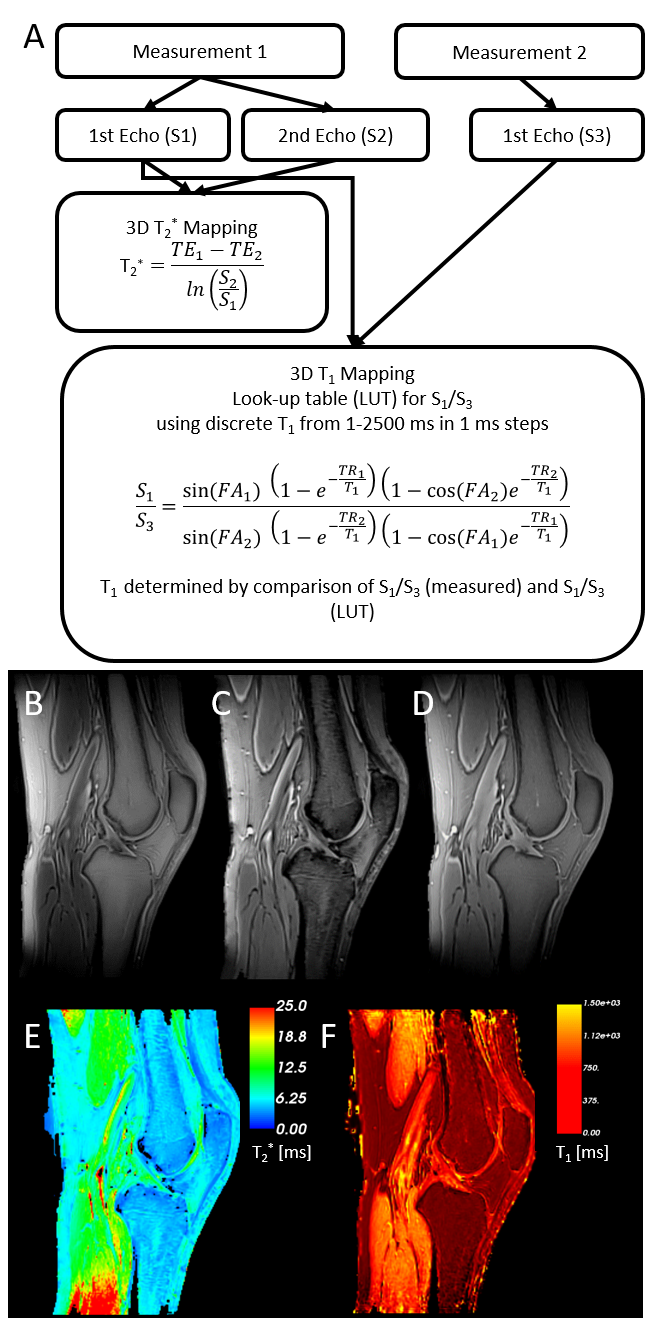
Figure 1: Workflow to calculate T2* and T1 maps (A). Acquired images of the two different UTE scans showing the knee in sagittal view (B-D). Measurement 1 signal 1: TE=0.04 ms, TR=9.92 ms, FA=16° (B), measurement 1 signal 2: TE=4.92 ms, TR=9.92 ms, FA=16° (C), measurement 2 signal 3: TE=0.04 ms, TR=4.45 ms, FA=3° (D). The lower row shows the corresponding T2* (calculated based on (B) and (C)) and B1+-corrected T1 maps (calculated based on (B) and (D)) map in (E) and (F), respectively.
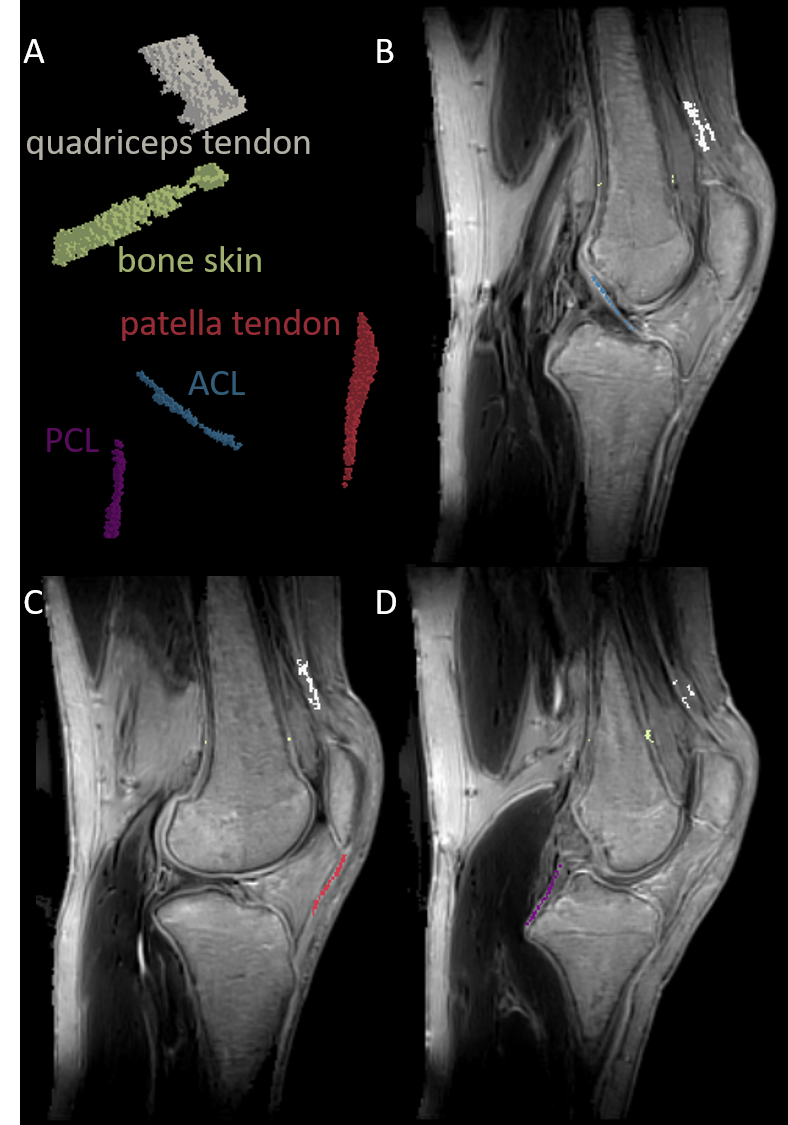
Figure 2: 3D visualization of manually selected segments for the quadriceps tendon, the bone skin, the patella tendon, the anterior cruciate ligament (ACL) and the posterior cruciate ligament (PCL) (A). These segments are shown as overlay on UTE subtraction images (measurement 1, echo 1 - echo 2) in B-D. ACL is visible in B, PCL in D and patella tendon in C; bone skin and quadriceps tendon are visible in B-D.
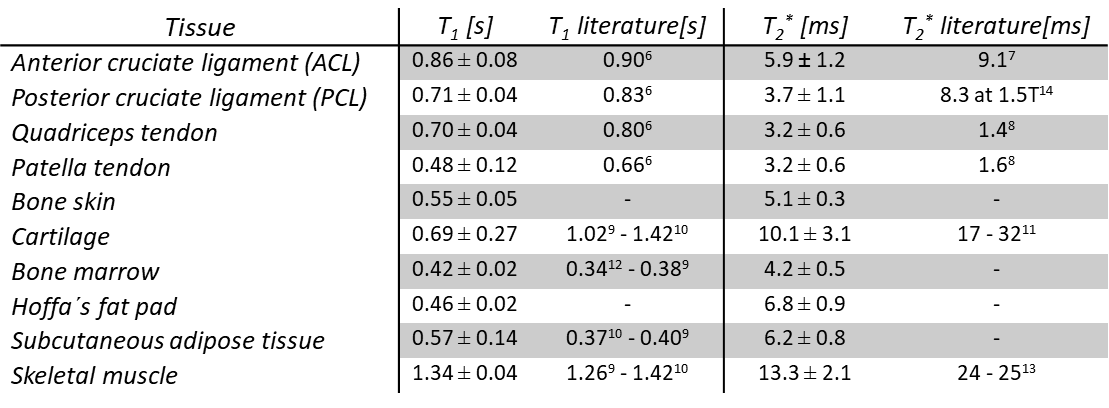
Table 1: T1 and T2* values as mean ± standard deviation of different tissues of the knee from five female healthy young volunteers and associated literature values.
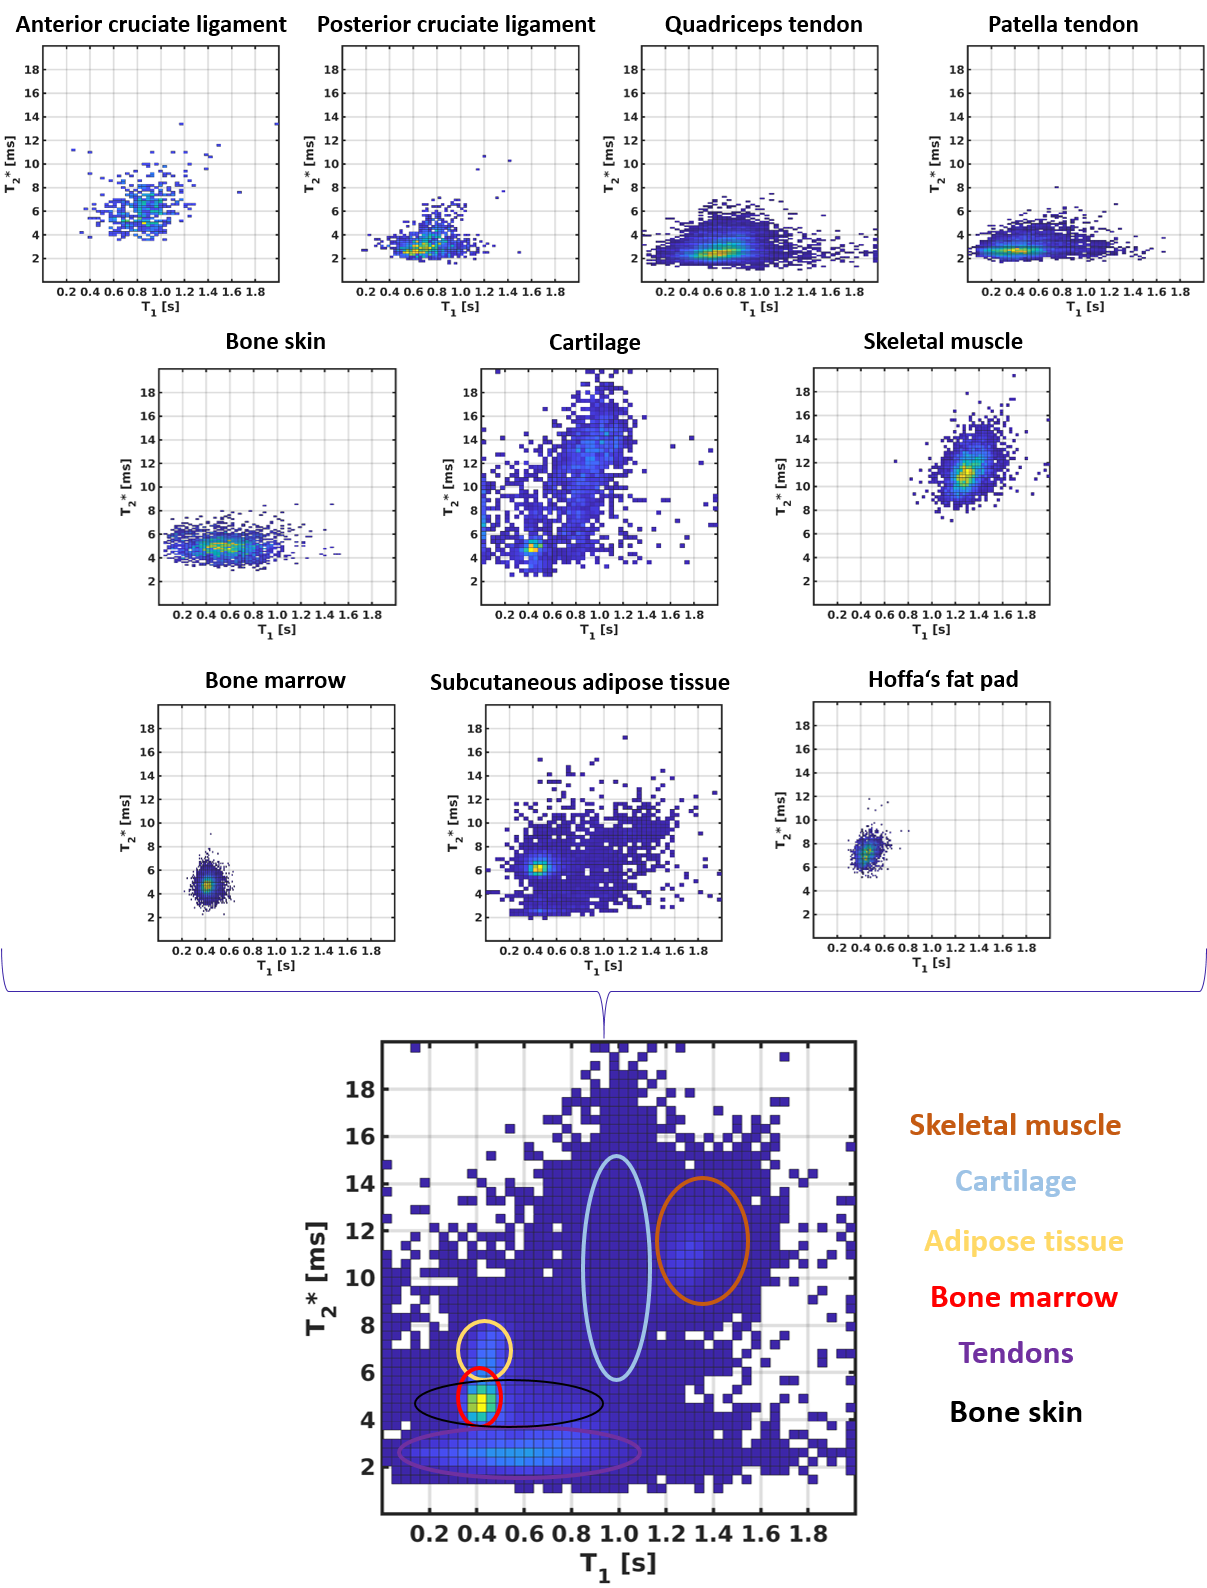
Figure 3: Bivariate histograms between T1 and T2* relaxation times of the 10 segmented tissues and the bivariate histogram (bottom row) of all segmented tissues combined across all five volunteers. The areas were different tissue clusters appear are highlighted.
DOI: https://doi.org/10.58530/2023/1623