1622
Measurement of NAD+ T1 relaxation time at 7T in the human brain using saturation recovery downfield MRS1Radiology, University of Pennsylvania, Philadelphia, PA, United States, 2Bioengineering, University of Pennsylvania, Philadelphia, PA, United States
Synopsis
Keywords: Quantitative Imaging, Spectroscopy
Here we present a method based on spectrally selective saturation recovery 1H spectroscopy to measure the apparent T1 values of NAD+ in the downfield at 7T for the first time. With spectrally selective saturation and excitation, NAD+ exhibits enhanced T1 recovery do to cross relaxation with water, and we report values in three subjects between 200 and 300 ms. Measuring apparent T1 is crucial as a correction factor for quantitative spectroscopy of NAD+.Introduction
Nicotinamide adenine dinucleotide (NAD+) plays a key role in human metabolism. NAD+ is involved in the electron transport chain during oxidative phosphorylation, the ratio with its reduced form NADH reflects the redox state of the cell, and it serves as a cofactor to numerous enzymes including sirtuins and poly-ADP-ribose polymerases. NAD+ has three protons which resonate at 8.9 ppm (H4), 9.1 ppm (H6), and 9.3 ppm (H2) that may be detected noninvasively in vivo with downfield (>4.7 ppm) magnetic resonance spectroscopy, which utilizes non-water-suppressed techniques that enhance longitudinal relaxation and increase sensitivity to downfield metabolites [1]. Accurate quantification of NAD+ via downfield spectroscopy requires correction for the effects of T1 and T2 relaxation. However, to date, T1 correction for NAD+ quantification has used values determined in rat brain at 11.7 T [2] and extrapolated to other field strengths [3,4]. In this work, we directly measure the T1 of NAD+ in human brain at 7T using selective saturation recovery to aid in future studies of NAD+ quantification.Methods
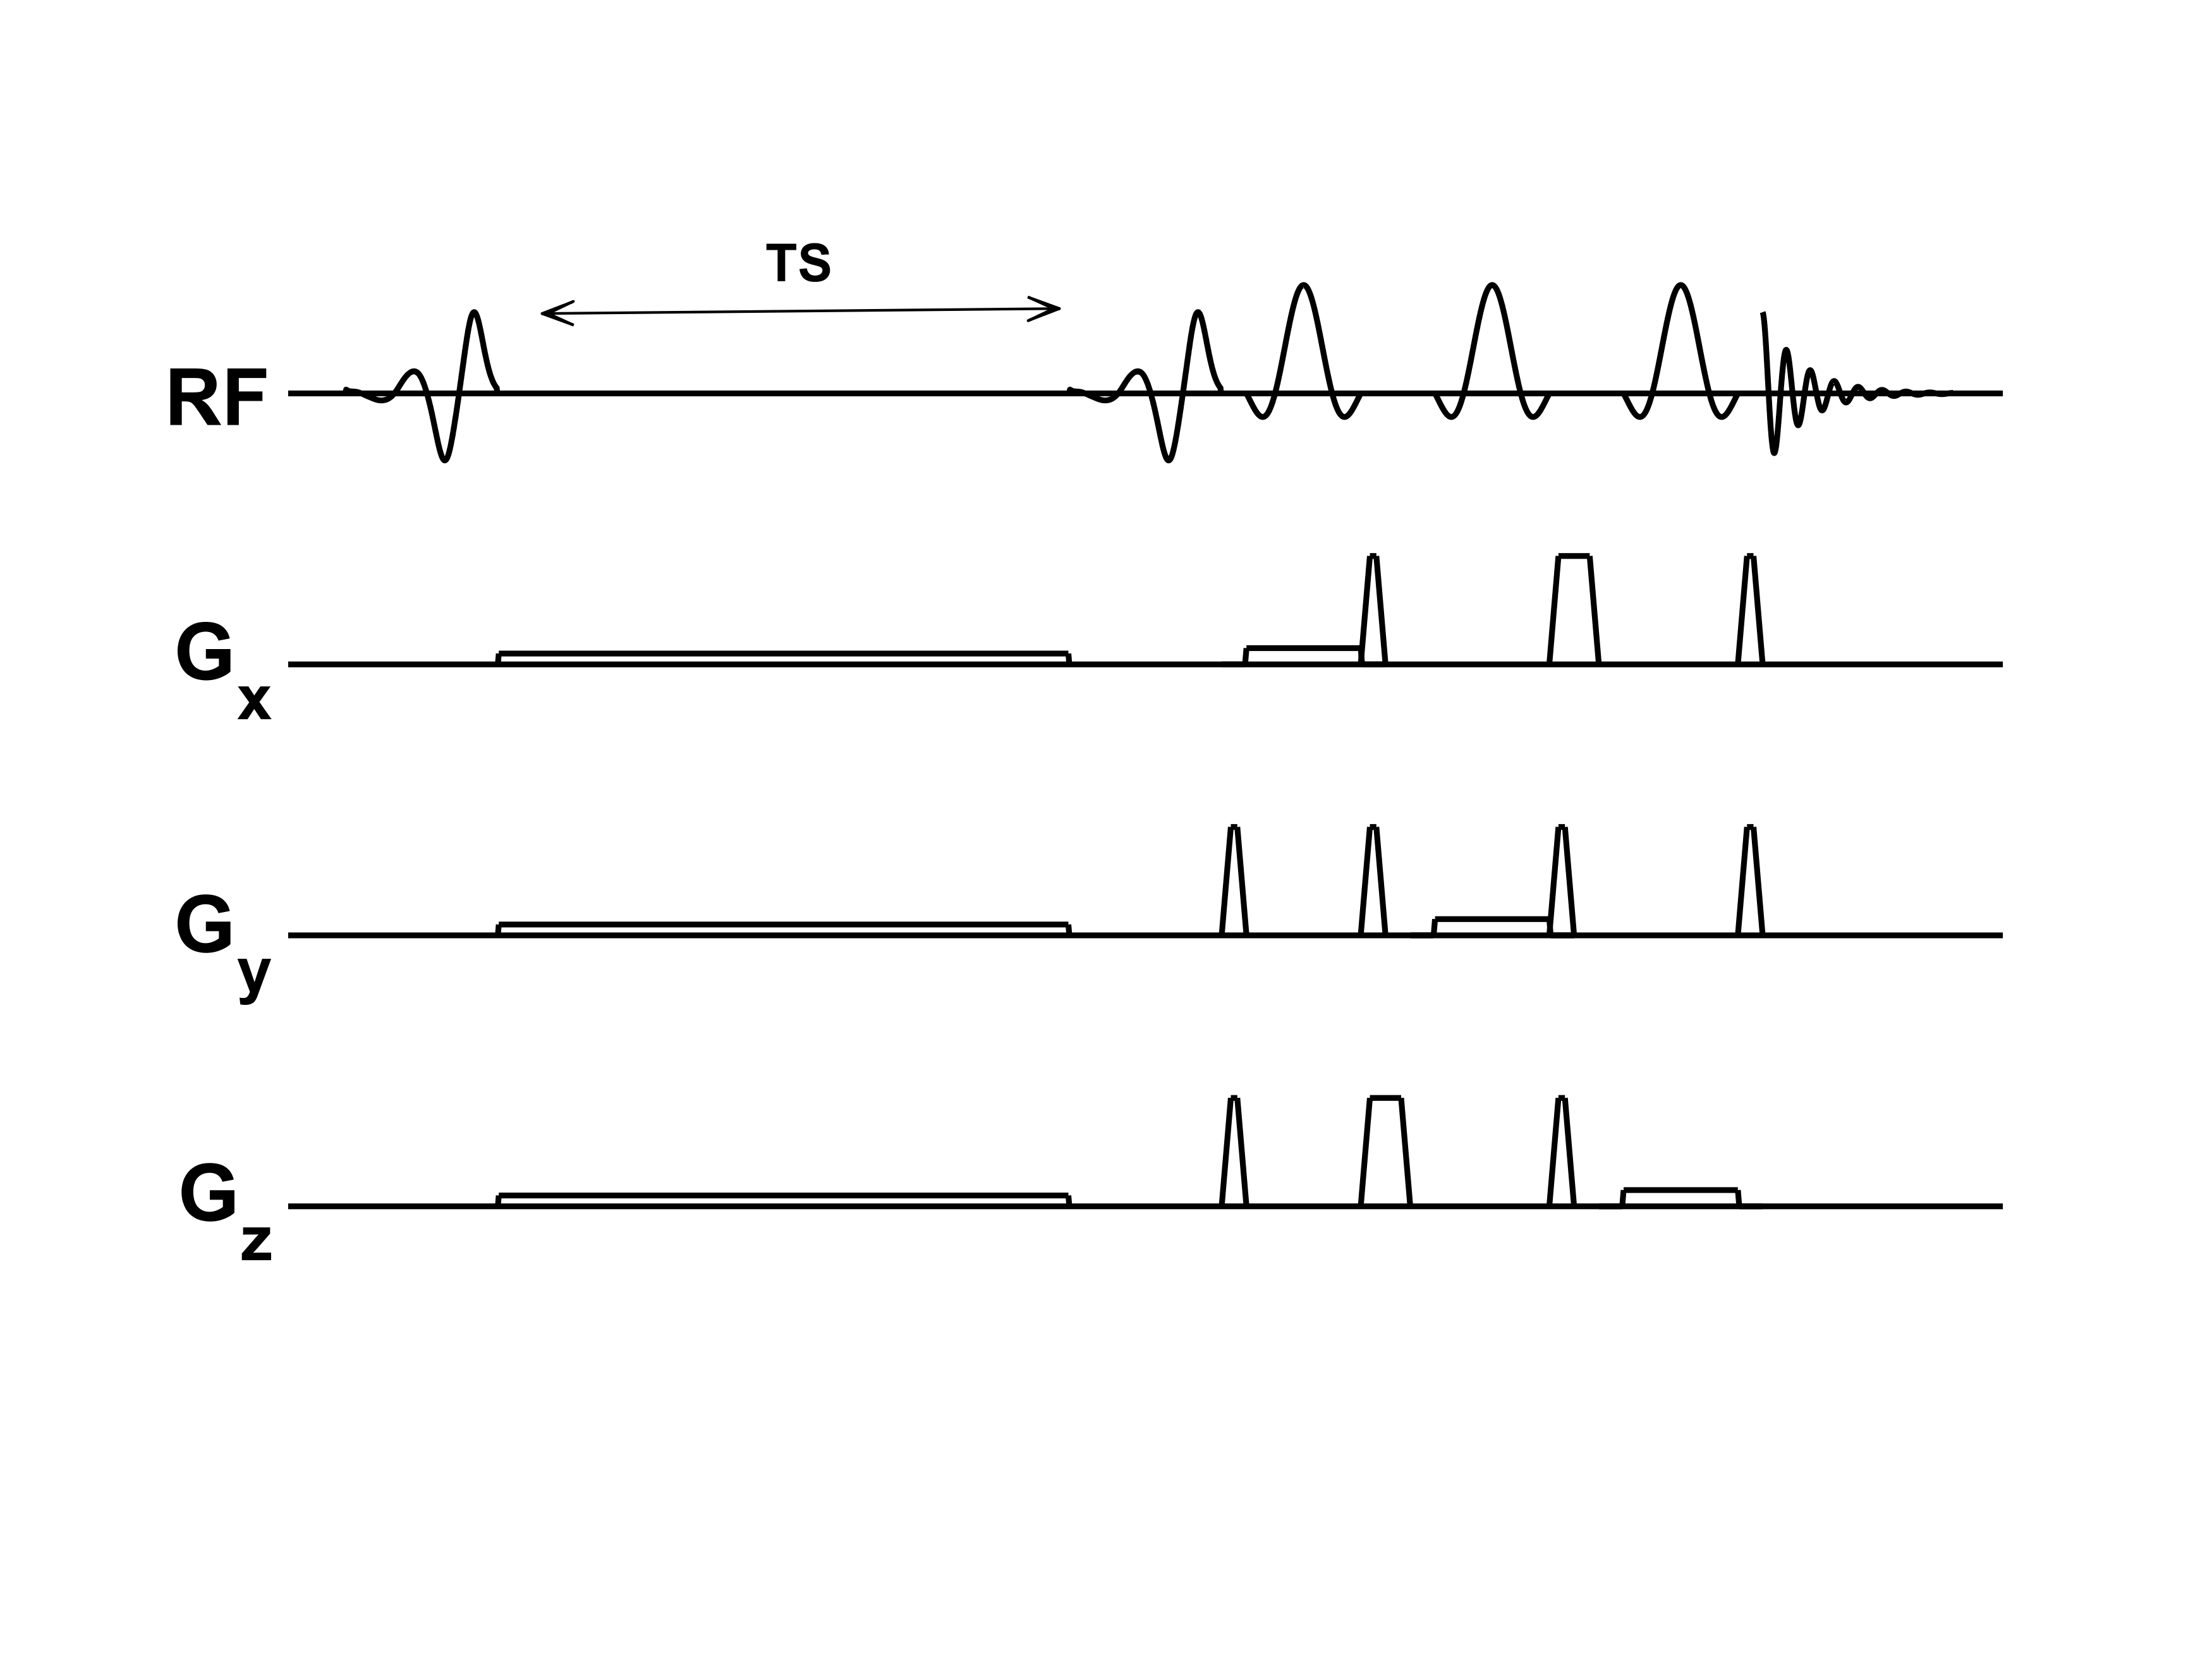
All participants in this study gave informed written consent, approved by the local IRB. We collected downfield saturation recovery data from the brain in 3 healthy volunteers at 7 T (MAGNETOM Terra, Siemens Healthcare, Erlangen, Germany) using a 32-channel RF head coil. Saturation was performed with a spectrally selective E-BURP [5] pulse centered at 9.7 ppm with a 2 ppm spectral bandwidth. After some delay TS, the same E-BURP pulse was used for excitation, followed by three spatially-selective 160° refocusing Shinnar-La Roux pulses for localization as illustrated in Figure 1. Sequence parameters are as follows: TR/TE = 3 s/18 ms, 64 averages with a 32 step phase cycle, 1024 readout points at bandwidth of 2000 Hz. The voxel size was 175 cm3 , and was localized in the occipital lobe of the brain. Data sets following saturation were collected with recovery delays of 5, 50, 100, 200, 300, 500 ms. One data set was collected with the same acquisition parameters without saturation to help determine the equilibrium magnetization M0. Each scan was 3 min 12 s for a total scan time of 22 min 24 s excluding an anatomical T1-weighted scan, reference voltage calibration, and manual shimming.Following a 5 Hz line broadening, individual spectra were fit using a time domain method based on HSVD using 40 components [6, 7]. Each NAD peak was represented by a single component, and the H6 and H2 NAD+ peaks were fit to a three parameter exponential recovery model $$$ S = M0 (1 - exp(-TS/T1) ) + C $$$, with the peaks from the unsaturated scan assigned to an arbitrarily large TS of 5000 ms. S is the signal, while C is an offset constant. The H4 peak was excluded because it sits on the tail of the larger NAA/adenosine pool and is therefore harder to fit reliably.
Results
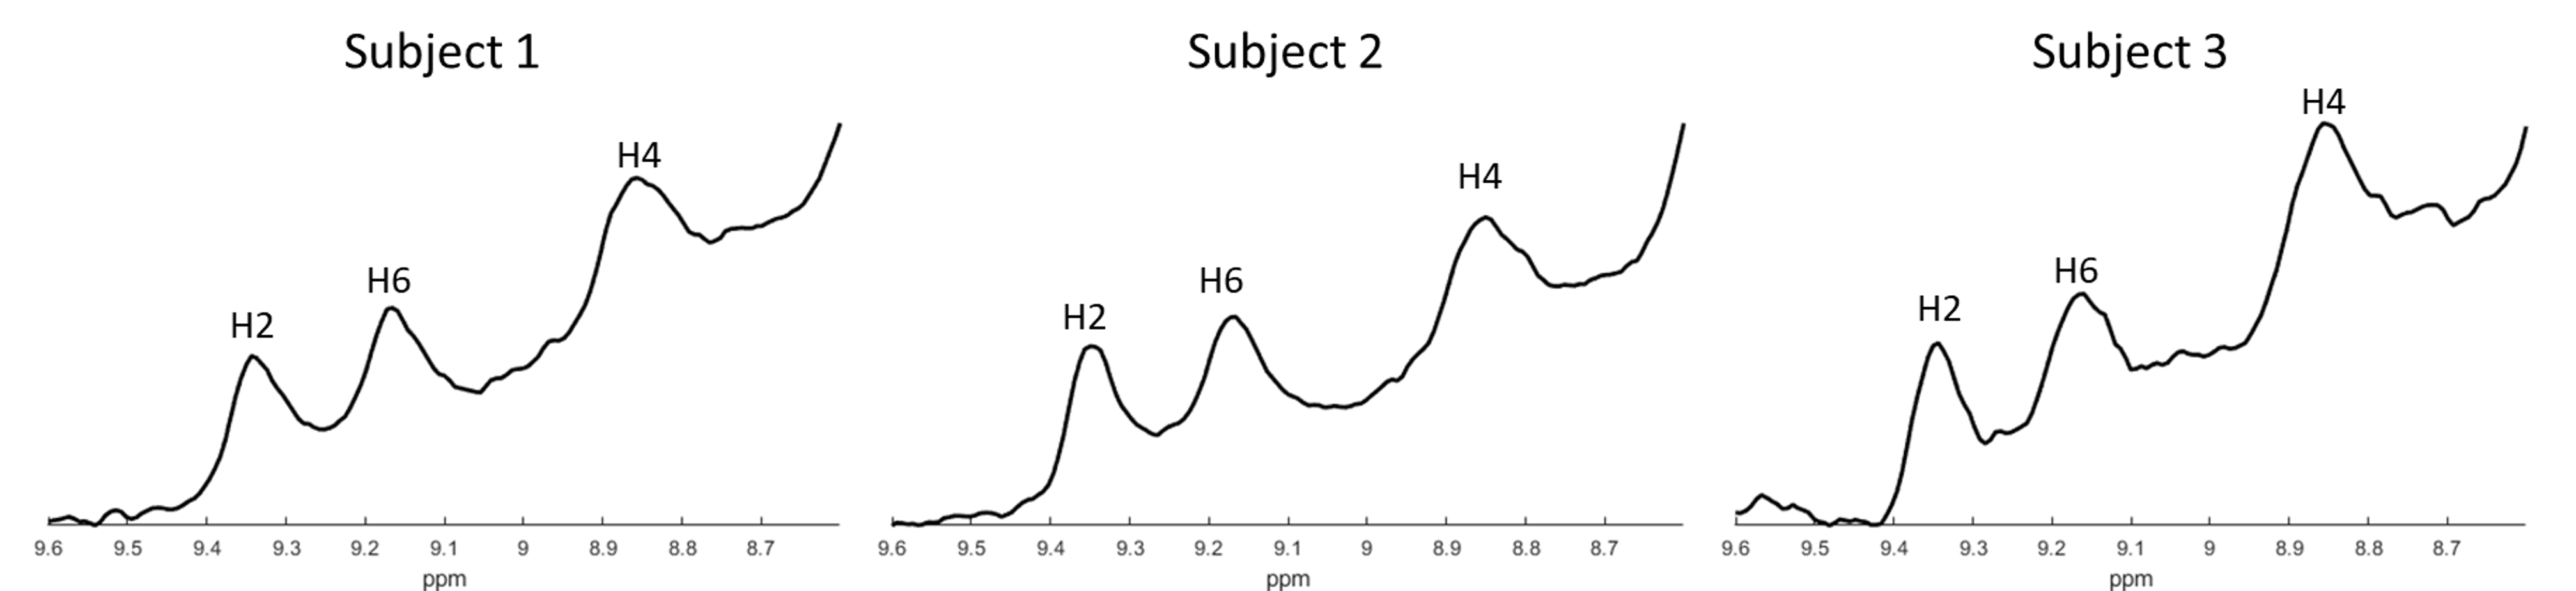
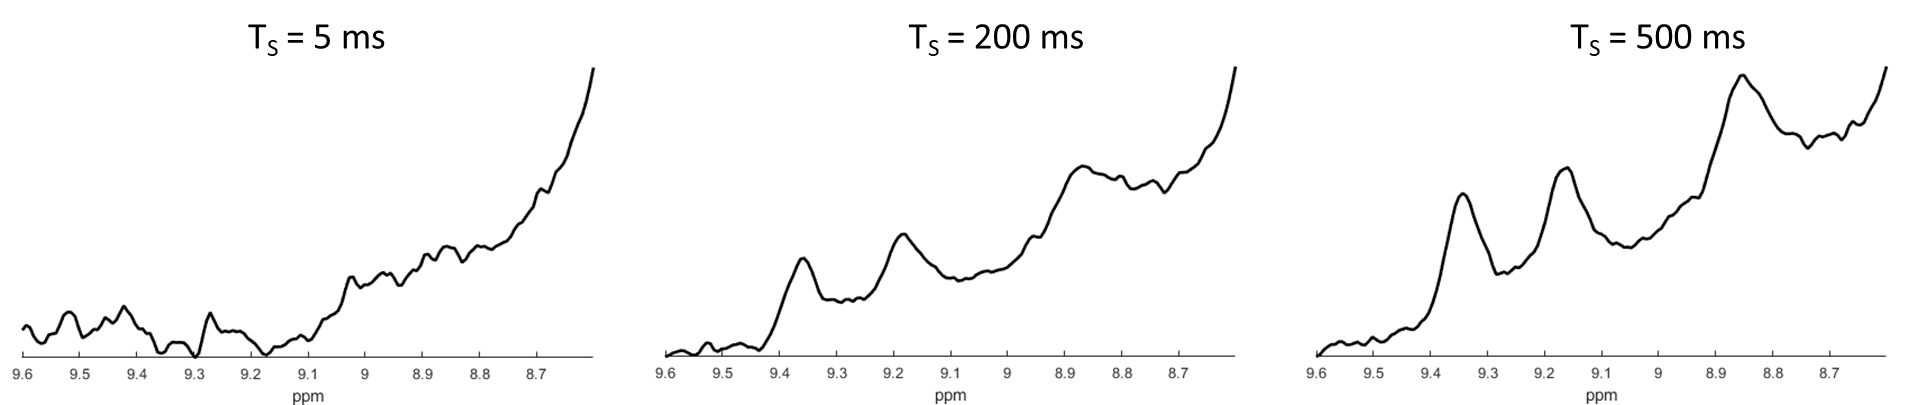
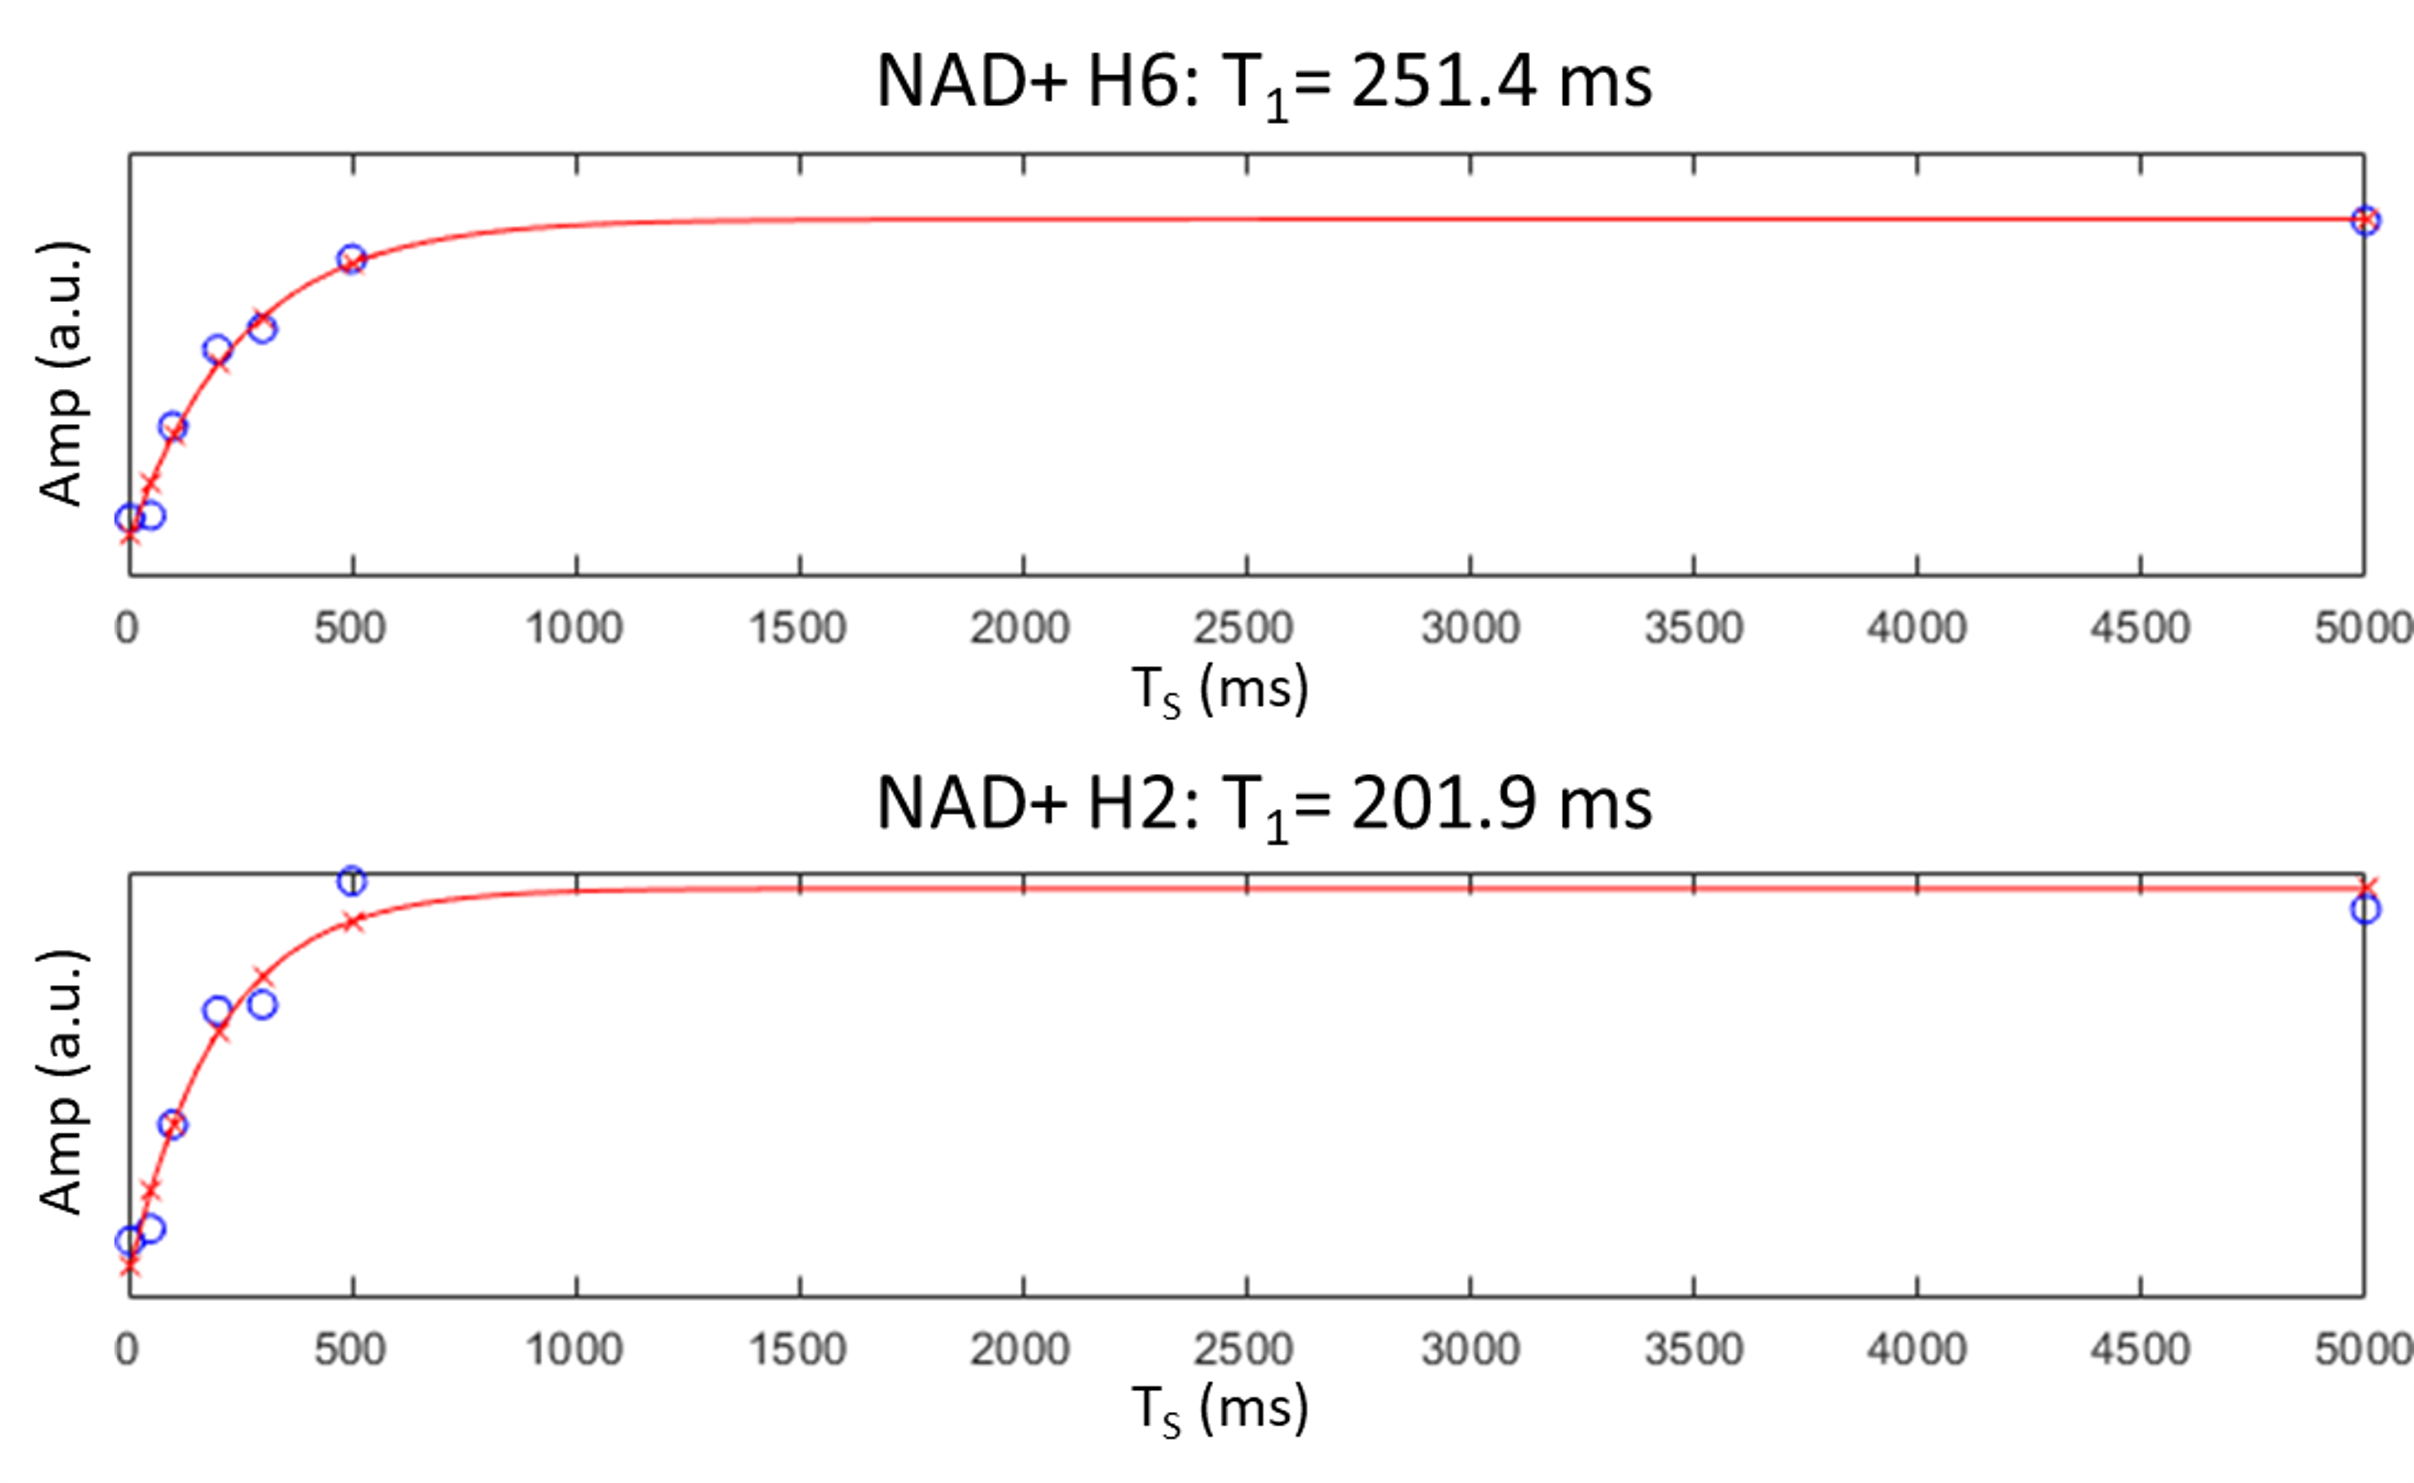
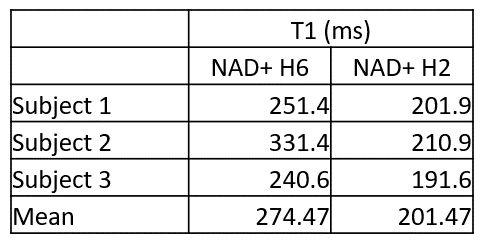
Figure 2 shows the non saturated M0 scans for all three subjects. All three NAD+ peaks are clearly visible, while the H6 and H2 peaks are also on a relatively flat baseline. Figure 3 shows a subset of spectra following saturation with recovery delays of 5, 200, and 500 ms taken from the third subject, while Figure 4 shows the fitted T1 recovery curves of the H6 and H2 NAD+ peaks. The R2 values of fits are 0.958 and 0.964, respectively. Table 1 shows a table of the complete T1 values for the H6 and H2 peaks for all three subjects along with mean values of 270 and 200 ms, respectively. All fitted R2 values are greater than 0.9.Discussion and Conclusion
Using the HSVD-based time domain fitting and selective saturation recovery data, H6 and H2 NAD+ peaks are reliably quantified throughout the range of TS times. This is in contrast to methods based on inversion recovery where inefficient inversion and differences in T1 values can create spectra with complicated phase and baselines resulting from signal from NAA/adenosines at short and intermediate inversion times. As our goal here is to measure T1s of NAD+ for the purposes of absolute quantitation, correction for incomplete longitudinal relaxation between scans is desired, which is closely related to the selective saturation recovery experiment presented here. Future work will investigate the differences in apparent T1s when using saturation or inversion recovery.Measured T1 values are consistent with those previously reported in rat brain at 11.7 T and illustrate the enhanced longitudinal recovery of cross relaxing spins when the water magnetization remains relatively unperturbed. Methods based on non selective saturation or inversion recovery would result in longer apparent T1 values that are not appropriate for correction of data acquired with selective excitation. Correcting for T1 relaxation is a critical step in order to quantify NAD+ as a biomarker.
Acknowledgements
Research reported in this publication was supported by the National Institute of Biomedical Imaging and Bioengineering of the National Institutes of Health under award numbers P41EB029460 and T32EB020087.References
[1] de Graaf, Robin A., et al. "Detection of cerebral NAD+ in humans at 7T." Magnetic resonance in medicine 78.3 (2017): 828-835.
[2] de Graaf, Robin A., and Kevin L. Behar. "Detection of cerebral NAD+ by in vivo 1H NMR spectroscopy." NMR in biomedicine 27.7 (2014): 802-809.
[3] Bagga, Puneet, et al. "Single‐Voxel 1H MR spectroscopy of cerebral nicotinamide adenine dinucleotide (NAD+) in humans at 7T using a 32‐channel volume coil." Magnetic resonance in medicine 83.3 (2020): 806-814.
[4] Dziadosz, Martyna, et al. "Quantification of NAD+ in human brain with 1H MR spectroscopy at 3 T: Comparison of three localization techniques with different handling of water magnetization." Magnetic resonance in medicine (2022).
[5] Geen, Helen, and Ray Freeman. "Band-selective radiofrequency pulses." Journal of Magnetic Resonance (1969) 93.1 (1991): 93-141.
[6] Barkhuijsen, H., R. De Beer, and D. Van Ormondt. "Improved algorithm for noniterative time-domain model fitting to exponentially damped magnetic resonance signals." Journal of Magnetic Resonance (1969) 73.3 (1987): 553-557.
[7] Swago S, et al. "Quantification of high-field 1H downfield MRS metabolites and cross-relaxation using time-domain spectral fitting." 2022 ISMRM Workshop on Ultra-High Field MR. Lisbon, Portugal. 19-22 March 2022.
Figures