1621
Multiparametric quantitative MRI mapping using ultrahigh-field strength
Zaheer Abbas1, Markus Zimmermann1, Dominik Ridder1, Ana-Maria Oros-Peusquens1, and N. Jon Shah1,2,3,4
1Institute of Neuroscience and Medicine 4, Jülich, Germany, 2Institute of Neuroscience and Medicine 11, INM-11, JARA, Forschungszentrum Jülich, Jülich, Germany, 3JARA - BRAIN - Translational Medicine, Aachen, Germany, 4Department of Neurology, RWTH Aachen University, Aachen, Aachen, Germany
1Institute of Neuroscience and Medicine 4, Jülich, Germany, 2Institute of Neuroscience and Medicine 11, INM-11, JARA, Forschungszentrum Jülich, Jülich, Germany, 3JARA - BRAIN - Translational Medicine, Aachen, Germany, 4Department of Neurology, RWTH Aachen University, Aachen, Aachen, Germany
Synopsis
Keywords: Quantitative Imaging, Brain
Measurement of quantitative, tissue-specific MR properties such as water content or relaxation times using quantitative-MRI at clinical field strength (1.5T and 3T) is a well-explored topic. Established methods for water content mapping are based on the variable flip-angle (VFA) approach. However, transition to ultrahigh field strength remains challenging due to significantly increased RF field inhomogeneity. Here, we demonstrate a novel VFA method to acquire quantitative water content and relaxation times at 7T with full brain coverage and 1x1x1.5 mm resolution within 7 min. Accuracy and precision of the parametric maps is demonstrated by comparison to already reported results.Introduction
MRI offers non-invasive measures of tissue microstructures and macromolecules and has become increasingly available for fields such as biology, neuroscience, or diagnostic imaging. Its benefit in terms of that qualitative and quantitative measure of tissue properties with high SNR and potentially higher resolution of anatomical detail has already shown its importance in medical research for studying various pathologies of the human brain, such as the detection of cerebral oedema.1,2,3,4 A variety of methods for parametric mapping exists that allows one to quantify tissue hydration and tissue relaxation times (T1, T2*). These include multi-echo spoiled gradient echo (MEGE)5, hybrid MEGE / TAPIR6, and IR-SE9 based methods. In this preliminary work, an existing MEGE-based approach developed for clinical field strength (1.5T and 3T system)5,7,8 is further exploited for mapping of water content and relaxation times (T1, T2*) at ultrahigh-field strength (i.e. 7T). Instead of MR acquisitions for the detection of the nonuniform receiver profile of the NMR detection coil array more sophisticated post-processing approach was employed to estimate the quantitative parameter while preserving the accuracy. This helps to shorten acquisition time, which is often demanded by users in the fields of clinical and neuroscientific imaging, especially for patient comfort and to avoid motion over a longer time. Established methods at lower field strength to map are based on the variable flip angle (VFA) protocol. This technique acquires several. It additionally yields estimates for T1 and T2* but is slow and sensitive to inhomogeneity that occurs at ultra-high field strength. The proposed acquisition scheme uses multi-echo gradient-echo (MEGE) sequences with different flip angles and turbo spin echo (TSE) sequences for transmit field inhomogeneity correction. It yields accurate and robust parametric estimates even at high field strength.Methods
Following prior, written, informed consent, MR data was acquired from five healthy, male subjects (age range 26-32 years) on a commercial 7T scanner (MAGNETOM Terra, Siemens Healthineers, Erlangen, Germany) using the 32-element NOVA coil. The following measurements were performed: two multiple echo gradient echo sequence (MEGE) 2D measurements for the VFA method and a TSE sequence for transmit field inhomogeneity correction. The GRE MRI scan (TR = 1800 ms, FA = 40°, 9 echoes, TE1 = 5.8 ms, ΔTE = 5.0 ms, acquisition time (TA)= 5 min) allows one to estimate the MR-visible water content. However, it requires the following corrections: i) compensation of the transmit (B1Tx) inhomogeneity: ii) compensation of the T2* decay: iii) correction of the T1-saturation effect; iv) correction of residual non-uniformity.7,8 The corrections i) to iii) involve the inclusion of additional MRI acquisitions to the water content imaging protocol, namely, a second MEGE scan (TR=600ms, TE=5.8ms, FA=70°, TA = 1.5 min) for estimating longitudinal relaxation time (T1), a TSE sequence for estimation of B1Tx. The signal at zero echo time is reconstructed using an appropriate parametric model of the gradient echo decay. Slice profile correction was performed to resolve the problem of a systematic error in the steady-state correction.10 Measurement of the static field B0 and T2* was performed using 2D-GRE acquisition. Furthermore, the influence of T1 effects on the estimated water content map is evaluated using a dedicated method including T1 and T2* information prior to calibration to the lateral ventricles.8 The entire MR acquisitions were achieved in 7 min for the 1mm in-plane resolution.Results
The graphical pipeline shown in Fig. (1) summarises the important steps described in this section for the estimation of the quantitative water content and relaxation times. Fig. 2 shows quantitative maps (FW, T1, - T2*) from a representative. Fig. 3 shows histogram analyses of the quantitative maps for all parameters. Fig. 4-6 show FW, T1, and T2* maps from all volunteers. Furthermore, region-of-interest (ROI) analysis of white and grey matter ROIs is represented in Fig. 7, which agrees with the literature. All quantitative images reflect comparable results; however, the benefit of high field is yet not unveiled and needs further observations.Discussion and conclusion
Ultrahigh field MRI can deliver higher SNR and higher contrast-to-noise ratio, however, scanning with higher resolution may lead to increased field inhomogeneities and requires longer acquisition times, which in turn increase the discomfort for the subject and the risk of subject motion. In this study, an existing MEGE-based approach developed for clinical field strength (1.5T and 3T system) 5,6,7,8 is further optimized for mapping of water content and relaxation times at ultrahigh field strength. The proposed is accurate and provides robust multi-parametric MRI with a resolution of 1x1x1.5 mm3 and full brain coverage within an acquisition time of 7 minutes. Further studies are required to deal with subject motion by implementing motion robust quantification, for example, radial MRI acquistions11, and could facilitate efficient acceleration techniques to reduce measurement time.12Acknowledgements
No acknowledgement found.References
[1] Shah et al.: Quantitative cerebral water content mapping in hepatic encephalopathy. NeuroImage 41, 706–717, 2008 [2] Brix, G et al.: Evaluation of proton density by magnetic resonance imaging: phantom experiments and analysis of multiple component proton. PhysMedBio 1990. [3] Christiansen, P et. al.:. MR-visible water content in human brain: a proton MRS study. Magn. Reson. Imaging 1994. [4] Tofts, P.S et al.: Quantitative MRI of the Brain. PD: Proton Density of TissueWater.Wiley 2003. [5] Neeb et al.: Fast quantitative mapping of absolute water content with full brain coverage. NeuroImage 42(3), 1094-1109, 2008 [6] Neeb et al.: A new method for fast quantitative mapping of absolute water content in vivo. NeuroImage 31, 1156 – 1168, 2006. [7]Abbas et al.: Analysis of Proton-Density Bias Corrections Based on T1 Measurement for Robust Quantification of Water Content in the Brain at 3 Tesla. MRM 2014. [8] Abbas et al.: Quantitative water content mapping at clinically relevant field strengths: A comparative study at 1.5 T and 3 T. NeuroImage 2015. [9] Warntjes et al.: Novel Method for Rapid, Simultaneous T1, T2*, and Proton Density Quantification. Magnetic Resonance in Medecine 57, 528-537, 2007. [10] Gras et al.: Spoiled FLASH MRI with slice selective excitation signal equation with a correction term. Concepts Magn. Reson. A 42, 89–100. [11] Zimmermann et al.: Radial MRI and model-based iterative reconstruction for motion robust quantification of the water content in the brain at 3 Tesla, ISMRM 2017. [12] Zimmermann et al.: Accelerated parameter mapping of multiple-echo gradient-echo data using model-based iterative reconstruction, IEEE Transactions on Medical Imaging, to be publishedFigures
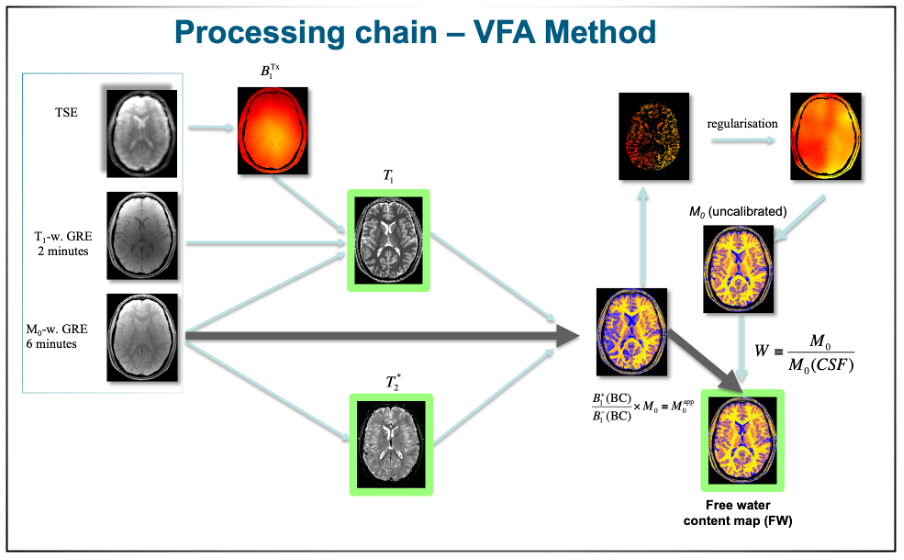
Fig 1:
Graphical representation of
the processing steps involved in the estimation of the water content using a
dedicated MRI protocol.
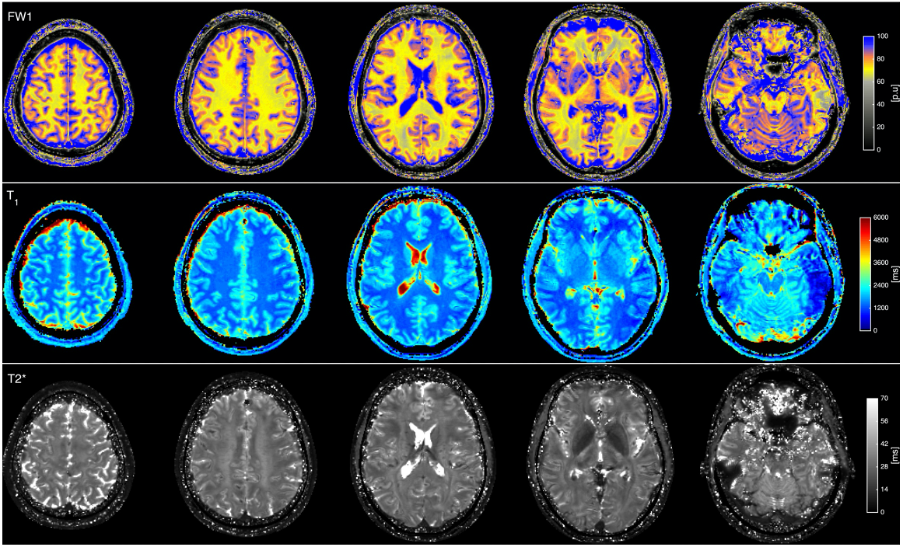
Fig 2:From
a representative subject of the cohort, water content map (row1); estimated T1 map
(first row), and estimated T2* map of the brain( third row)
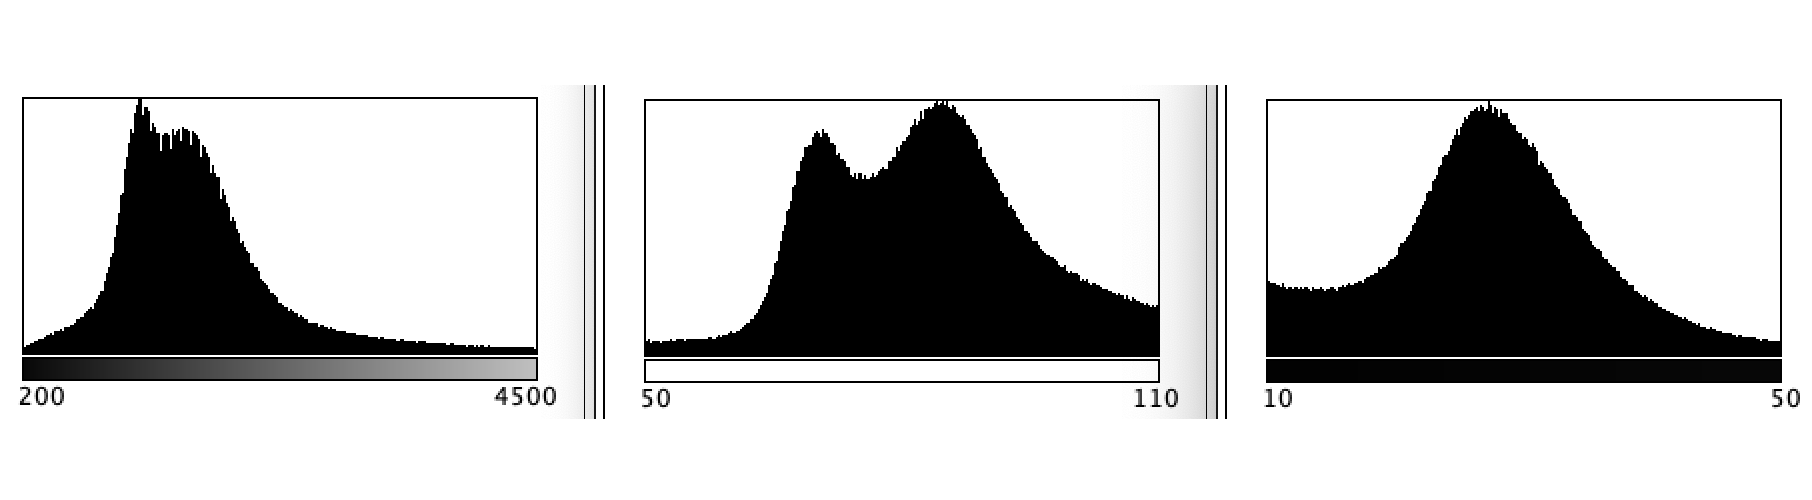
Fig 3: Histogram analysis of in vivo results in native space. T1 (left), Water
content map (middle), and T2* (right).
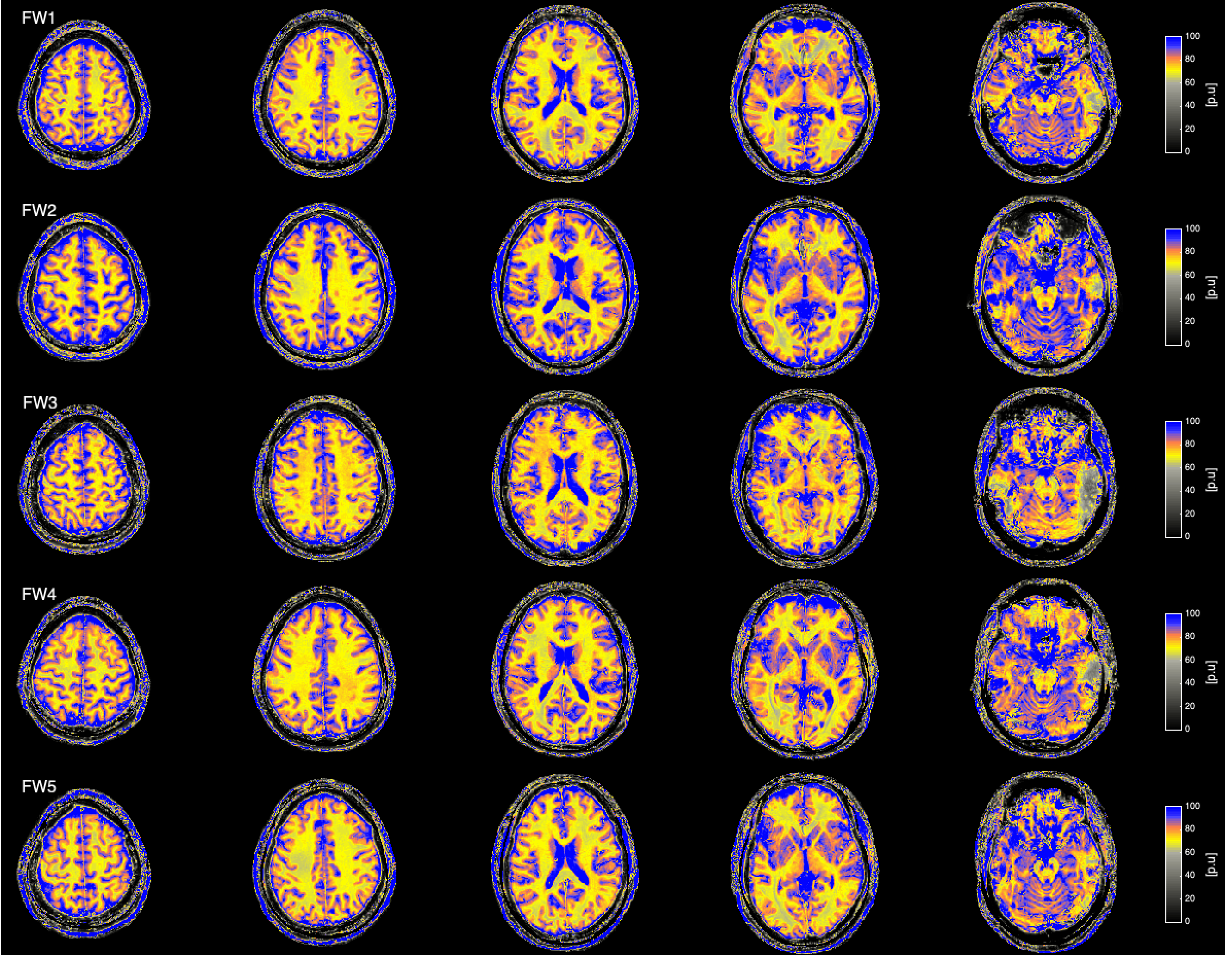
Fig. 4: Water content maps from all
volunteers.
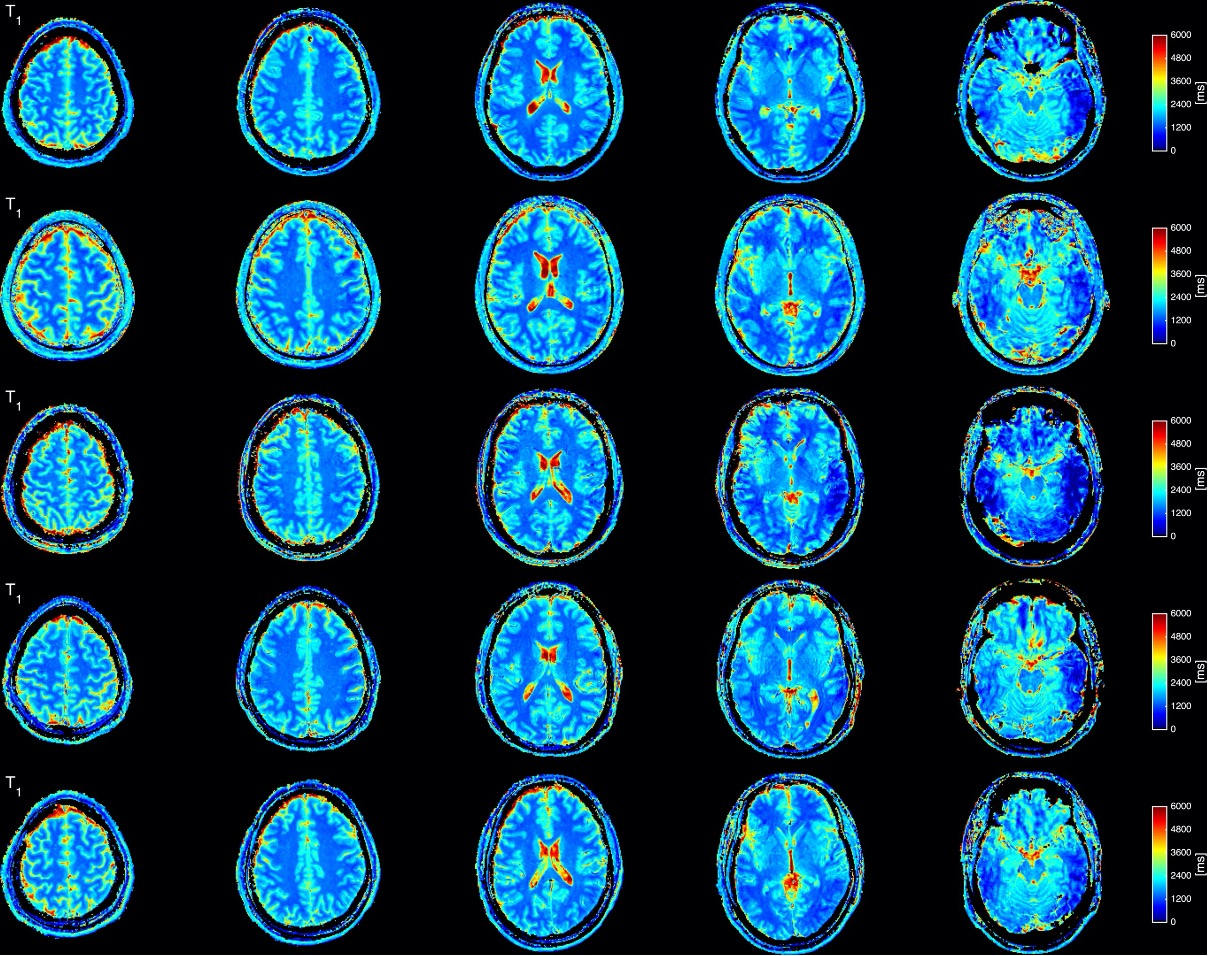
Fig. 5: Longitudinal relaxation time (T1) maps from all
volunteers.
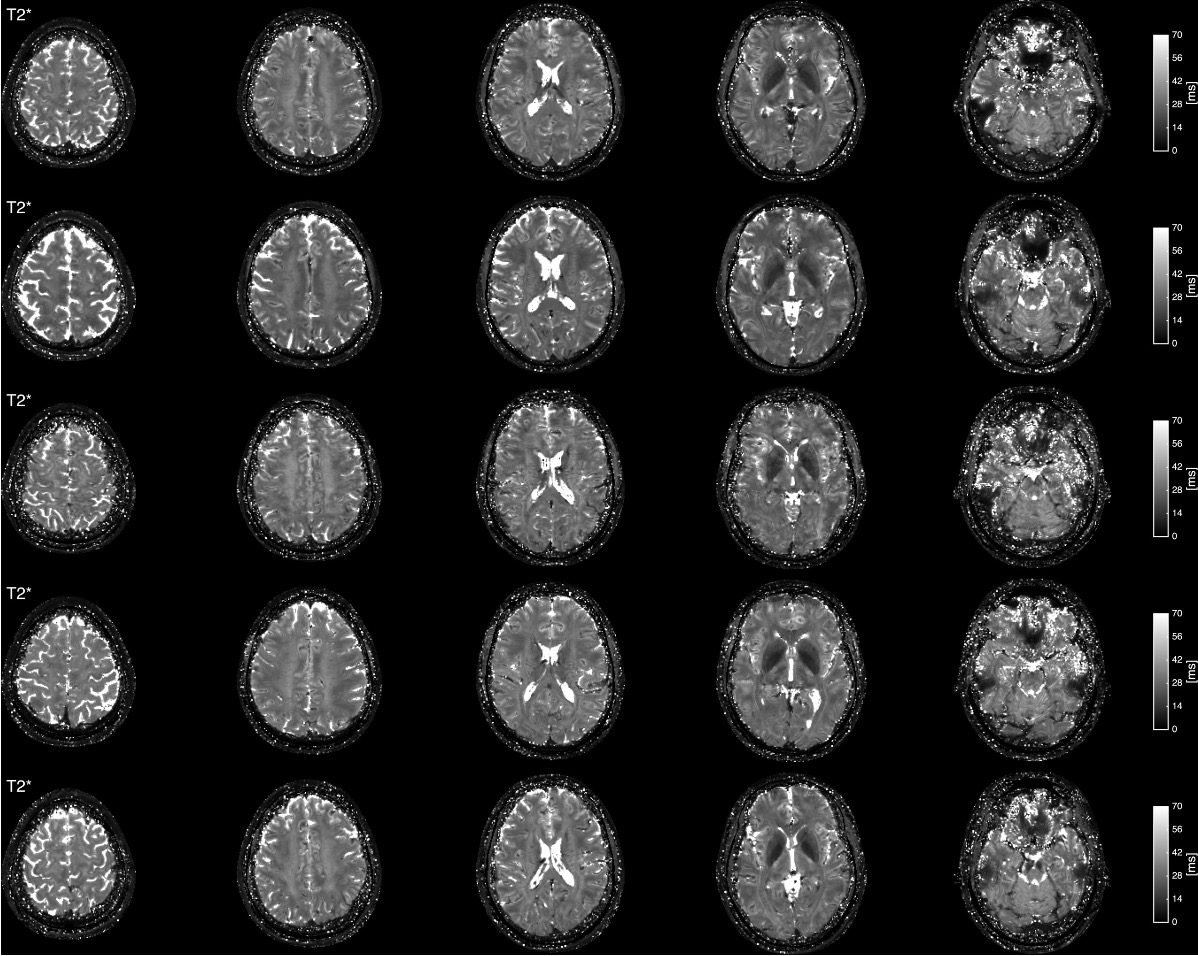
Fig. 6: Tranverse relaxation time (T2*) maps from all
volunteers.
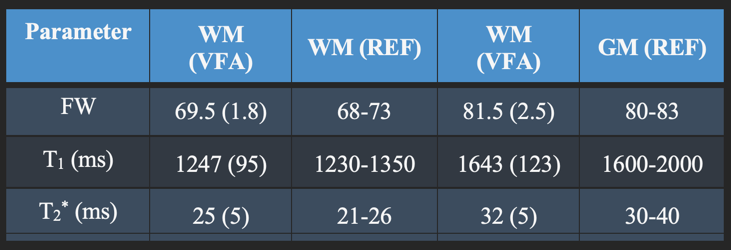
Fig 7: Median water content, T1 and T2* values in grey and white matter provided by VFA and the reference literature values.
DOI: https://doi.org/10.58530/2023/1621