1620
T1 Spectrum Analysis with Reduced Number of Datapoints Using Neural Networks
Tristhal Parasram1 and Dan Xiao1
1University of Windsor, Windsor, ON, Canada
1University of Windsor, Windsor, ON, Canada
Synopsis
Keywords: Quantitative Imaging, Relaxometry
Quantitative analysis of T1 spectra could reveal microscopic properties and have been used to study biological tissues such as the heart, brain and related disease. It is challenging to determine the relaxation times from magnetic resonance signals particularly with multicomponent continuous spectra as it is an inherently ill-posed exponential analysis problem even with a large number of input data points. Artificial neural networks have been trained to determine T1 spectra with 8 to 4 logarithmically spaced data points. Improved performance over a larger range of T1 values and faster processing time compared to traditional methods have been achieved.Introduction
T1 relaxation time spectrum analysis is an intrinsically ill-posed problem. Regularization and constraints are required to provide a stable solution to the exponential analysis in the traditional inverse Laplace transform (ILT)1. An additional phase correction step is required to process the inversion recovery amplitude data with ILT. The scan time of spatially resolved T1 spectrum measurement is proportional to the number of input data points, i.e., T1 weighted images. The spectrum accuracy decreases with a reduced number of input data. Extending our previous work using artificial neural networks (ANN) for T2 spectrum analysis2, neural networks have been trained to generate multicomponent T1 spectra with 8 or fewer input data points. The performance was evaluated across a large parameter range. Compared to the traditional method, improved computation speed was achieved with higher accuracy over a larger range of T1 values.Methods
The networks were trained on simulated inversion recovery signals with different numbers of inversion times (8, 5, 4) logarithmically spaced across three orders of magnitude. Rician noise was added, and several networks were trained for data with different SNR. The network was trained in a multi-step process alternating between simulated T1 spectra consisting of narrow and wide peaks.The networks were evaluated with simulations and a CuSO4 phantom experiment. The test simulations consisted of one-peak and two-peak T1 spectra with various peak positions (log mean T1 values), peak area ratios and widths. The results were compared with the traditional ILT with a regularization parameter of 0.1. Ideal phase correction was applied before performing ILT. The phantom was comprised of two concentrations of CuSO4 doped water and was measured using an inversion recovery sequence with 8 inversion time points.
Results and Discussion
Single component spectra with varying peak widths and positions were simulated at 200 SNR and with 8, 5, and 4 inversion times. The error in the ANN and ILT were compared to analyze how the performance degrades with fewer input points. The error maps of the log mean T1 are shown in Fig. 1. Systematic errors occurred with ILT when T1 was below 2 ms/10 ms (3.3/4 in log scale) or above 400 ms/100 ms (5.6/5 in log scale) for 8/4 input points. This results from the widening of peaks below 1ms/above 1s which occurred with two peaks as well. The ANN has lower error over a larger range of T1 values.To compare the resolution limit of the ANN with the traditional ILT, spectra with two narrow peaks (0.2 width in log scale) of varying peak position and a fixed 1:1 area ratio were simulated at 200 SNR and with 8 and 5 inversion time points. Error maps for the log mean peak position and peak area for the simulations with 8 inversion times are shown in Fig. 2. The resolution limit is indicated by the red line beyond which only a single peak was detected, which was approximately 3.7 in linear scale for the ANN and 4.6 for ILT. With an SNR of 80, the error maps resemble Fig. 2, with overall increased error and lower resolution limits, but ANN had improved accuracy compared to ILT (results not shown). With only 5 inversion time points, the performance of both methods reduced, as shown in Fig. 3. The ANN error was still significantly lower than ILT. Fewer input data points led to wider T1 spectrum peaks, especially for ILT, where the resolution limit was drastically reduced and error was significantly higher.
An inversion recovery experiment was performed on a two component CuSO4 phantom, and the ANN and ILT spectra are shown in Fig. 4. The broadening of the larger component beyond 6 (log scale) with ILT in the dashed line appeared agreeing with the simulations. The broadening causes a 70% error in the larger component log mean T1 value in ILT, while the ANN result has less than 10% error for both peaks.
Conclusion
We demonstrated that ANNs could be effective for rapid analysis of continuous multicomponent T1 distributions with few input data points in the presence of noise. The performance of the network was superior compared to the traditional ILT method without requiring phase correction. This method could be extended to other forms of T1, T2 and diffusion measurements, or higher dimensional relaxation/diffusion correlations with a reduced number of input data points.Acknowledgements
TP thanks NSERC Canada for a CGS D scholarship. DX thanks NSERC Canada for a Discovery grant.References
1. Song, Y. Q. et al. T1-T2 correlation spectra obtained using a fast two-dimensional Laplace inversion. Journal of Magnetic Resonance 154, 261–268 (2002).
2. Parasram, T., Daoud, R. & Xiao, D. T2 analysis using artificial neural networks. Journal of Magnetic Resonance 325, 106930 (2021).
3. Chollet, F. Keras. Preprint at https://keras.io (2015).
4. van der Walt, S., Colbert, S. C. & Varoquaux, G. The NumPy array: A structure for efficient numerical computation. Comput Sci Eng 13, 22–30 (2011).
Figures
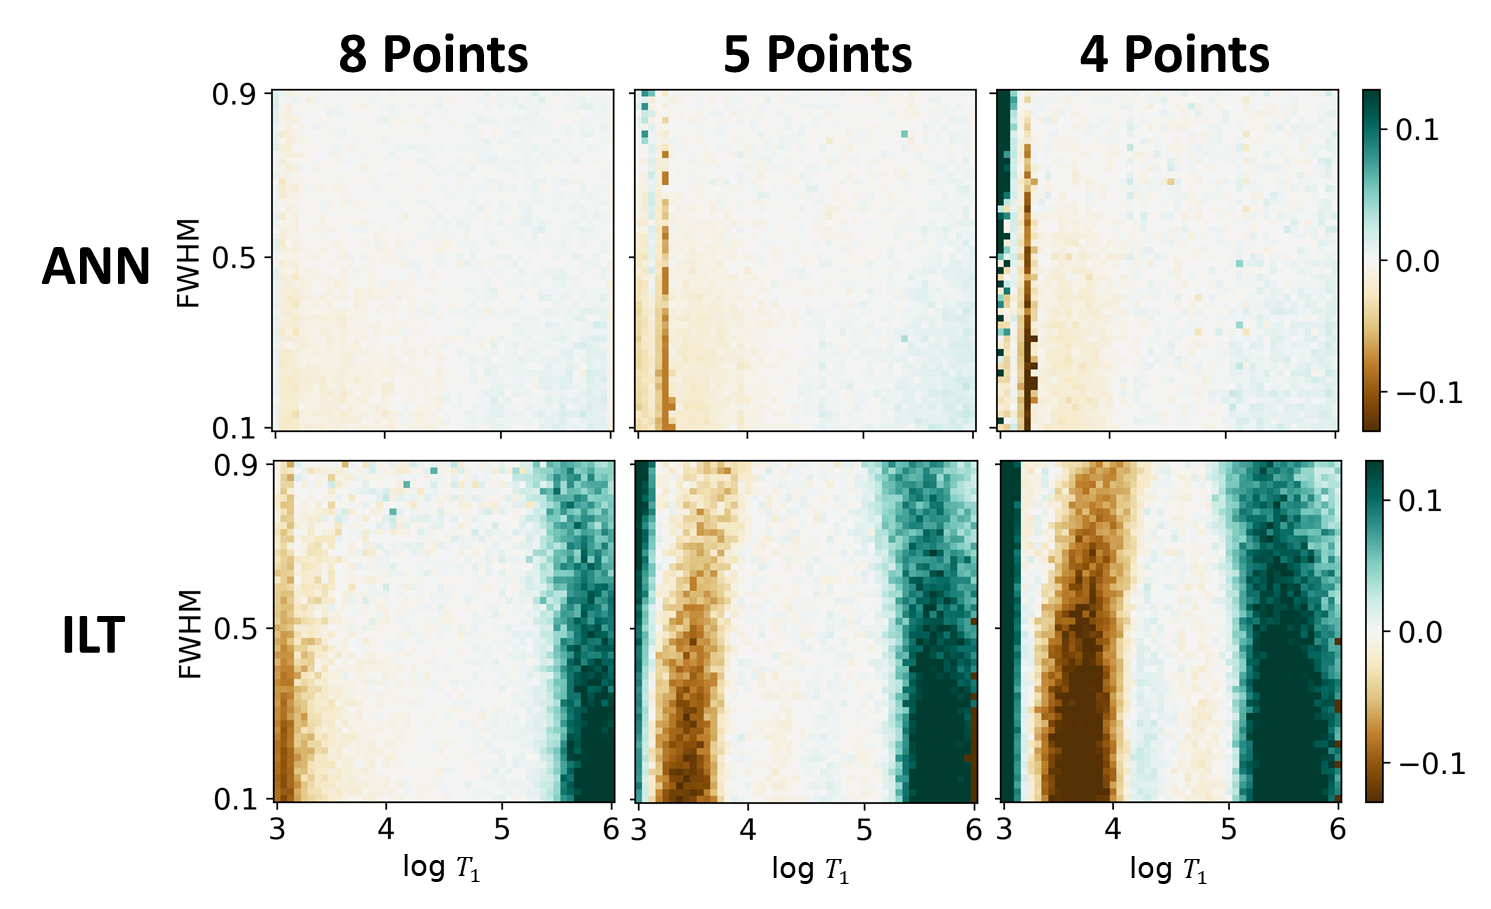
Fig. 1. Error
maps of the log mean T1 values of simulated one-peak T1 spectra with varying peak full width half maximum (FWHM) and peak position, and a 200 SNR. The errors increased with reduced number of input data points. ANN outperformed ILT. The regularization parameter in ILT was 0.1 for all the results presented in this work.
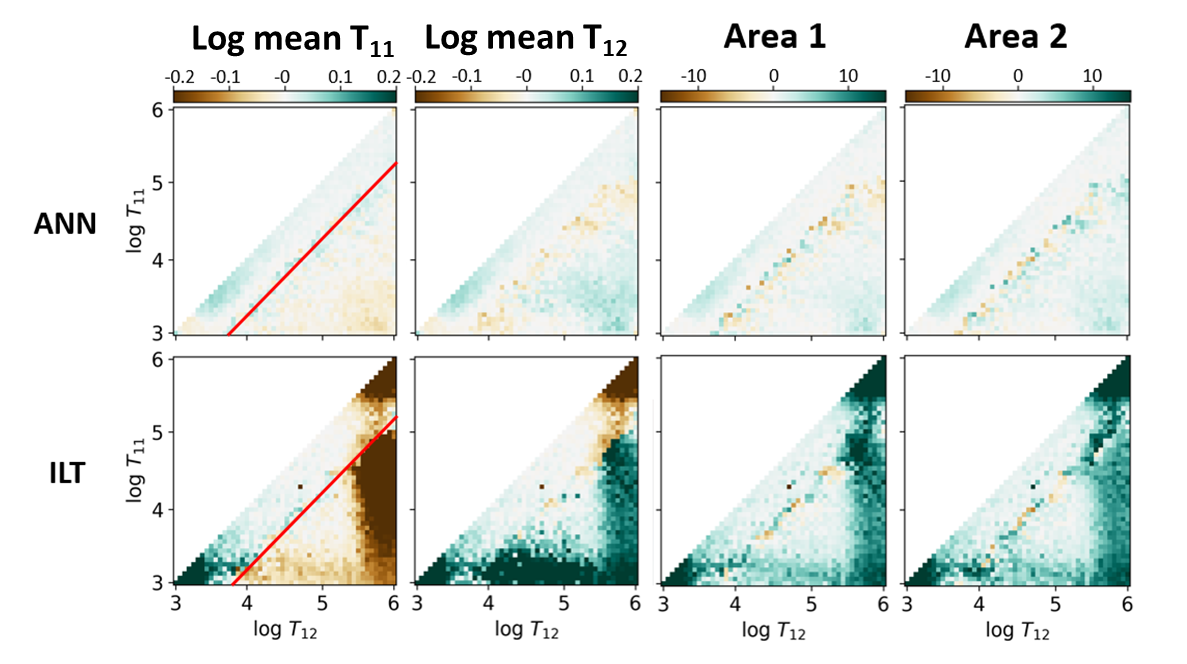
Fig. 2. Error
maps of simulated two-peak T1 distributions with 8 inversion time points and varying peak positions (200 SNR). The horizontal and vertical axes are the log mean values of the larger T1 and smaller T1 peaks. The diagonal line represents two overlapping peaks. The red line is the resolution limit beyond
which only one peak was determined.
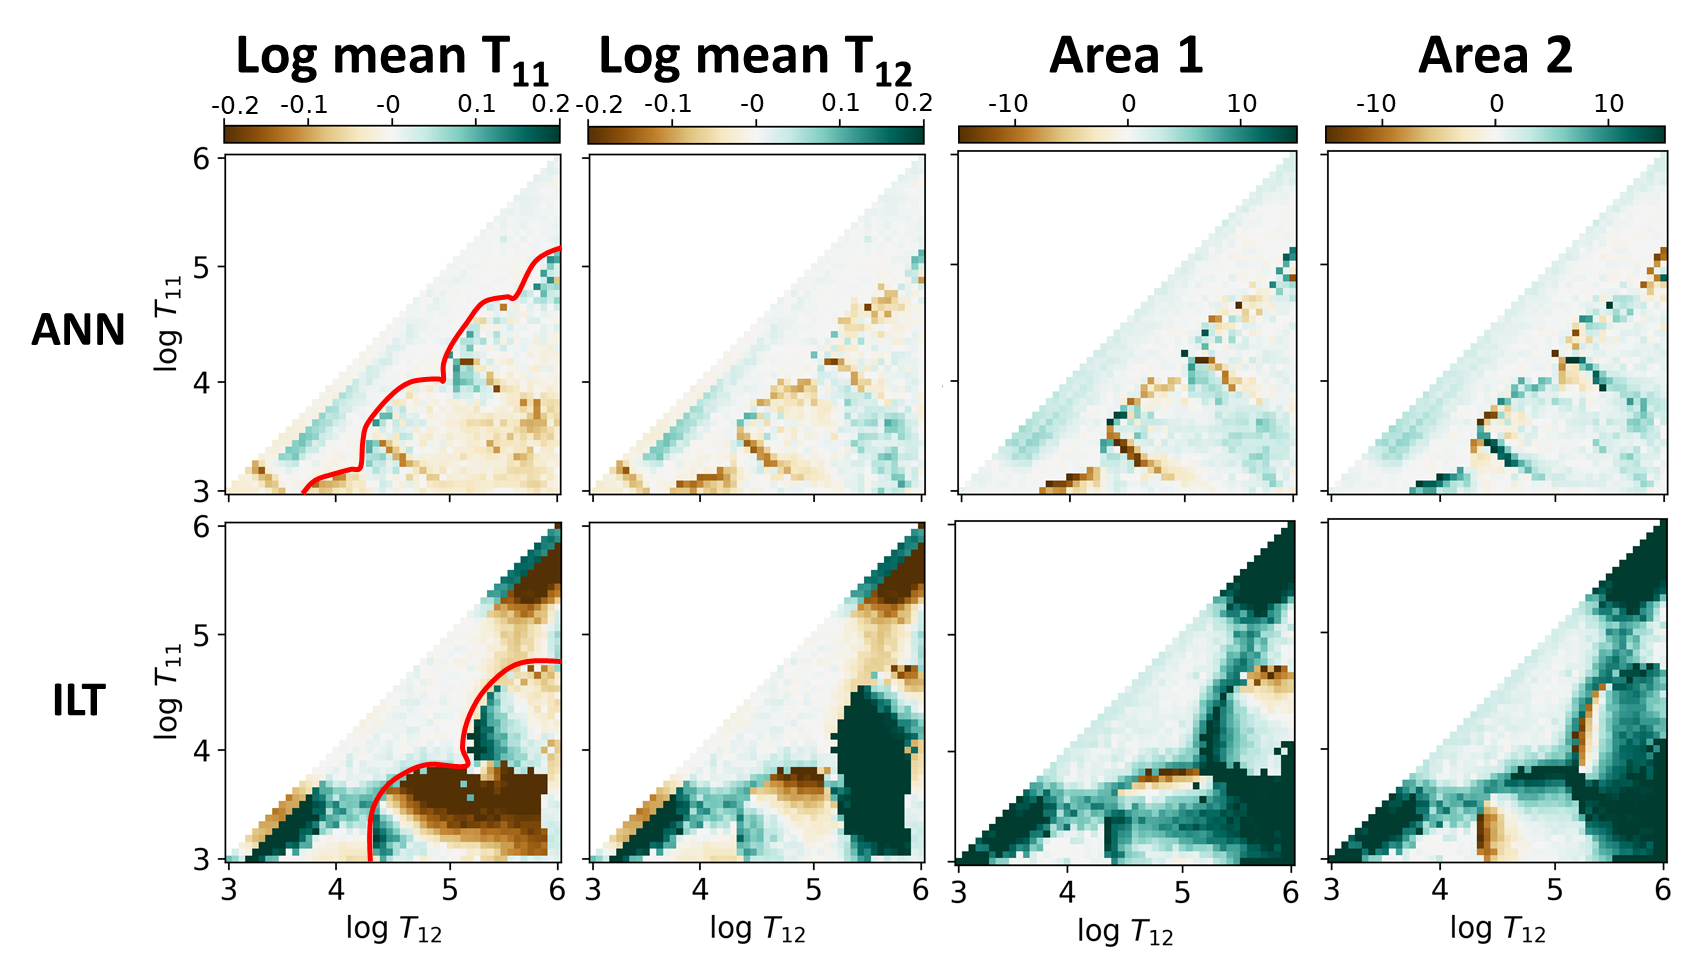
Fig. 3. Error
maps of simulated two-peak T1 spectra with 5 inversion time points. All the other parameters are the same as in Fig. 2. The performance of both methods decreased as evidenced by the larger error values. ANN largely outperformed ILT.
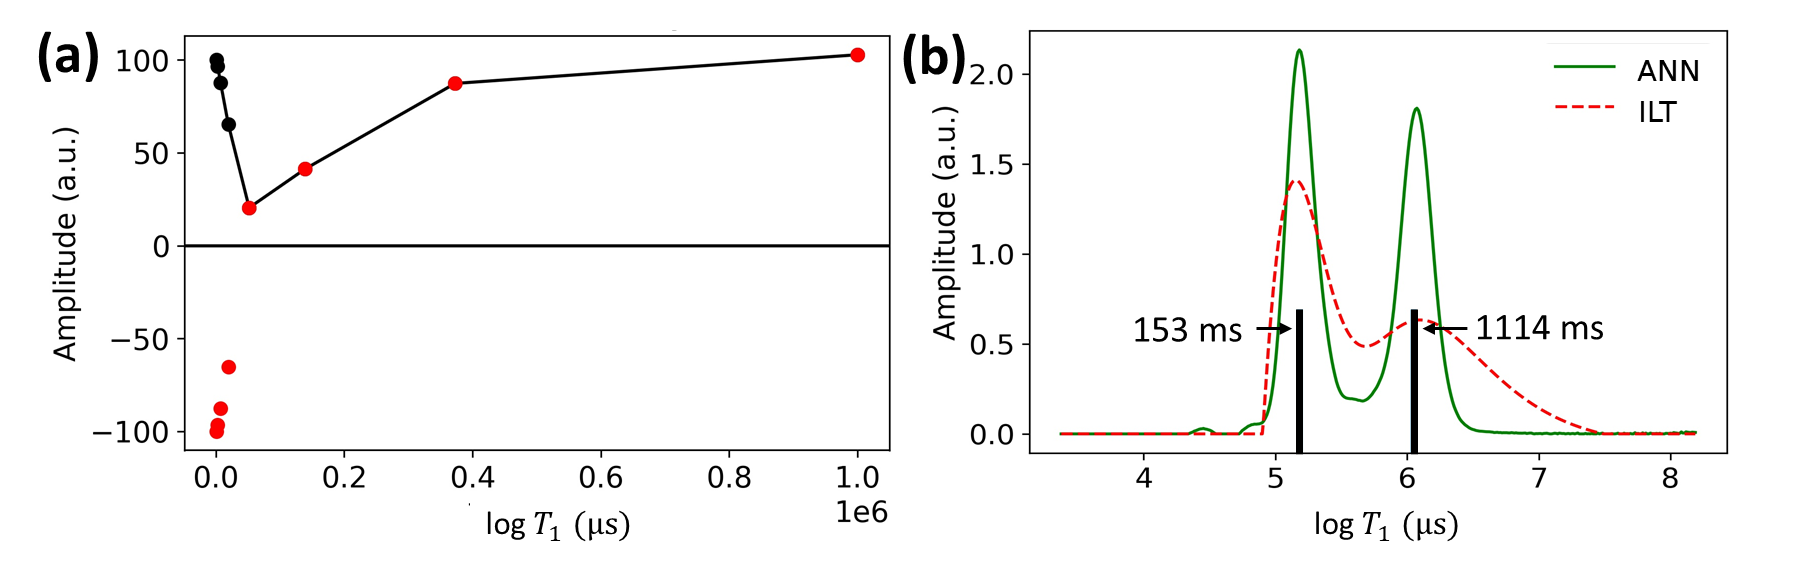
Fig. 4. (a) The experimental signal from an inversion recovery measurement on a phantom with two T1 components (153 ms and 1114 ms) of equal quantity. The phase corrected
data in red was used for ILT and the magnitude data in black was processed with ANN. (b) The corresponding T1 spectra from ANN in green and ILT in dashed red. The black bars show the true T1 values. The error of large T1 log mean value (peak position) was 70% for ILT and less than 10% in ANN.
DOI: https://doi.org/10.58530/2023/1620