1618
Feasibility of Using Deep Learning to Reduce Bias in Quantitative Values: A Study Based on fast Multidynamic Mutiecho Imaging1School of Biological Science and Medical Engineering, Beihang University, Beijing, China, 2Department of Radiology, Beijing Friendship Hospital, Capital Medical University, Beijing, China, 3Department of Medical Engineering, Beijing Friendship Hospital, Capital Medical University, Beijing, China, 4Philips Healthcare, Beijing, China, 5Peking university Academy for Advanced Interdisciplinary Studies, Beijing, China
Synopsis
Keywords: Quantitative Imaging, Machine Learning/Artificial Intelligence
Rapid quantitative magnetic resonance imaging (qMRI) is the trend of MR development and has essential diagnostic value. However, reducing acquisition time will come at the expense of image quality and will also affect the accuracy of quantitative values. Here we propose a method for reconstructing fast low-resolution qMRI images using deep learning, aiming to improve image quality while reducing bias in quantitative values. The research results show that after deep learning, the image quality is comparable to that of conventional high-resolution scanning images, and quantitative values are also more stable.Introduction
Synthetic magnetic resonance imaging (synthetic MRI), which can simultaneously map multiple parameters including T1, T2, and proton density in a single acquisition has gained widespread interest 1,2. Among them, multidynamic multiecho (MDME) sequence is a commonly used synthetic MRI sequence 3,4. According to the quantitative data, various contrast images can be created with certain software by manipulating scan parameters. It shows promising results in normal brain development and patients with various brain diseases, such as multiple sclerosis (MS) and brain tumors 5,6. This non-invasive measurement of tissue microstructural changes is considered crucial for clinical diagnosis and brain research. In order to better promote this technology in the clinical practice, faster scans are required. However, changing the scanning parameters to shorten the imaging time will reduce the signal-to-noise ratio of the image, thereby affecting the quantitative value 7. We also found corresponding results in our previous work. Among them, the difference in T1 value is more significant. Improving the signal-to-noise ratio (SNR) of images and reducing bias in quantitative values are critical for fast synthetic MRI. This study will utilize GAN to explore their feasibility in the optimization of quantitative synthetic MRI.Methods
MR Datasets154 healthy volunteers were recruited and had two synthetic MRI scans using a SIGNA Pioneer 3.0T MRI scanner (GE Helthcare, Maukesha, Wis): routine scan and fast scan (low-resolution, LR). Most scan parameters remain the same between two scans: TR = 4000ms, TE1 = 18ms, TE2 = 90ms, TI = 28.2ms, thickness = 5mm, 24 slices. Matrix and acceleration factors differ between routine scan and fast scan (320 × 256 versus 192 × 128; 2 versus 3, respectively). The final scan times for routine scan and fast can were 4min55sec and 1min52sec, respectively. After MRI scanning, the raw DICOM data were loaded into Synthetic MRI software (SyntheticMR AB, version 8.0.4, Linköping, Sweden), and T1 maps of two scans were retrieved.
Network Architectures
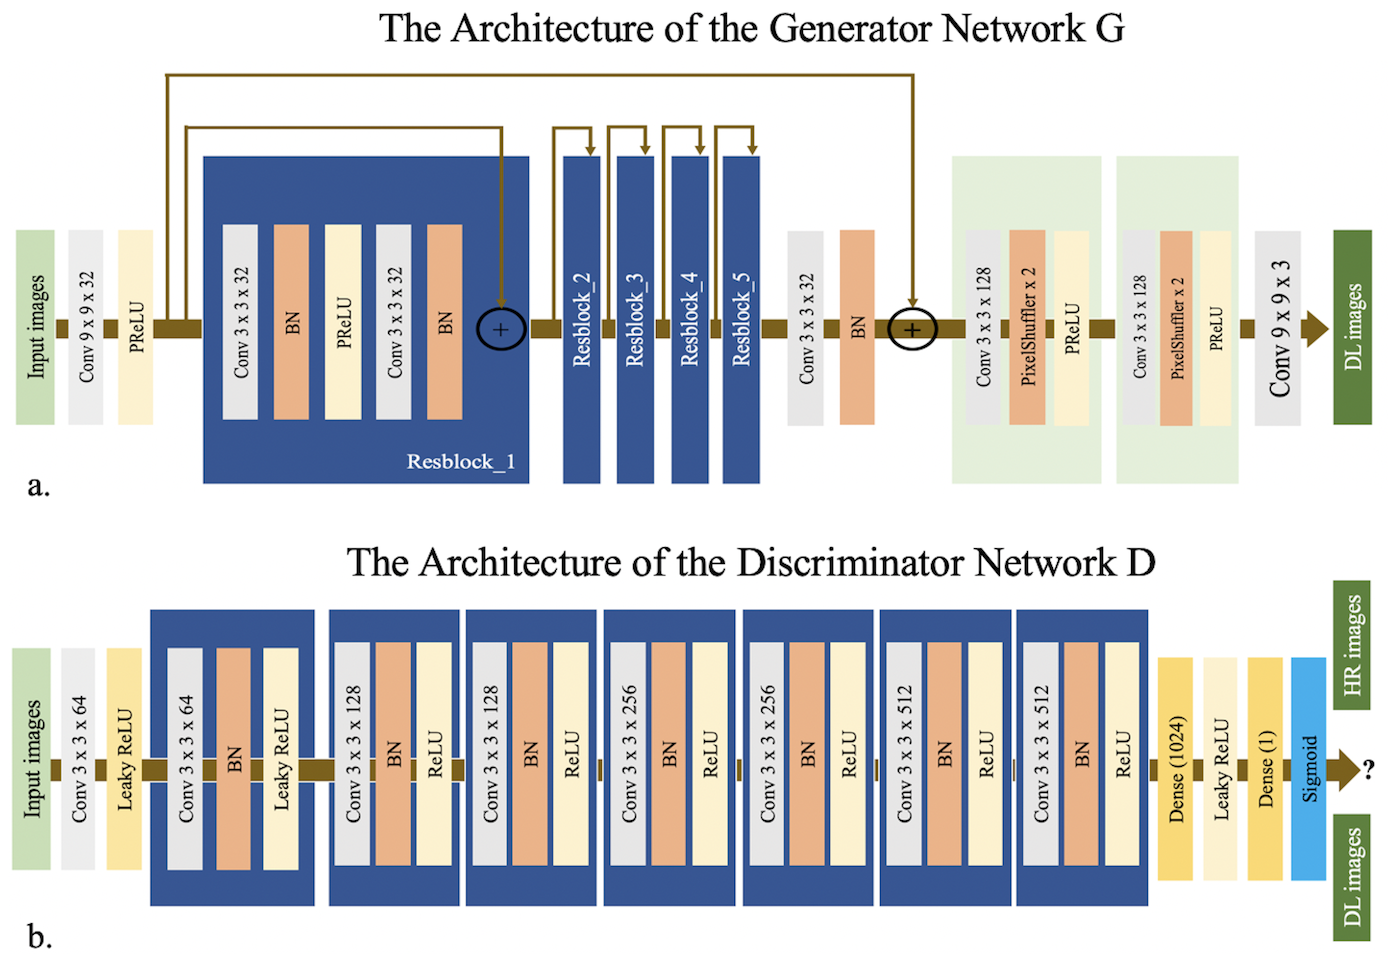
The SRGAN architecture is based on the GAN and uses VGG to optimize the loss function 8. It consists of a generator network, G, a discriminator network, D, and the VGG network. The network structure is shown in Figure 1. Cross-entropy loss was used in this study. T1 Maps from routine scan are taken as the ground truth high-resolution (HR) images, while T1 images from fast scan are low-resolution (LR) images. The SRGAN network was trained on 140 subjects on a graphic processor (Tesla V100, NVIDIA, Santa Clara, CA, USA) for 1k epochs with a batch size of 8 using the TensorFlow framework. The parameters of the network were optimized using the Adam optimizer via stochastic gradient descent with a learning rate of 1e-3. Images from the remaining 14 subjects were used for testing.
Evaluation and Statistical Analysis
Peak Signal to Noise Ratio (PSNR) and Structural Similarity Index (SSIM) were calculated for image quality assessment. Image J software 9 was used to delineate ROIs on HR, LR and deep learning images (DL) and obtain brain regional T1 quantitative values. Two regions — lenticular nucleus (LN) and deep white matter (DWM) — were selected as region of interest (ROI). The mean T1 value within the ROI was recorded. The differences of T1 values between two groups (HR vs. LR and HR vs. DL) were assessed using Wilcoxon signed rank test (paired) under GraphPad Prism (Version 9.1.1, GraphPad Software, LLC). The significance level is set to P < 0.05.
Results and Discussions
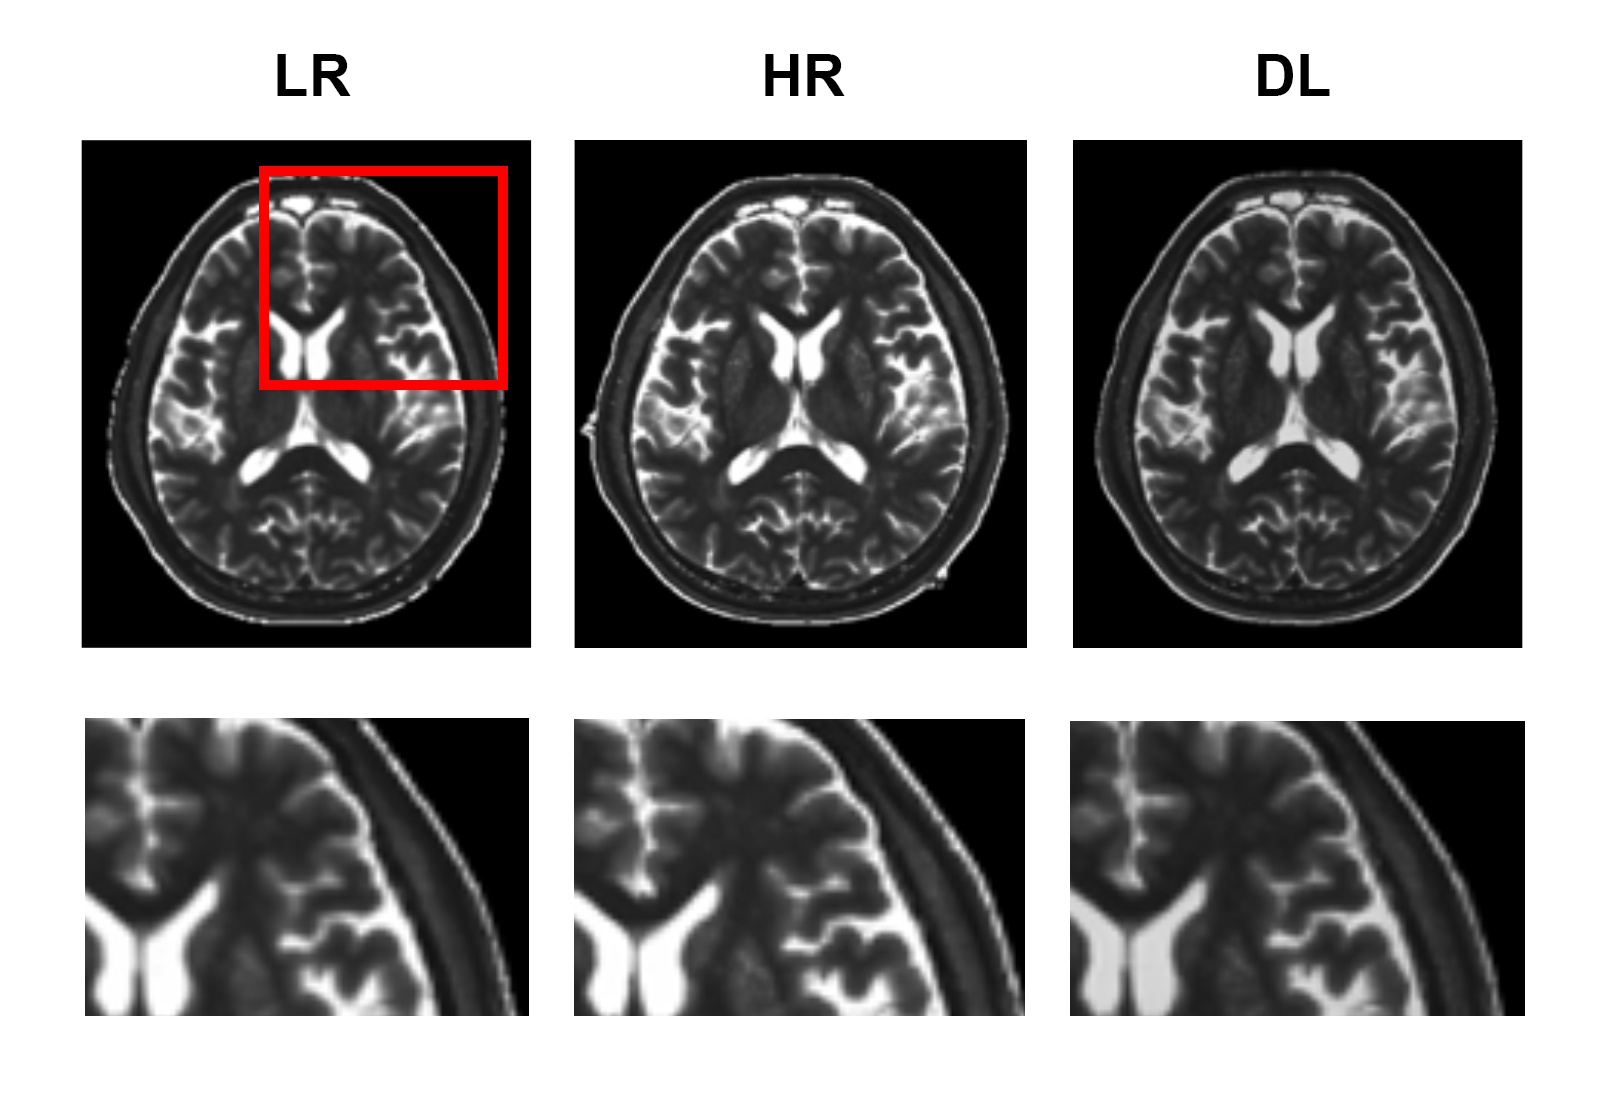
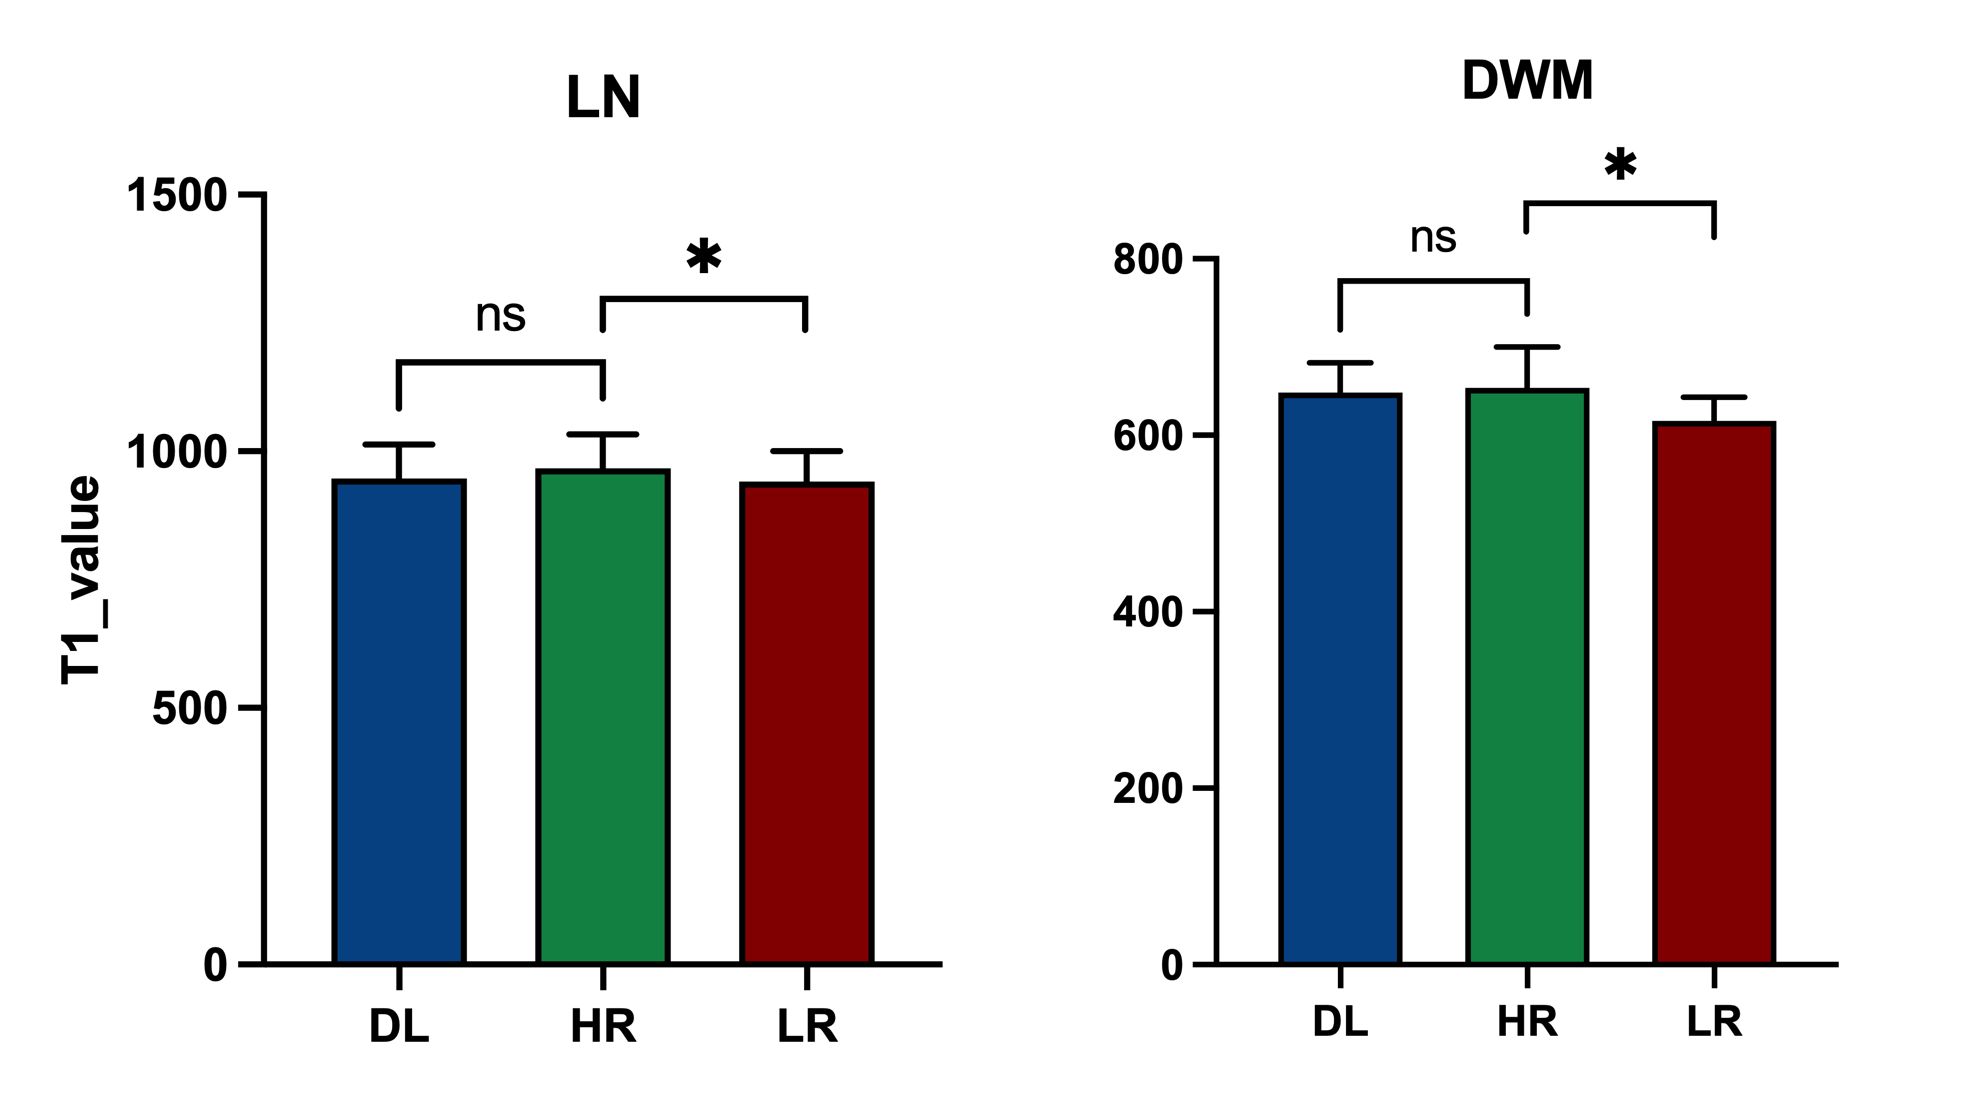
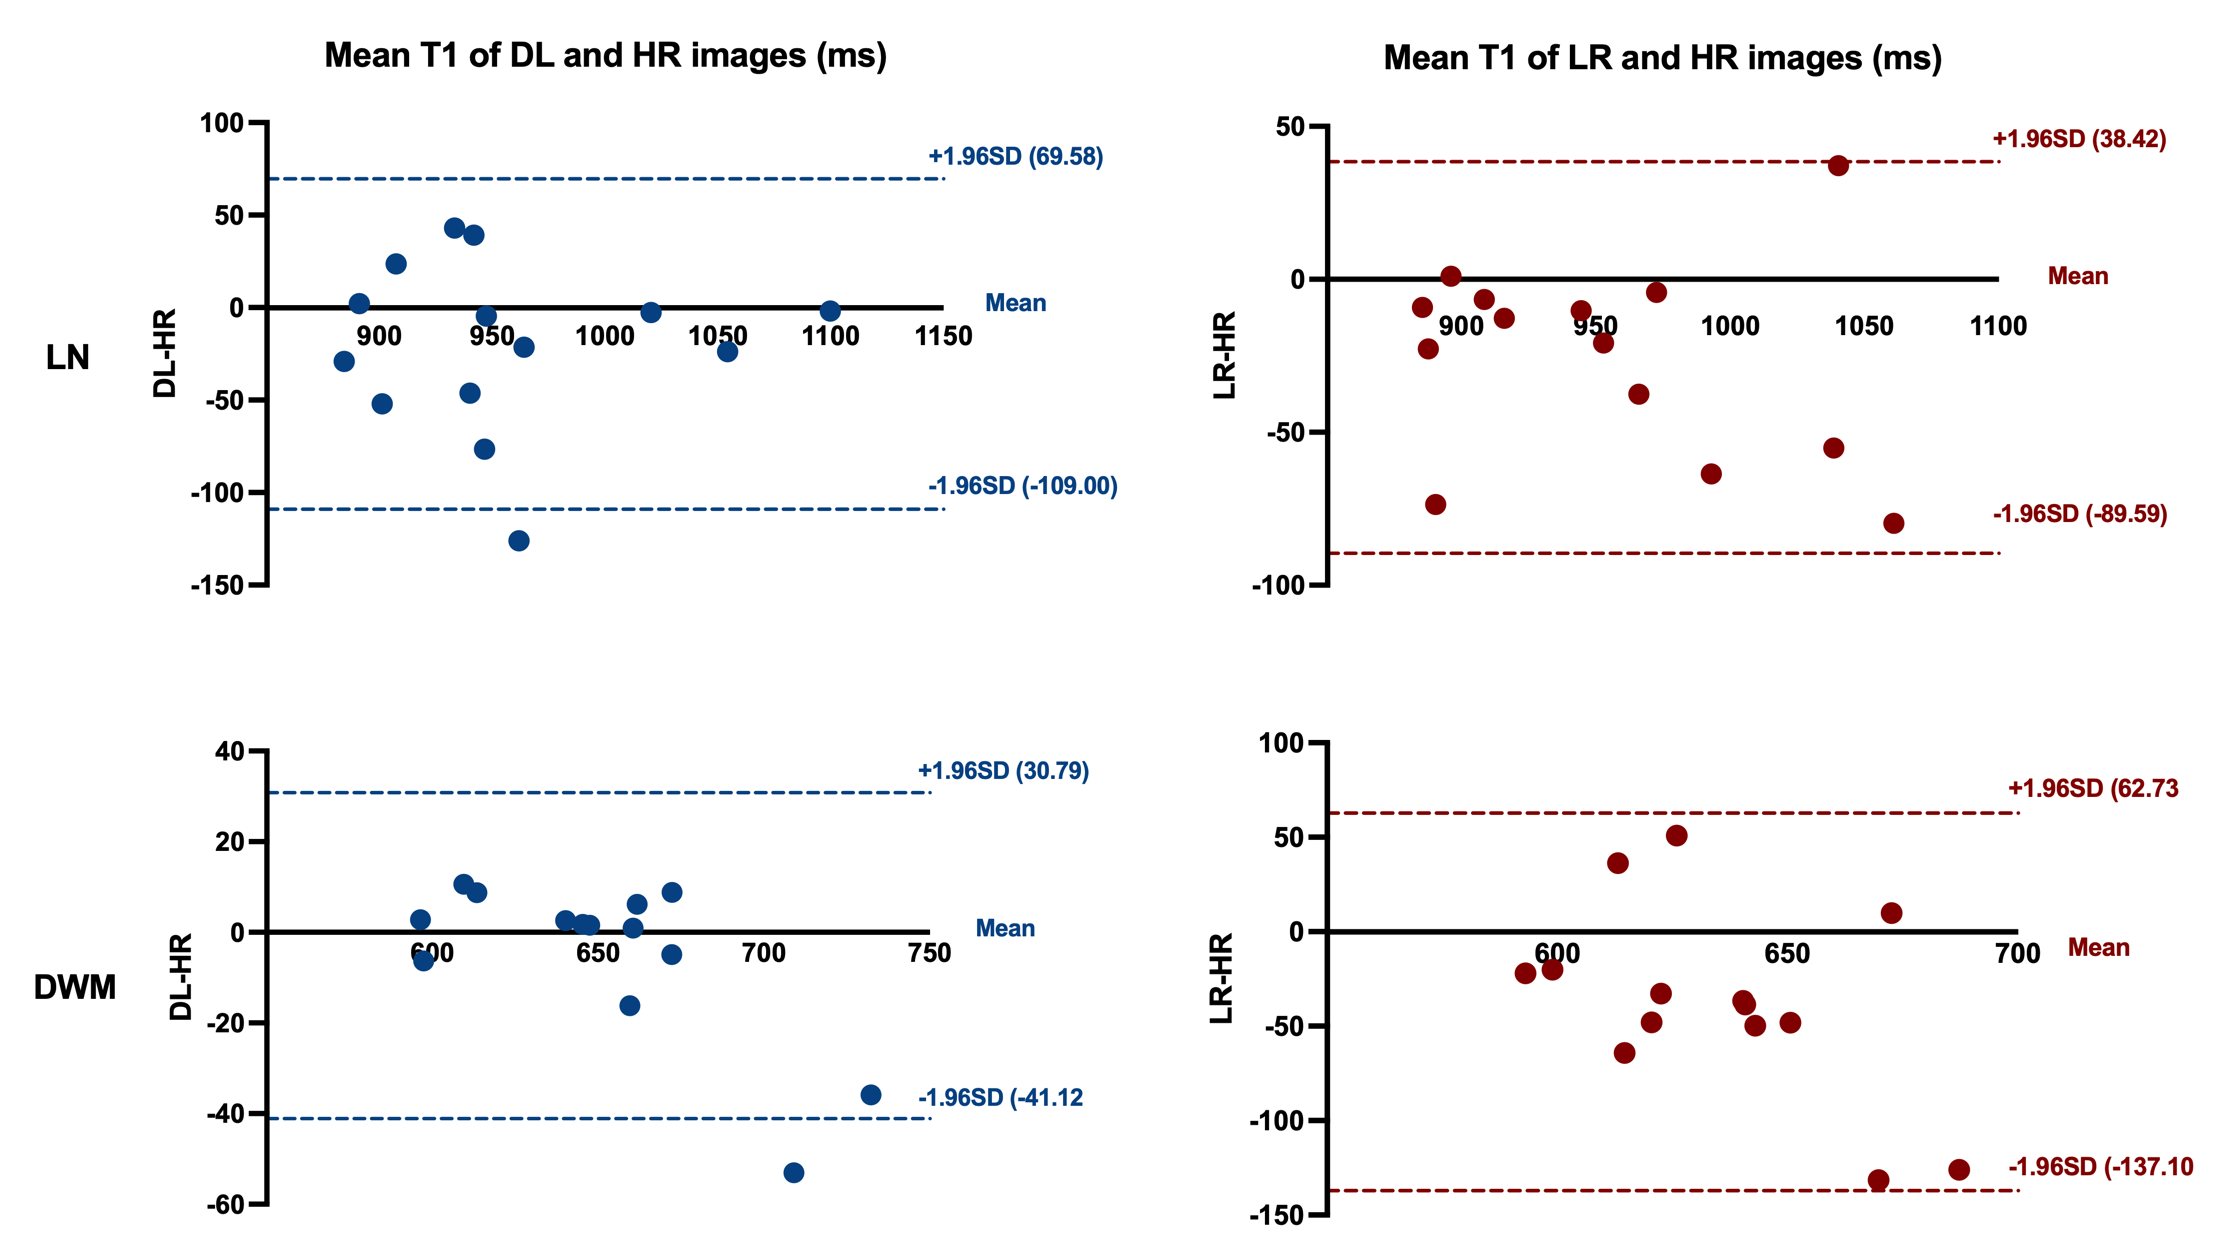
Experimental results show that the quality of T1 maps is significantly improved after deep learning, especially after using adversarial training (Figure 2), the images trained with GAN avoid the marginal haziness while the images trained without discriminator lost sharp details. The results of PSNR and SSIM are shown that the image quality after using the adversarial network is comparable to the HR image (22.62 ± 2.49, and 0.83 ± 0.09, respectively). Figure 3 shows the results of ROI analysis of T1 values. The mean LN’ T1 value for DL images, HR images and LR images were 946.77ms, 966.50ms and 940.91ms, respectively. The mean DWM’ T1 value for DL images, HR images and LR images were 648.61ms, 653.77ms and 616.57ms, respectively. The T1 values of LN in LR images were significantly different from HR images (p = 0.005), but there was no difference between DL images and HR images (p = 0.11). There are significant differences between LR images and HR images in DWM (p = 0.005), while no significant difference was found between DL images and HR images (p > 0.99). Most of the values in the Bland-Altman plots fall within the 95% prediction limits, indicating that T1values after deep learning are in good agreement with HR images (Figure 4).Conclusions
By using the deep learning method, the image quality of synthetic MRI can be improved. The reconstructed quantitative image has a higher quality and better contrast. More importantly, the quantitative value has no significant difference with the conventional scan value, which can be used in clinical diagnosis. It is feasible to use deep learning methods to improve the quality of images and reduce the bias of quantitative values, which is helpful to achieve accurate quantification under fast acquisition conditions.Acknowledgements
This work was supported by Beijing Scholar 2015 (Zhenchang Wang).References
1. Su, S. et al. Quantitative synthetic MRI reveals grey matter abnormalities in children with drug-naïve attention-deficit/hyperactivity disorder. Brain Imaging Behav. 16, 406–414 (2022).
2. Jiang, Y. et al. Quantitative synthetic MRI for evaluation of the lumbar intervertebral disk degeneration in patients with chronic low back pain. Eur. J. Radiol. 124, (2020).
3. Warntjes, J. B. M., Dahlqvist, O. & Lundberg, P. Novel method for rapid, simultaneous T1, T2*, and proton density quantification. Magn. Reson. Med. 57, 528–537 (2007).
4. Warntjes, J. B. M., Dahlqvist Leinhard, O., West, J. & Lundberg, P. Rapid magnetic resonance quantification on the brain: Optimization for clinical usage. Magn. Reson. Med. 60, 320–329 (2008).
5. Gracien, R. M. et al. Longitudinal quantitative MRI assessment of cortical damage in multiple sclerosis: A pilot study. J. Magn. Reson. Imaging 46, 1485–1490 (2017).
6. Kang, K. M. et al. Application of synthetic MRI for direct measurement of magnetic resonance relaxation time and tumor volume at multiple time points after contrast administration: Preliminary results in patients with brain metastasis. Korean J. Radiol. 19, 783–791 (2018).
7. Hwang, K. P. & Fujita, S. Synthetic MR: Physical principles, clinical implementation, and new developments. Med. Phys. 49, 4861–4874 (2022).
8. Ledig, C. et al. Photo-Realistic Single Image Super-Resolution Using a Generative Adversarial Network. Cvpr 2, 4 (2017).
9. Schneider, C. A., Rasband, W. S. & Eliceiri, K. W. NIH Image to ImageJ: 25 years of Image Analysis. Fundam. Digit. Imaging Med. 9, 671–675 (2012).
Figures