1615
Over-estimation of T2 with radial sampling: Identification, understanding and strategies to mitigate the bias.1Centre de Résonance Magnétique et Systèmes Biologiques UMR5536 CNRS/University of Bordeaux, Bordeaux, France, 2Wellcome Centre for Human Neuroimagin, UCL Queen Square, Institute of Neurology, University College of London, London, United Kingdom
Synopsis
Keywords: Quantitative Imaging, Relaxometry, radial sampling
Quantitative MRI protocols can benefit from radial trajectory sampling to reduce the acquisition time. However we identified a bias in T2 relaxometry studies conducted with radial imaging. After in-depth analysis aiming at further our understanding of the underlying mechanisms, we propose some guidelines to mitigate this bias. The error depends on the range of T2 present in the object of interest and its geometry, the number of spokes and the trajectory of the sequence. Parallel imaging and compressed sensing help reducing the bias.
Introduction
Radial sampling of the k-space offers multiple advantages for MRI applications, including improved robustness to motion compared to standard Cartesian sampling and acceleration capabilities through high undersampling1. Quantitative MRI (qMRI), like T2 relaxometry, which often suffers from long acquisition time can highly benefit from this strategy2–4. However qMRI relies on robust and controlled acquisition for a precise and accurate parameter estimation. We demonstrate here that radial sampling can introduce a substantial bias in qMRI, and particularly T2 mapping. We identify some conditions that might be unfavourable and propose solutions to mitigate the bias.Methods
Numerical simulationsTwo numerical phantoms were created:
- 8 tubes embedded in a larger cylinder. T2 inside the tubes was varied from 60 to 80ms. Two conditions were tested: with or without long T2 background (1s).
- Brain with 3 tissue mimicking white matter(WM), gray matter(GM) and cerebrospinal fluid (CSF) with T2=60, 80 and 1000ms, respectively.
MR acquisitions
Acquisition protocol
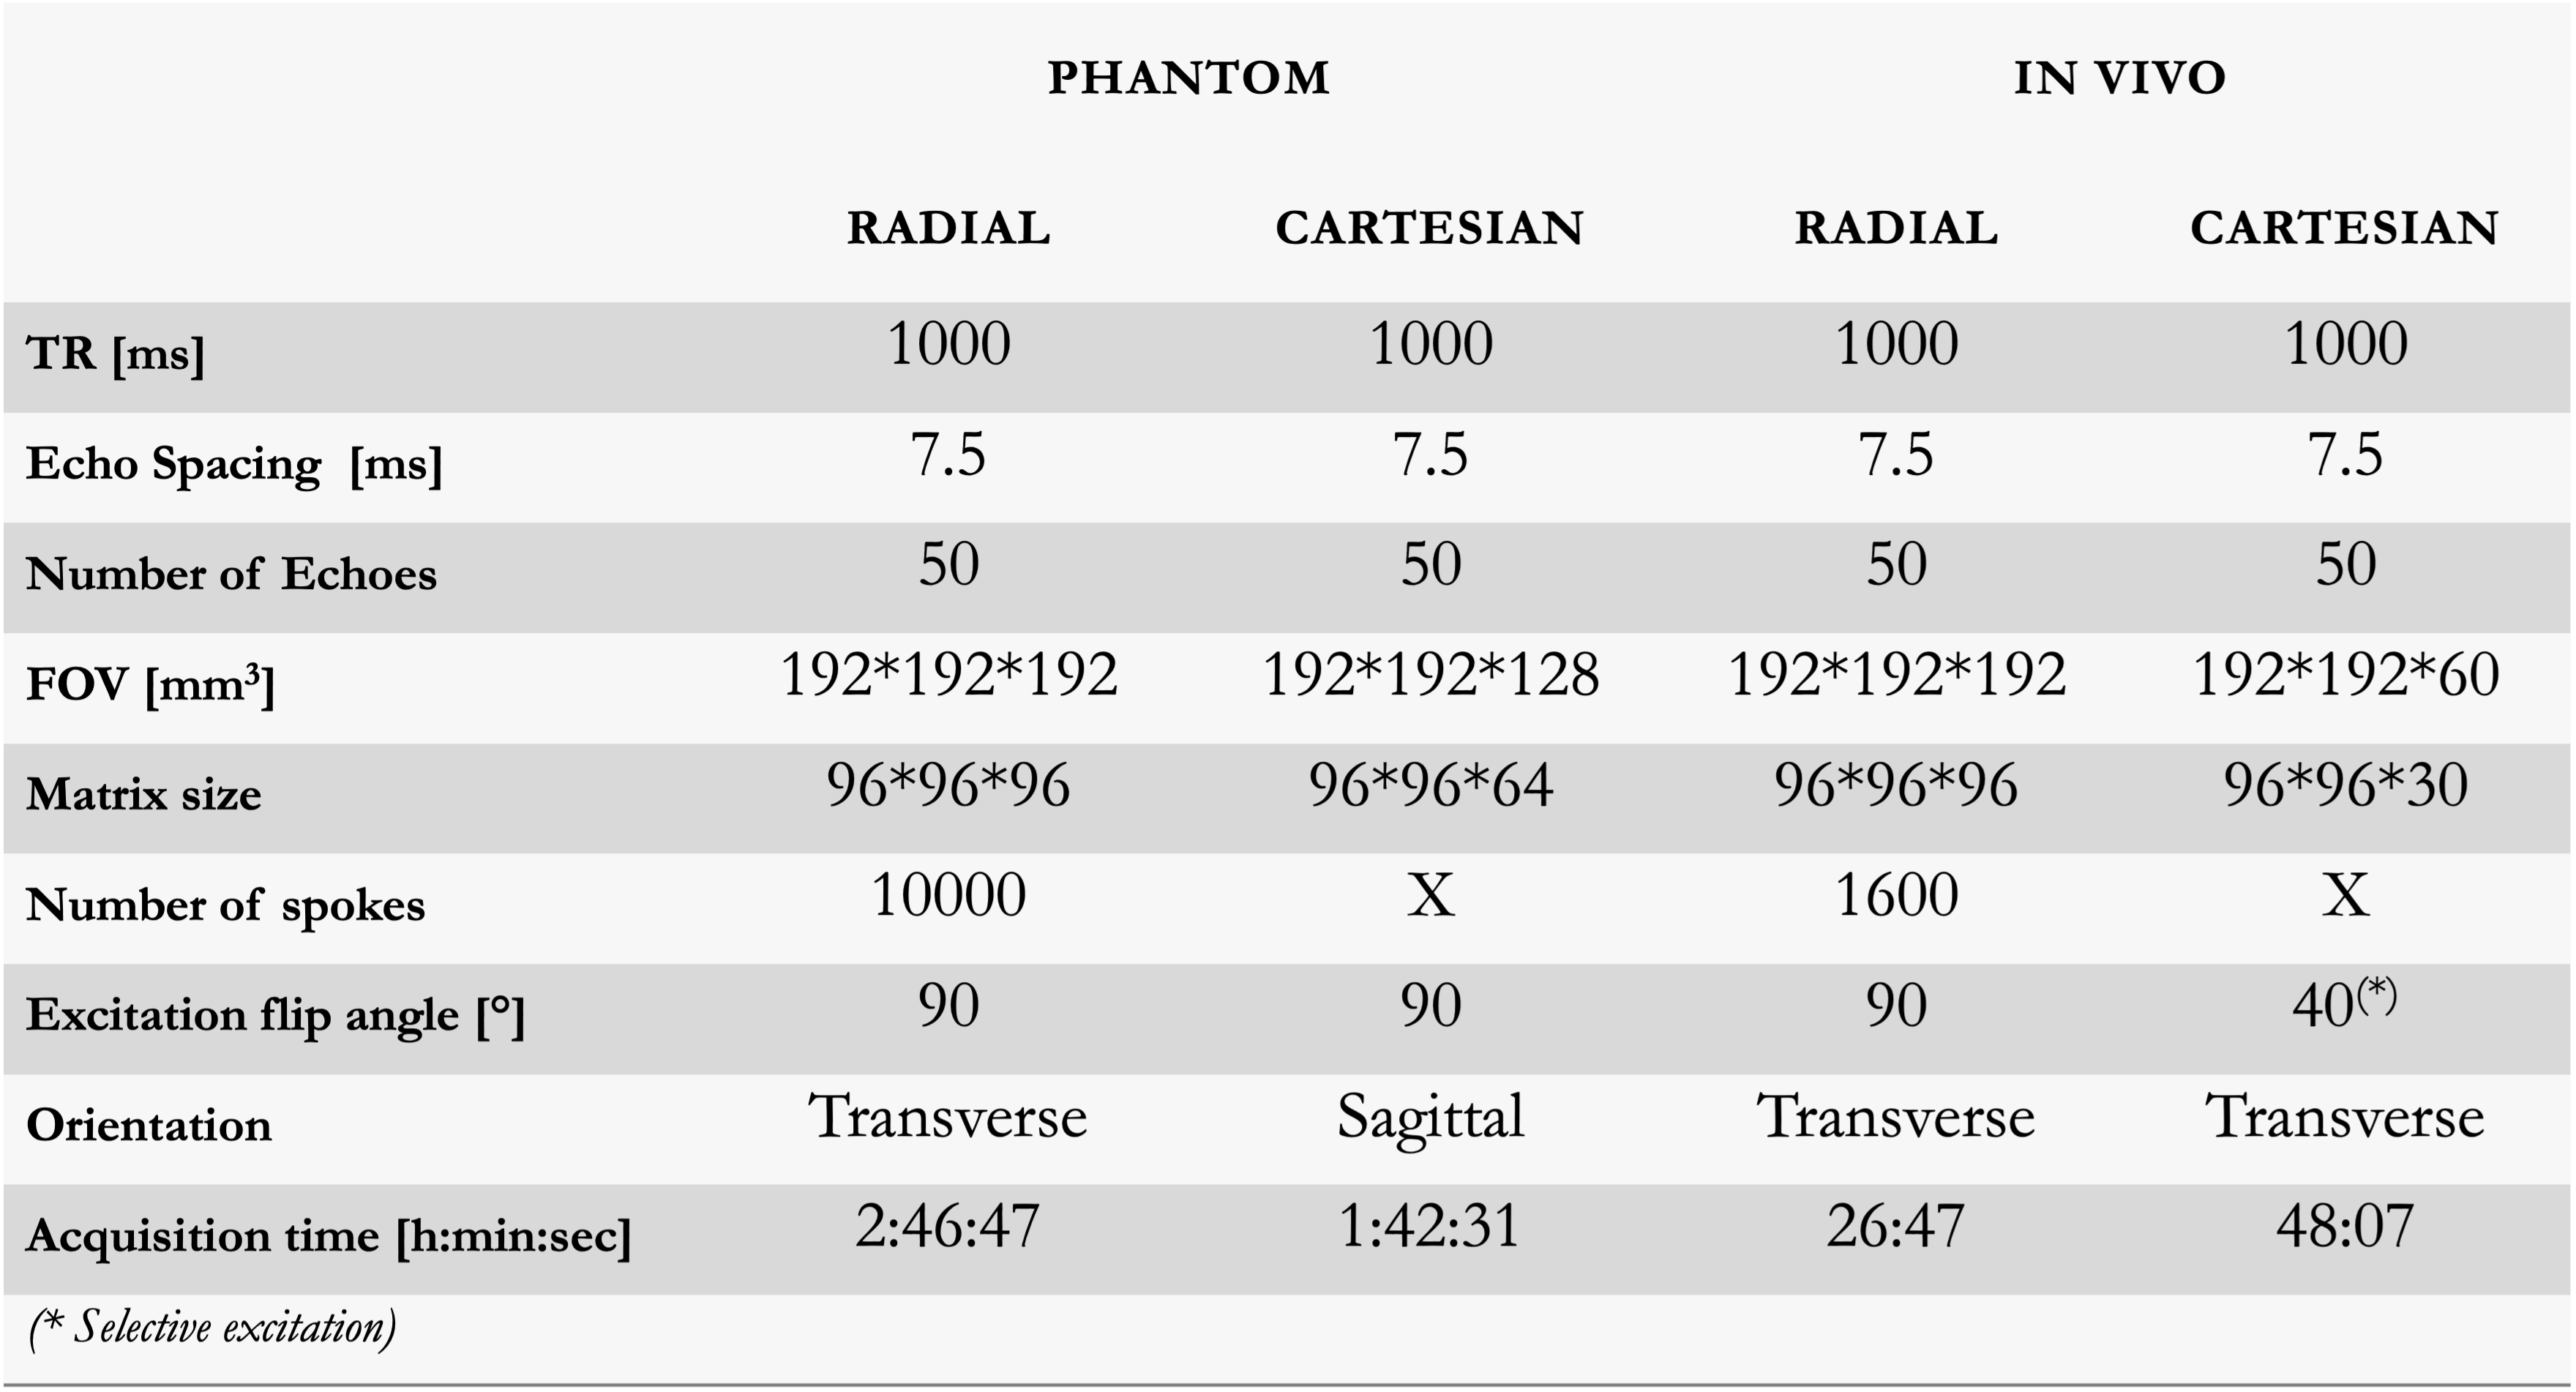
Acquisitions were performed on a 3T Siemens MRI scanner with an in-house 3D multi-echo spin-echo sequences with cartesian and radial k-space sampling. Data were obtained from a phantom made out of 8 tubes (16mmØ) filled with increasing concentrations of Gd-DOTA mixed in 1.5% agar and positioned in a commercially available phantom (MultiSample120,GoldStandardPhantoms,UK) filled with water. 3D fully sampled cartesian sampling and 3D radial sampling with 10000 spokes and variable or constant trajectory across echoes were acquired twice: with or without water surrounding the tubes.
Same sequences were applied in-vivo with reduced number of partitions or spokes (1600) to maintain reasonable scan time.
Key acquisition parameters are available in Table 1.
Reconstruction
Data were reconstructed with the BART toolbox8. Cartesian data were obtained from the inverse 3D Fourier transform while the radially sampled data obtained from the tube phantom were reconstructed with the adjoint 3D-NUFFT with DCF.
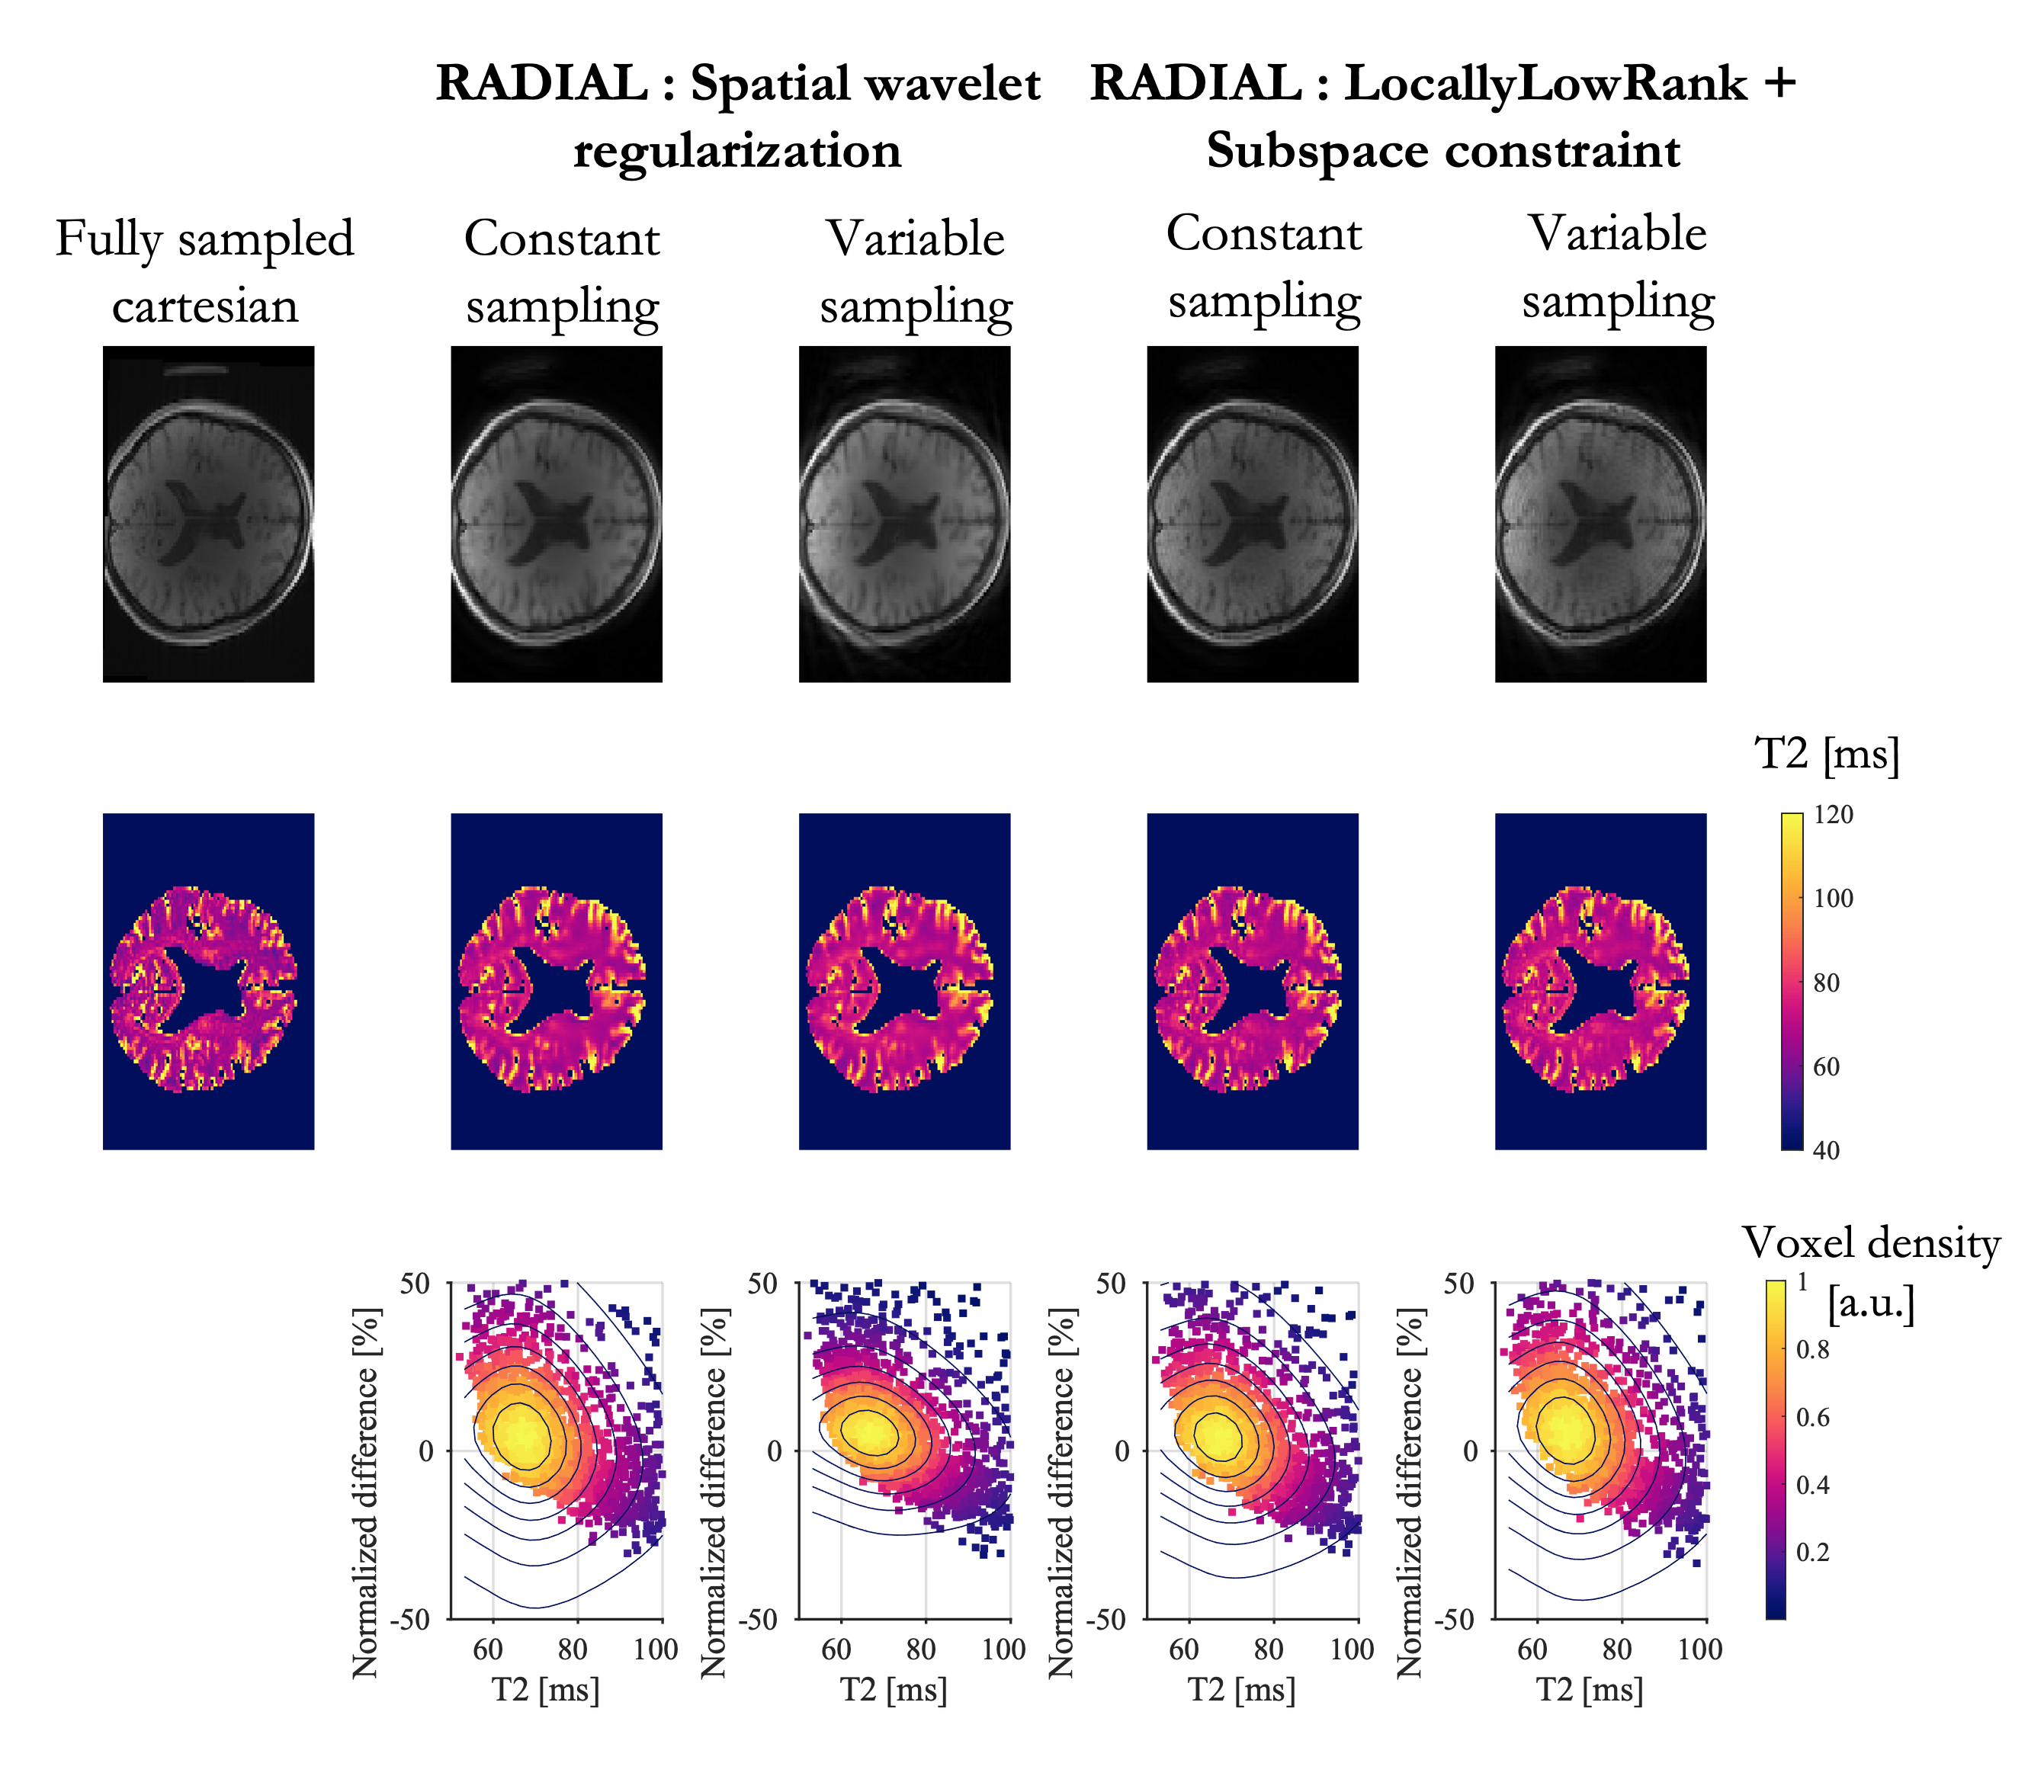
Given that in-vivo data were highly undersampled, a more advanced iterative reconstruction based on parallel imaging and wavelet-based compressed-sensing was used. To evaluate the effect of the reconstruction approach, the phantom acquisition with constant trajectory was also reconstructed with this approach.
Additionnaly, in-vivo data were also reconstructed with subspace constraints and locally low rank temporal regularization9.
Post-processing
Voxel-wise T2 was estimated with a non-linear least square approach accounting for stimulated echoes10.
Results
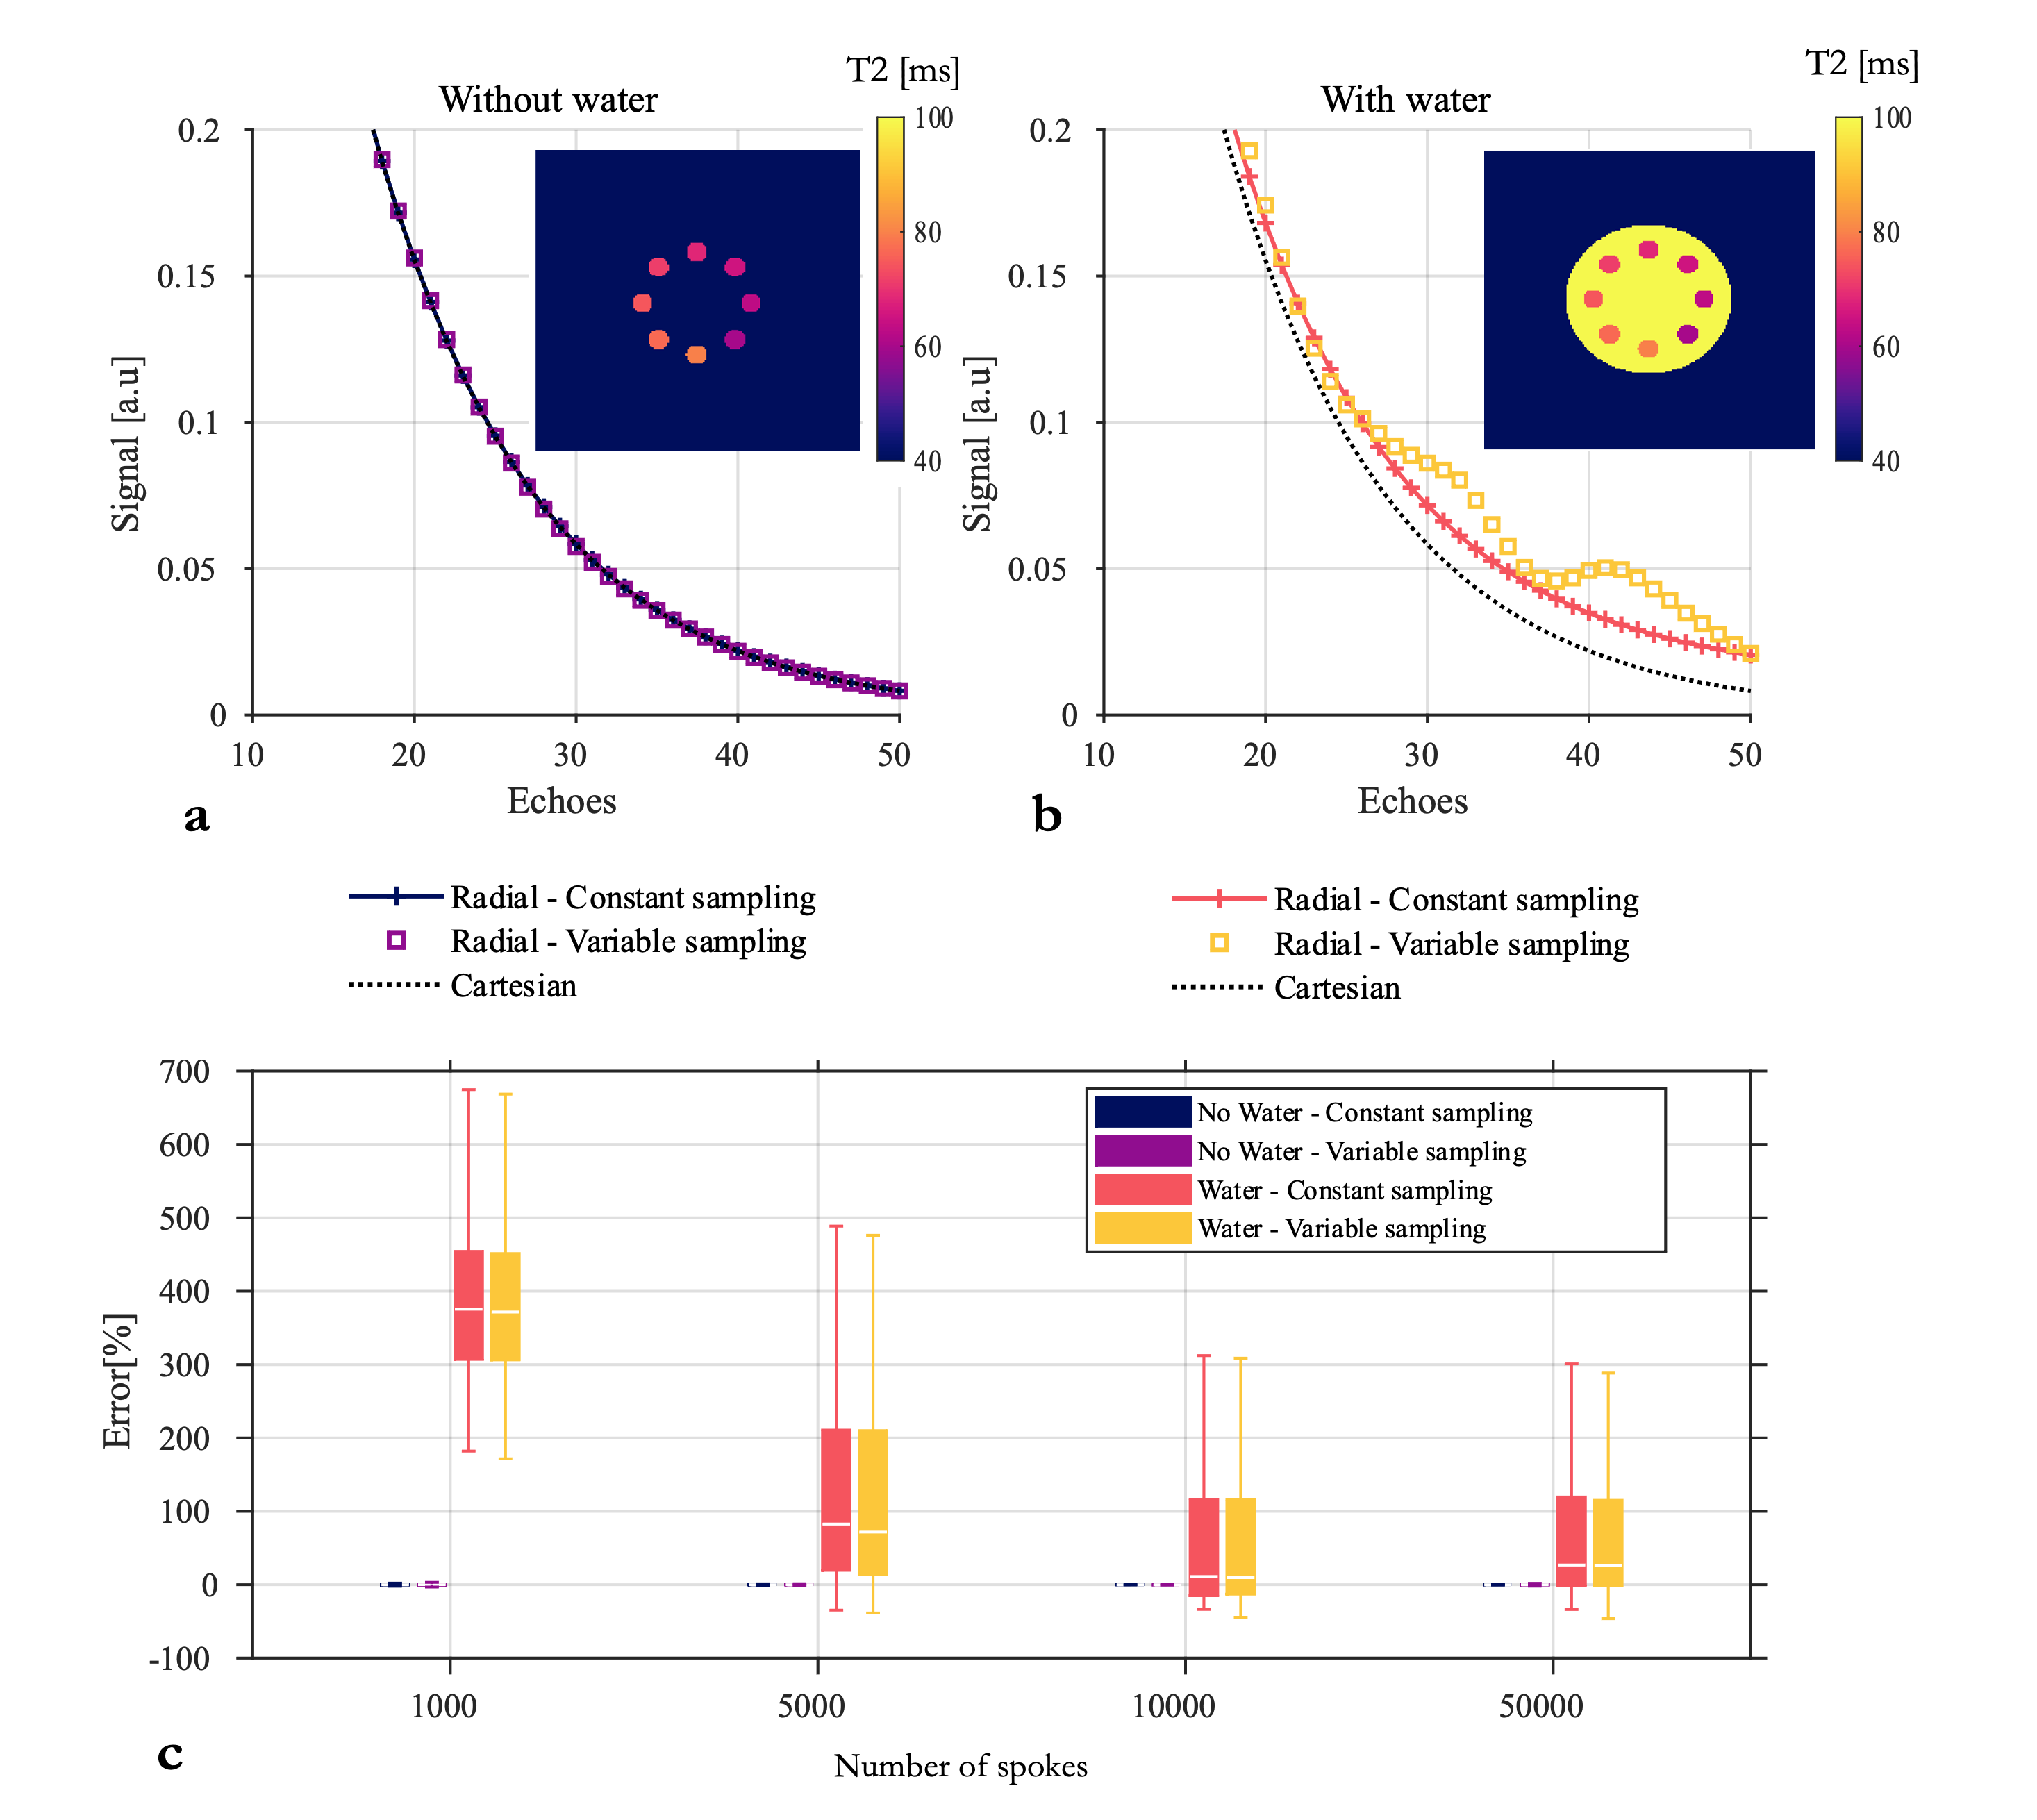
Tube phantomThe simulated signal decay inside a tube (Fig1.a-b) was indeed affected by the presence of the water, that resulted in the overestimation of T2 (Fig1c). Both radial trajectories resulted in a bias in T2, still present with 50000 spokes although significantly reduced.
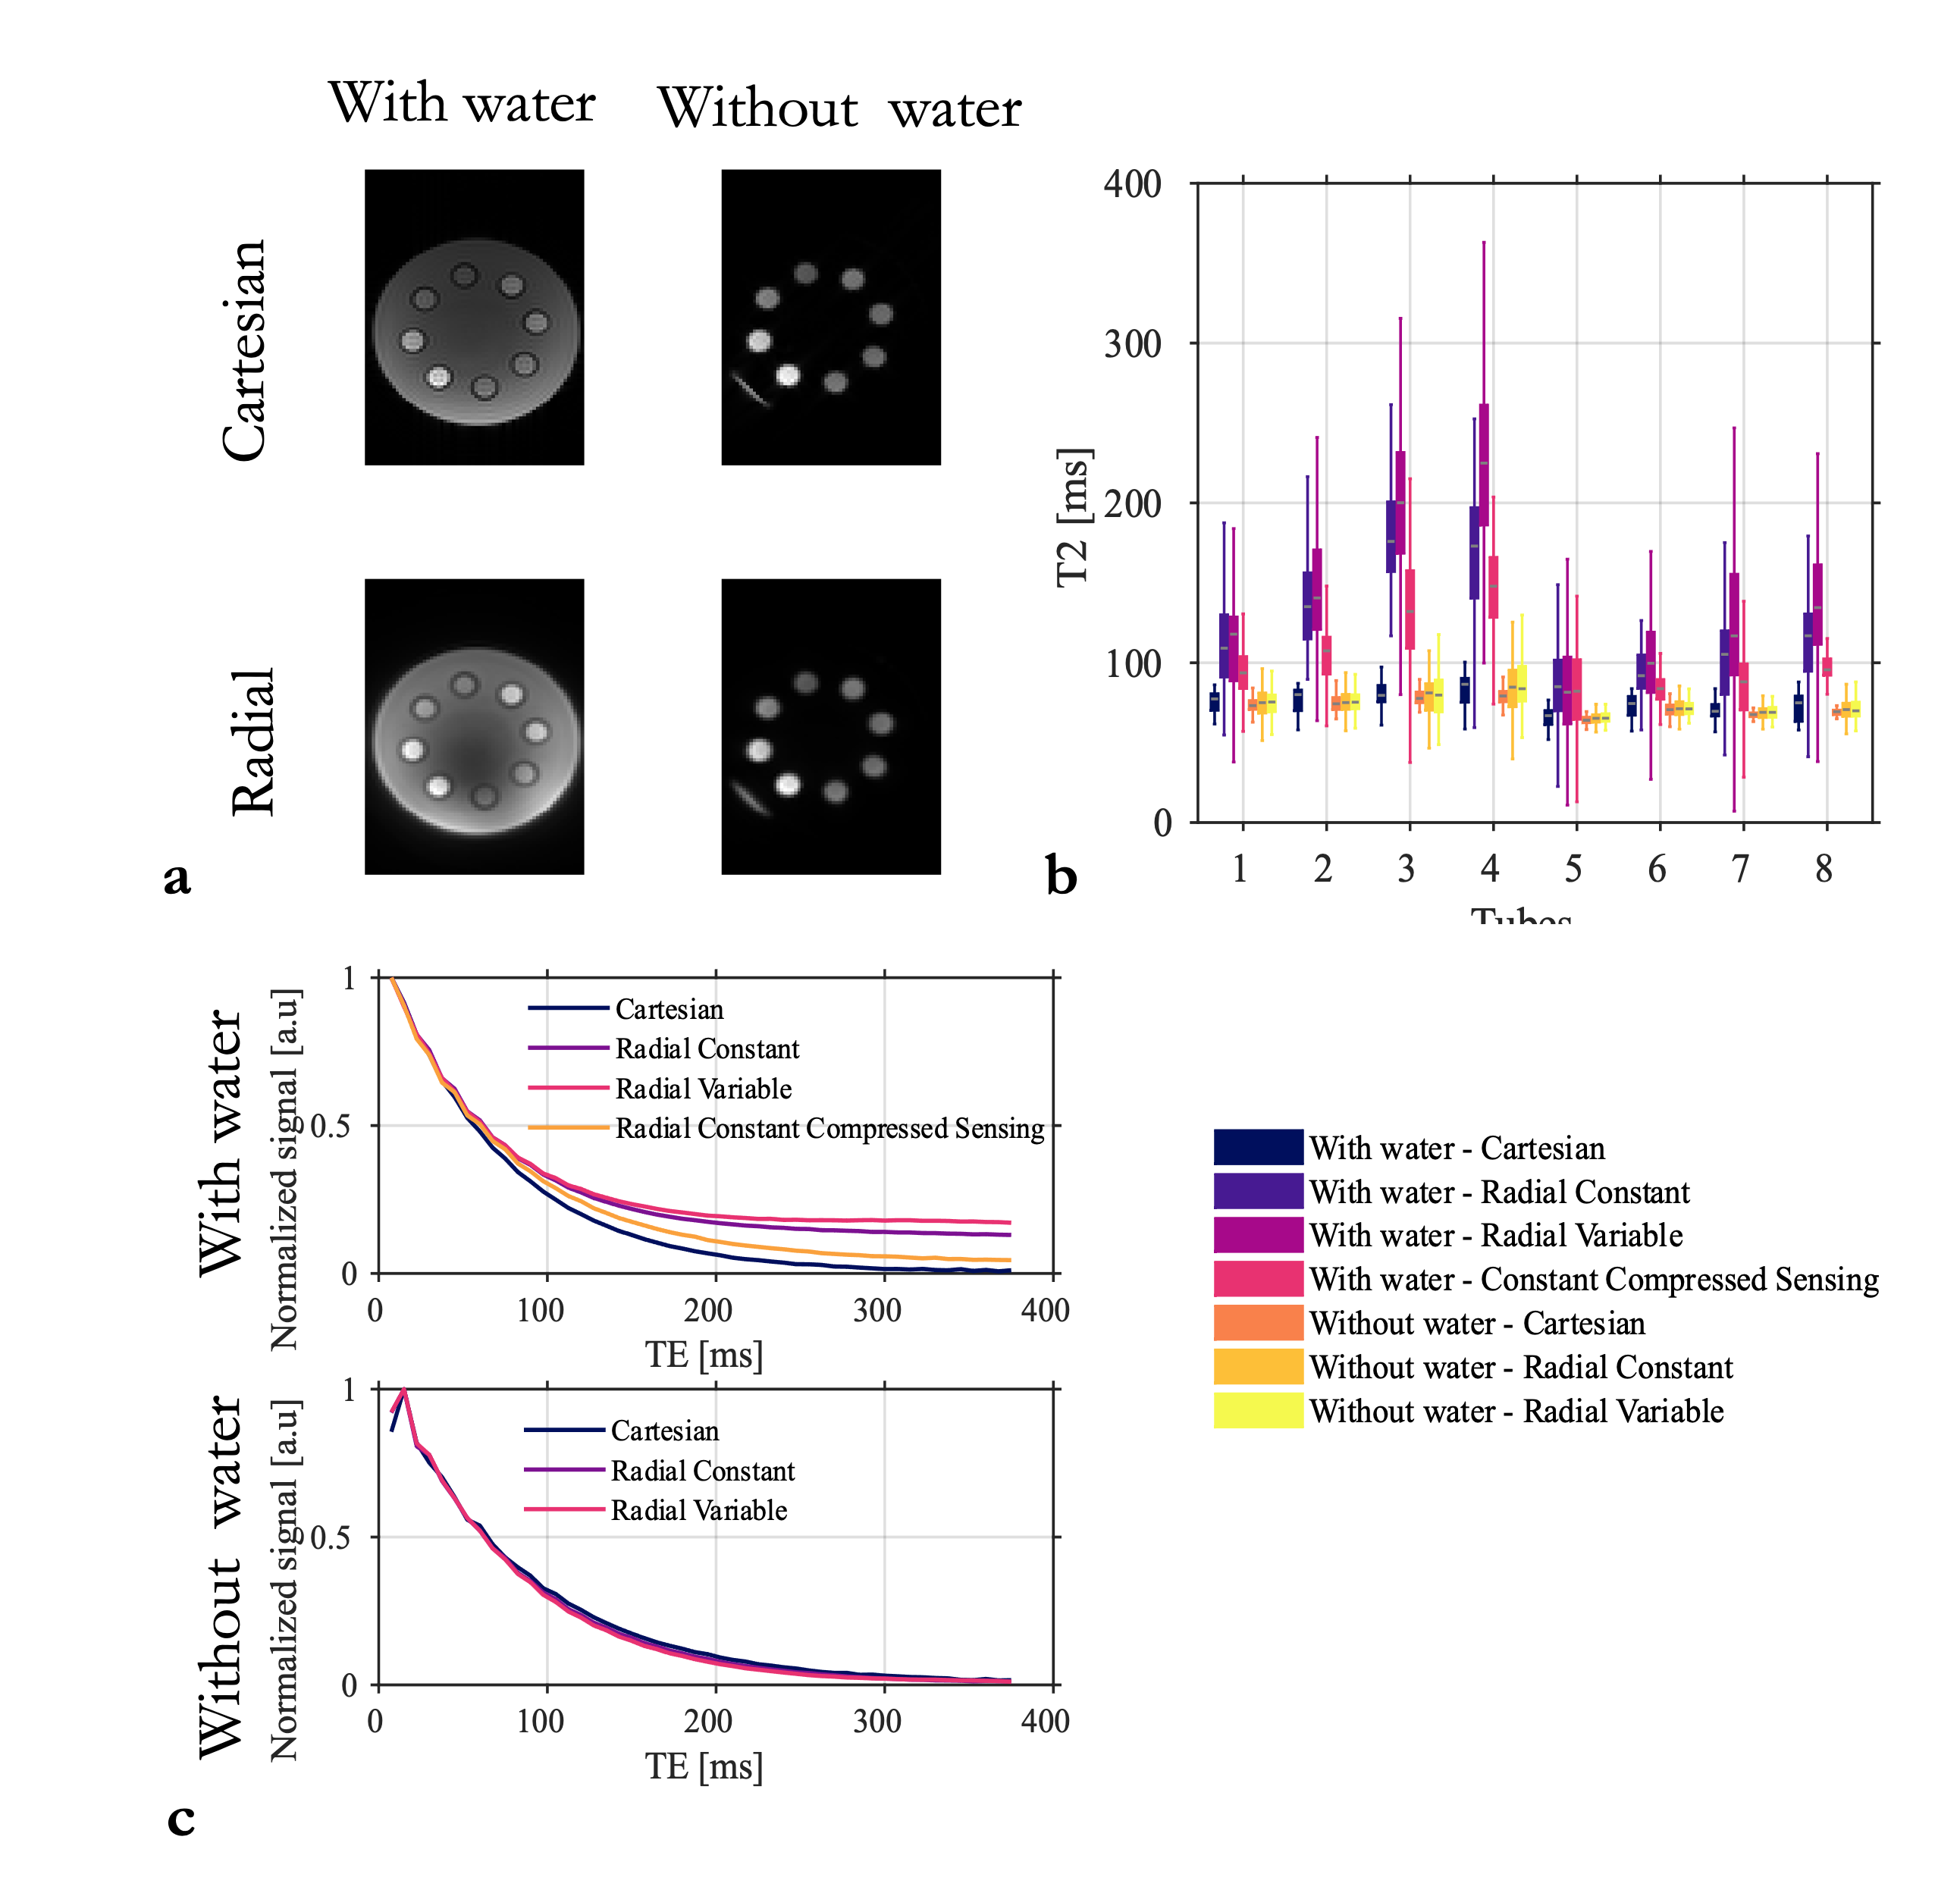
In line with simulations, cartesian and radial acquisitions provided the same T2 estimates when no water was surrounding the tubes (Fig2.b) and the signal decays were perfectly overlapping (Fig2.c). With water, the signal decays in the tubes were very different (Fig2.c) resulting in large over-estimation of T2 (Fig2.b). Variable sampling resulted in a higher bias while compressed sensing reconstruction substantially reduced it (Fig2.b).
Brain
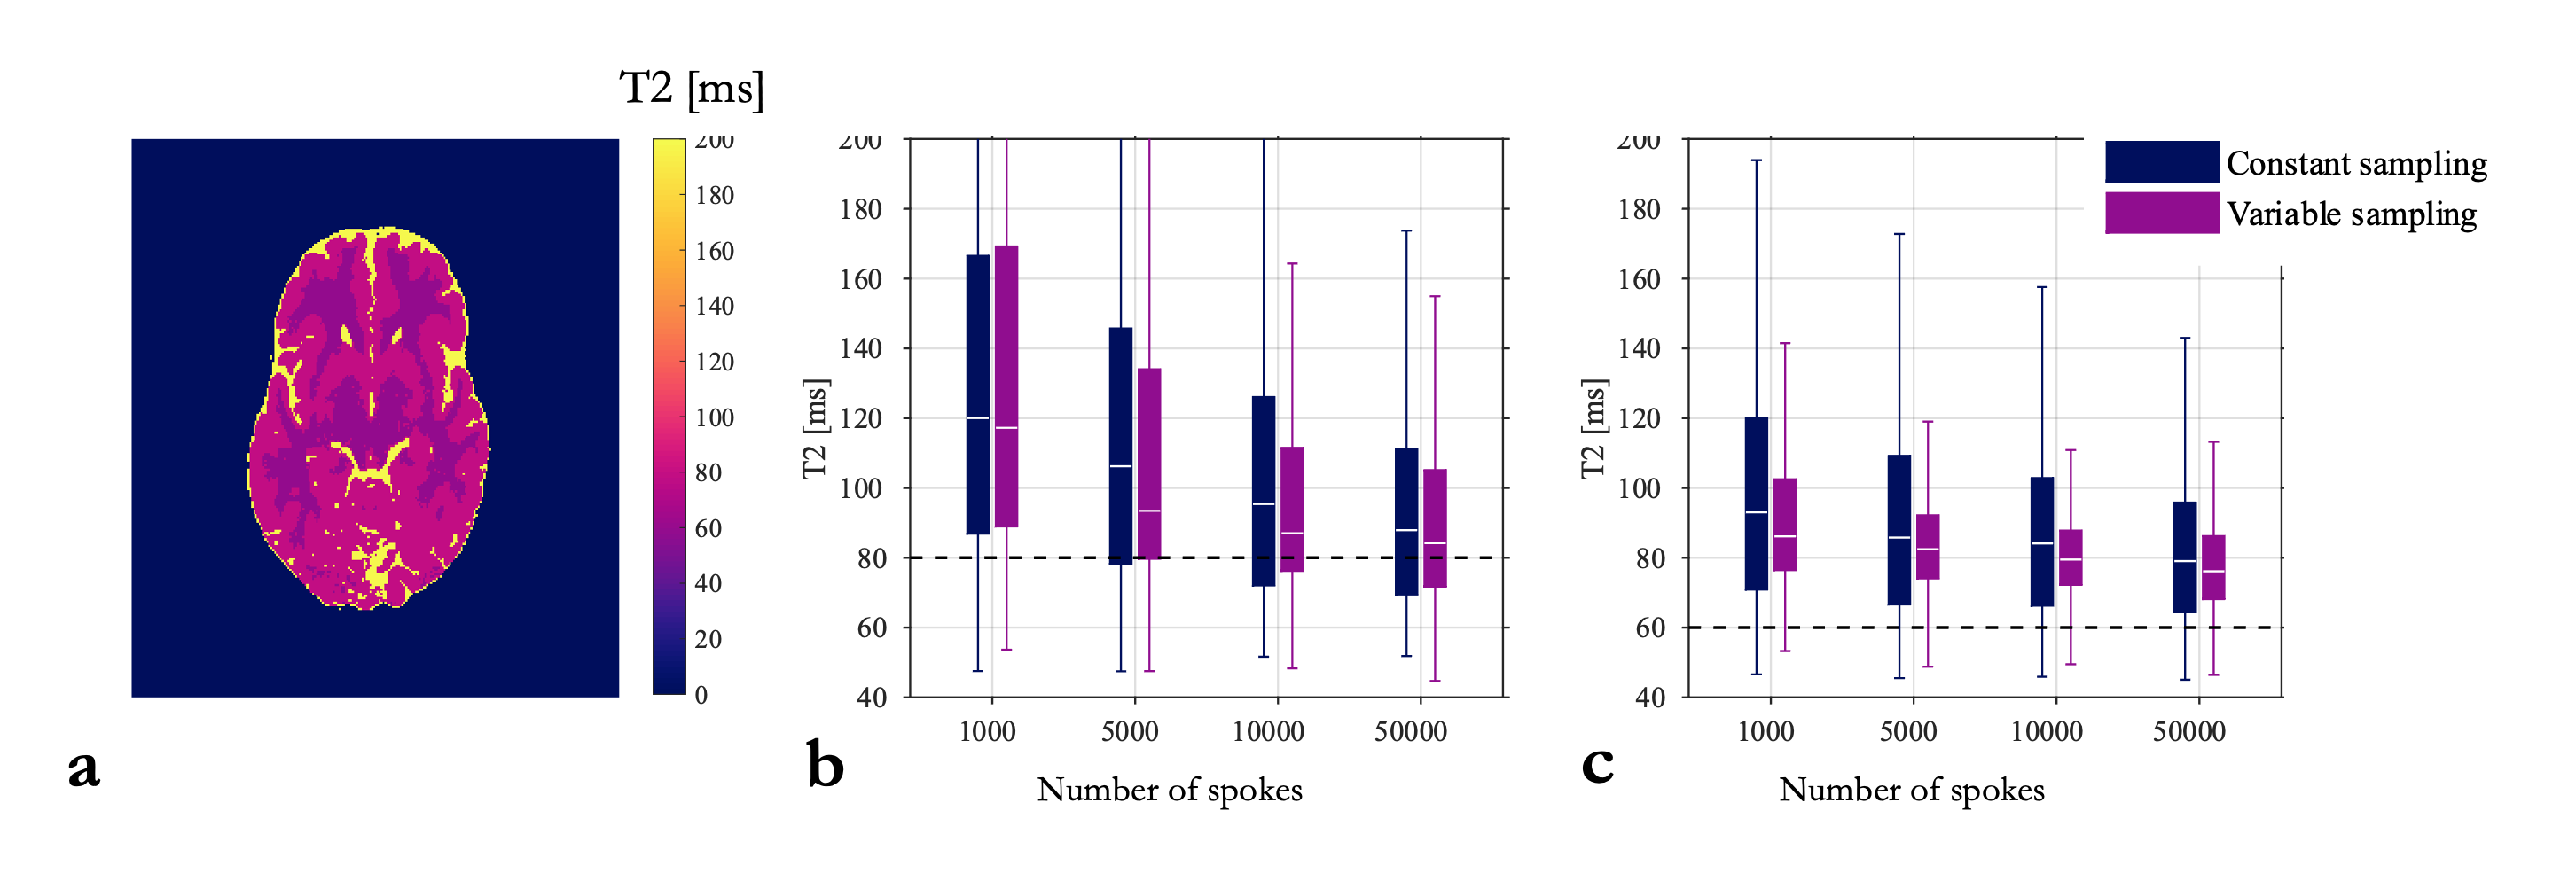
Numerical simulations also predicted an over-estimation of T2 in WM and GM (Fig.3); although the bias decreased with higher number of samples (from 68% to 37% in WM). The error was slightly decreased when using a variable sampling across echoes (from 46% to 37% for WM and 10000 spokes).
In line with simulations, we observed in-vivo an overestimation of T2 (+7.5% and +8.7% in average for constant and variable sampling respectively) although the bias was lower than predicted (Fig.4). Low rank and subspace reconstruction provided less blurred images and the bias was slightly reduced (7.3% and 8.4% in average for constant and variable sampling respectively).
Discussion
Undersampling radial acquisitions results in streaking artefact affecting voxels everywhere. The decay observed in one voxel is therefore the weighted sum of multiple signals from voxels coming from everywhere. The presence of a very long T2 in the background greatly affects the signal of voxels with a smaller T2, especially at longer echoes, i.e. low SNR. As a result, the estimated T2 is biased. Although variable sampling introduces variable streaking artefacts across echoes, which could result in artefacts more apparent to noise than bias, it did not help and even increased the error in phantom.Likely caused by the long T2 of the CSF, the bias was also observed in-vivo at a lesser degree. For those highly undersampled acquisitions,parallel imaging and compressed sensing reconstruction was mandatory and likely contributed to mitigate the bias.
Conclusion
We highlighted a source of bias in T2 relaxometry. This might be of interest for any qMRI studies conducted with a radial sampling. We therefore recommend to not use phantoms made out of tubes embedded in water in this context and take advantage of advanced reconstruction approaches to mitigate the bias.Acknowledgements
This work was supported by the French National Research Agency (ANR-19-CE19-0014) and by the Inserm Cancer PCSI funding N°20CP093-00.References
1. Feng, L. Golden-Angle Radial MRI: Basics, Advances, and Applications. J. Magn. Reson. Imaging 56, 45–62 (2022).
2. Keerthivasan, M. B., Bilgin, A. & Altbach, M. I. Quantitative T2 Estimation Using Radial Turbo Spin Echo Imaging. Preprint at https://doi.org/10.48550/arXiv.1911.04017 (2019).
3. Ben-Eliezer, N., Sodickson, D. K., Shepherd, T., Wiggins, G. C. & Block, K. T. Accelerated and motion-robust in vivo T2 mapping from radially undersampled data using bloch-simulation-based iterative reconstruction. Magn. Reson. Med. 75, 1346–1354 (2016).
4. Huang, C., Bilgin, A., Barr, T. & Altbach, M. I. T2 relaxometry with indirect echo compensation from highly undersampled data. Magn. Reson. Med. 70, 1026–1037 (2013).
5. Saff, E. B. & Kuijlaars, A. B. J. Distributing many points on a sphere. Math. Intell. 19,5–11 (1997).
6. Bernstein, M. A., King, K. F. & Zhou, X. J. CHAPTER 17 - ADVANCED PULSE SEQUENCE TECHNIQUES. in Handbook of MRI Pulse Sequences (eds. Bernstein, M. A., King, K. F. & Zhou, X. J.) 802–954 (Academic Press, 2004). doi:10.1016/B978-012092861-3/50024-8.
7. Zwart, N. R., Johnson, K. O. & Pipe, J. G. Efficient sample density estimation by combining gridding and an optimized kernel. Magn. Reson. Med. 67, 701–710 (2012).
8. Uecker, M. et al. mrirecon/bart: version 0.7.00. (2021) doi:10.5281/zenodo.4570601.
9. Tamir, J. I. et al. T2 shuffling: Sharp, multicontrast, volumetric fast spin-echo imaging. Magn. Reson. Med. 77, 180–195 (2017).
10. Lebel, R. M. & Wilman, A. H. Transverse relaxometry with stimulated echo compensation. Magn. Reson. Med. 64, 1005–1014 (2010).
Figures