1614
Compressed sensing vs multiple overlapping echo detachment in acceleration efficiency of DL-based quantitative parametric mapping
Qingdang Qin1, Jiechao Wang1, Zhigang Wu2, Shuhui Cai1, and Congbo Cai1
1Department of Electronic Science, Xiamen University, Xiamen, China, 2MSC Clinical & Technical Solutions, Philips Healthcare, ShenZhen, China
1Department of Electronic Science, Xiamen University, Xiamen, China, 2MSC Clinical & Technical Solutions, Philips Healthcare, ShenZhen, China
Synopsis
Keywords: Quantitative Imaging, Quantitative Imaging
Compressed sensing (CS) relies on random under-sampling measurements and has been the primary technique to accelerate quantitative parametric mapping (QPM). The multiple overlapping-echo detachment (MOLED) technique proposed recently is a novel technique to realize quantitative parametric mapping in a single shot within around 100 milliseconds. However, the two techniques still lack a systematic comparison of acceleration performance in QPM. For the first time, we analyze and compare the performance of these two techniques under the same conditions via numerical experiments. The results show that MOLED outerperforms one-dimensional under-sampling CS acceleration technique in T2 quantification.Introduction
Quantitative parametric mapping (QPM) has shown clinical value in diagnosis.1,2 However, long acquisition time is an essential obstacle to its application. Various acceleration methods have been proposed to improve the acquisition efficiency of QPM.3,4 As a recently proposed QPM acceleration method, multiple overlapping-echo detachment imaging (MOLED) proposed by our group can realize reliable QPM in a single shot.5-7 Different from traditional acceleration methods that are mainly based on under-sampling of k-space data and using prior information for reconstruction, MOLED accelerates QPM via increasing the collected information in a shot. However, the reconstruction performance of MOLED has not been thoroughly studied and analyzed. In this work, we took T2 mapping as an example to analyze and compare the reconstruction performance between MOLED and CS MRI based on a group of one-dimensional (1D) under-sampling patterns under the same experimental conditions.Methods
Imaging sequences. Four imaging sequences were used: (1) MOLEDsequence;7 (2) SE-EPI sequence with a relatively high acquisition bandwidth to obtain a minimum TE of 21.92 ms; (3) SE sequence; (4) partial Fourier transform SE-EPI (PFT-SE-EPI) sequence with different partial Fourier acquisition schemes to ensure the same TEs as MOLED. Four TEs (TE1 = 21.9 ms, TE2 = 51.9 ms, TE3=81.8 ms, TE4 = 110.7 ms) were used to obtain T2 maps for all the sequences. The field of view (FOV) was 22 cm × 22 cm and the acquisition matrix was 128 × 128. The parametric templates were from the public database IXI, and the simulated data were synthesized by Bloch simulation on the parametric templates for the four sequences. The numbers of simulated samples used for training, validation, and testing were as follows: 5500, 300, and 600.Numerical experiments. Numerical human brains were utilized to compare the performances of the different acceleration techniques. For CS MRI, each sequence needs to be executed four times with different TEs to reconstructe a T2 map, while MOLED only needs to be executed one time. For a fair comparison, the same acceleration factor (R=4) ensures that the k-space data acquired by the three sequences mentioned above for four TEs have the same amount of 128 phase-encoding lines as the MOLED. The under-sampled SE and SE-EPI data were obtained by retrospective under-sampling the fully-sampled SE and SE-EPI data through a groups of 1D Cartesian variable density sampling patterns with R=4, while the PFT-SE-EPI data were obtained by prospective sampling with a 1D uniform sampling pattern with the same acceleration factor. Complex Gaussian noise was added to the simulated data of above sequences.
Reconstructions. A 5-layer U-Net with skip connection structure8, which has been proven to be highly efficient for the reconstruction of CS MRI and can be used for the reconstruction of MOLED, was used to compare the performance of different methods. In the reconstruction, all conditions remain the same except for the number of input channels of the network (MOLED has one input channel, while CS has four input channels). The loss function is l1 norm.
Results
We only consider the range of T2 values of 20-150 ms to rule out cerebrospinal fluid impact on reconstructed T2 maps. The resulting T2 maps are shown in Figure 2. The MOLED can preserve more tissue texture and is more accurate than CS-based methods for the noise-free image. It also shows a better denoising ability for the noise contamination data with noise level 2.5% (NL=2.5%). Table 1 lists the results of three quantitative metrics: peak signal-to-noise ratio (PSNR), structural similarity index (SSIM), and normalized root mean square error (nRMSE). All metrics indicate that MOLED delivers better reconstruction results.Discussion and conclusion
The similarity between the reconstructed T2 maps of the different methods and the references is analyzed through numerical experiments. The results show that in addition to the capability of achieving single-shot T2 mapping, MOLED can get more accurate T2 values and better-preseved tissue boundaries than 1D CS-MRI under the same acquired matrix size and the same amount of data collected. This means that MOLED is also an efficient means of acceleration of quantitative mapping, and deserves further studies.Acknowledgements
This work was supported in part by the Nation Natural Science Foundation of China under 82071913, U1805261, 11775184, and 22161142024.References
1. Bültmann E, Spineli LM, Göhner F, et al. Age-related T2 relaxation times at 3 Tesla as a biomarker of infratentorial brain maturation. Child's Nervous System. 2018;34:117-127.2. Vymazal J, Righini A, Brooks RA, et al. T1 and T2 in the brain of healthy subjects, patients with Parkinson disease, and patients with multiple system atrophy: Relation to iron content. Radiology. 1999;211:489-495.
3. Kijowski R, Rosas H, Samsonov A, et al. Knee imaging: Rapid three-dimensional fast spin-echo using compressed sensing. Journal of Magnetic Resonance Imaging, 2017, 45(6): 1712-1722.
4. Feng L, Ma D, Liu F,et al. Rapid MR relaxometry using deep learning: An overview of current techniques and emerging trends. NMR in Biomedicine, 2022, 35(4): e4416.
5. Ma LC, Wu J, Yang QQ, et al. Single-shot multi-parametric mapping based on multiple overlapping-echo detachment (MOLED) imaging. NeuroImage, 2022, 263: 119645.
6. Cai CB, Wang C, Zeng YQ, et al. Single-shot T2 mapping using overlapping-echo detachment planar imaging and a deep convolutional neural network. Magnetic resonance in medicine, 2018, 80(5): 2202-2214.
7. Zhang J, Wu J, Chen SJ, et al. Robust single-shot T2 mapping via multiple overlapping-echo acquisition and deep neural network. IEEE transactions on medical imaging, 2019, 38(8): 1801-1811.
8. Zbontar J, Knoll F, Sriram A, et al. fastMRI: An open dataset and benchmarks for accelerated MRI. arXiv preprint arXiv:1811.08839, 2018.
Figures
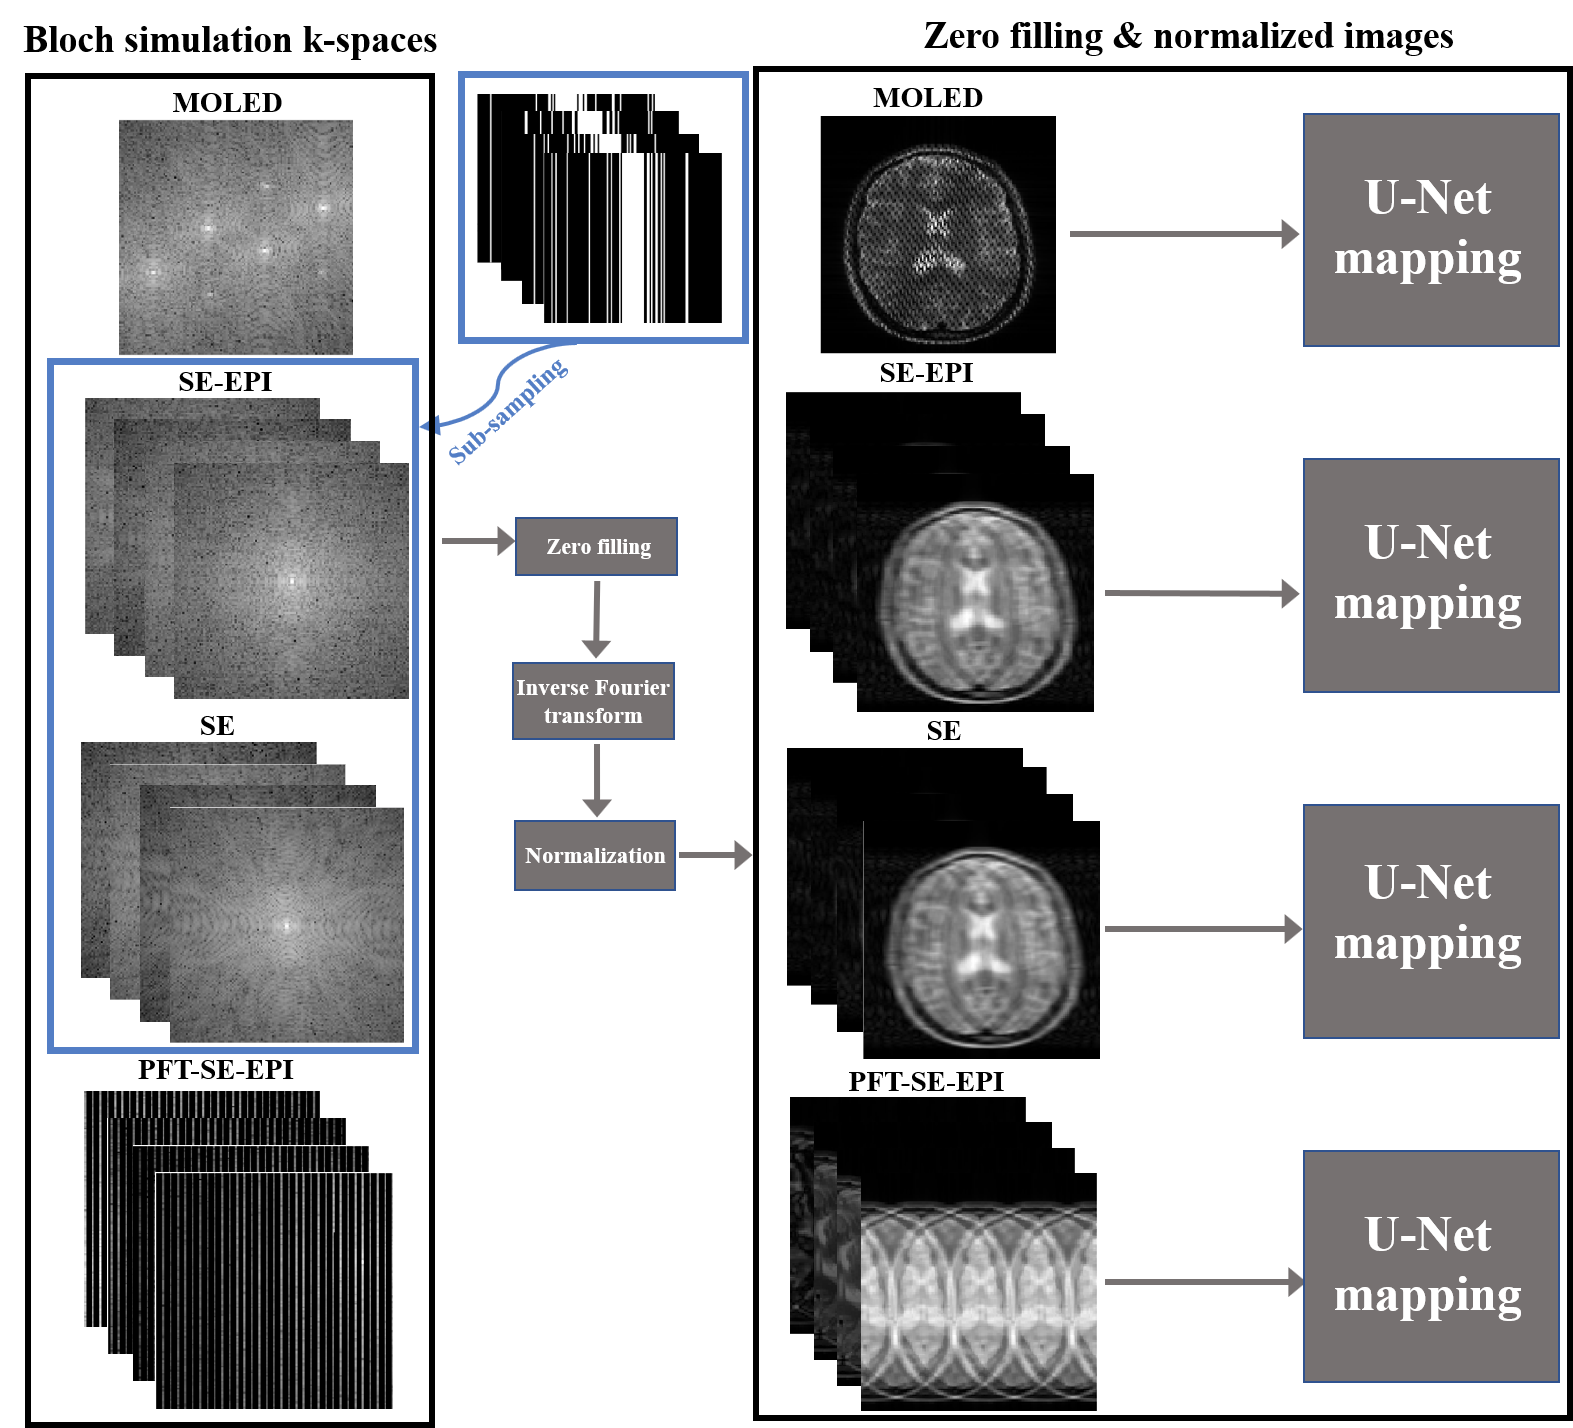
Figure 1. Schematic diagrams of different sequence Bloch simulation k-space and network reconstruction. The k-spaces of SE-EPI and SE sequences were undersampled with the same sampling patterns. Before input to the network, k-space data needs to be zero filled (128 × 128 to 256 × 256 ), inverse Fourier transformed, and normalized.
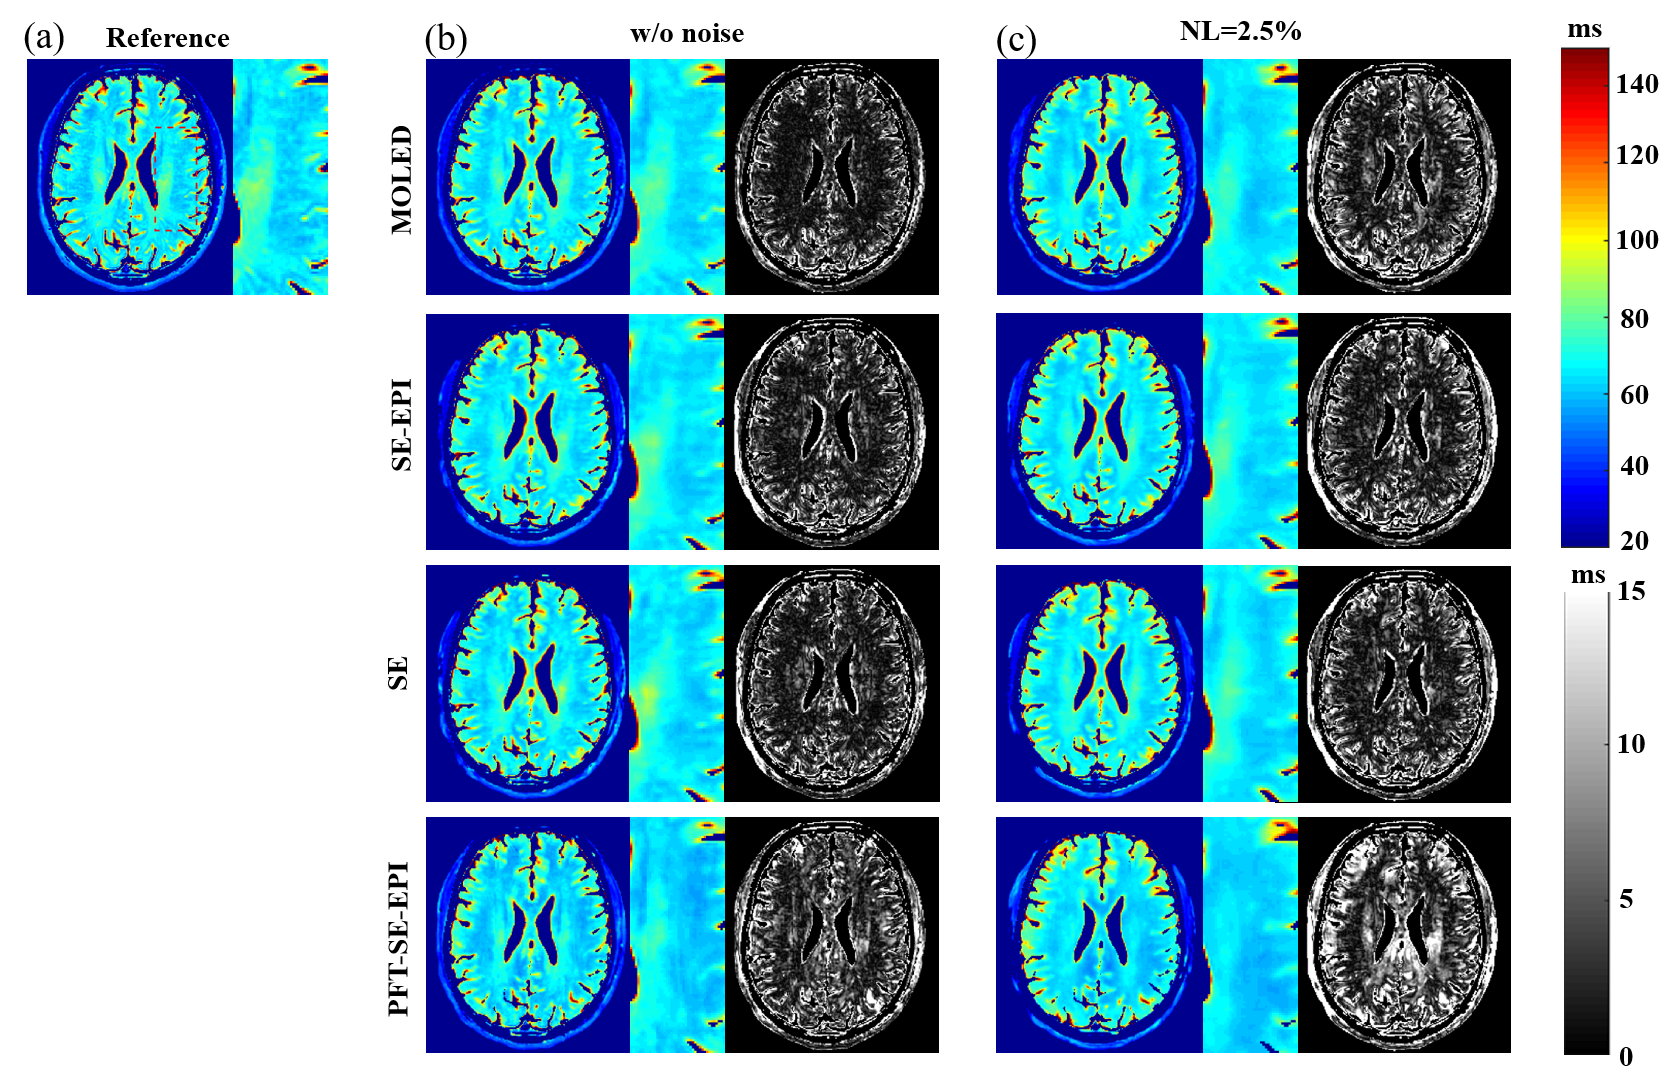
Figure 2. The reconstructed T2 maps from different methods. (a) Reference map. The rectangle indicates zoom-in region for clear comparson. (b) Reconstructed T2 maps under noise-free condition. (c) Reconstructed T2 maps under noise level (NL) of 2.5%. From left to right are reconstructed T2 maps, zoom-in images, and 10 × residual maps.

Table 1. Comparison of PSNR, SSIM and nRMSE (Mean + SD) among different methods.
DOI: https://doi.org/10.58530/2023/1614