1612
Quantitative MR evaluation of pancreas parenchyma in patients with IPMN: association with tumor progression1Kawasaki Medical School Hospital, Kurashiki, Japan
Synopsis
Keywords: Quantitative Imaging, Pancreas
This study focused on the feasibility of quantitative MR evaluation of the pancreas parenchyma in patients with IPMN as a non-invasive tool for predicting the risk of malignancy. Our study showed that increased signal intensity on T2WI and longer T1 relaxation time were associated with a higher risk of malignant IPMN. These results suggested that quantitative MR evaluation of the underlying pancreas parenchyma in patients with IPMN can be a surrogate marker for predicting malignant IPMN.INTRODUCTION
Intraductal papillary mucinous neoplasm (IPMN) is characterized by an expansion of the main pancreatic duct or a branch due to a papillary growth of the epithelium, with rich mucin production, and are categorized into three forms on the basis of areas of involvement: main pancreatic duct, side-branch ducts, or combined1-3. The natural history of IPMN has been documented as a so-called adenoma-carcinoma sequence, where the ultimate form of malignant progression is invasive carcinoma4,5. The 2017 International Association of Pancreatology consensus guidelines for the management of IPMN (IAPCG2017) classified into three categories, i.e. high-risk stigmata (HRS), including all MD-IPMNs, worrisome features (WF), and low-risk lacking HRS and WF to avoid excessive surgery” 6. However, relevant operability is still uncertain, and thus identifying reliable predictive factors for malignant IPMN is a key imperative. Cancer-associated fibroblasts are observed in the tumor-associated stroma of various cancers including those of the breast, prostate, and pancreas. However, it is unclear whether the cancer-related imaging features of the pancreas parenchyma in patients with IPMNs can be surrogate markers for predicting malignant IPMN.Therefore, the purpose of this study was to clarify the association of quantitative MRI indices of the underlying pancreas parenchyma with the progression of IPMN.
METHODS
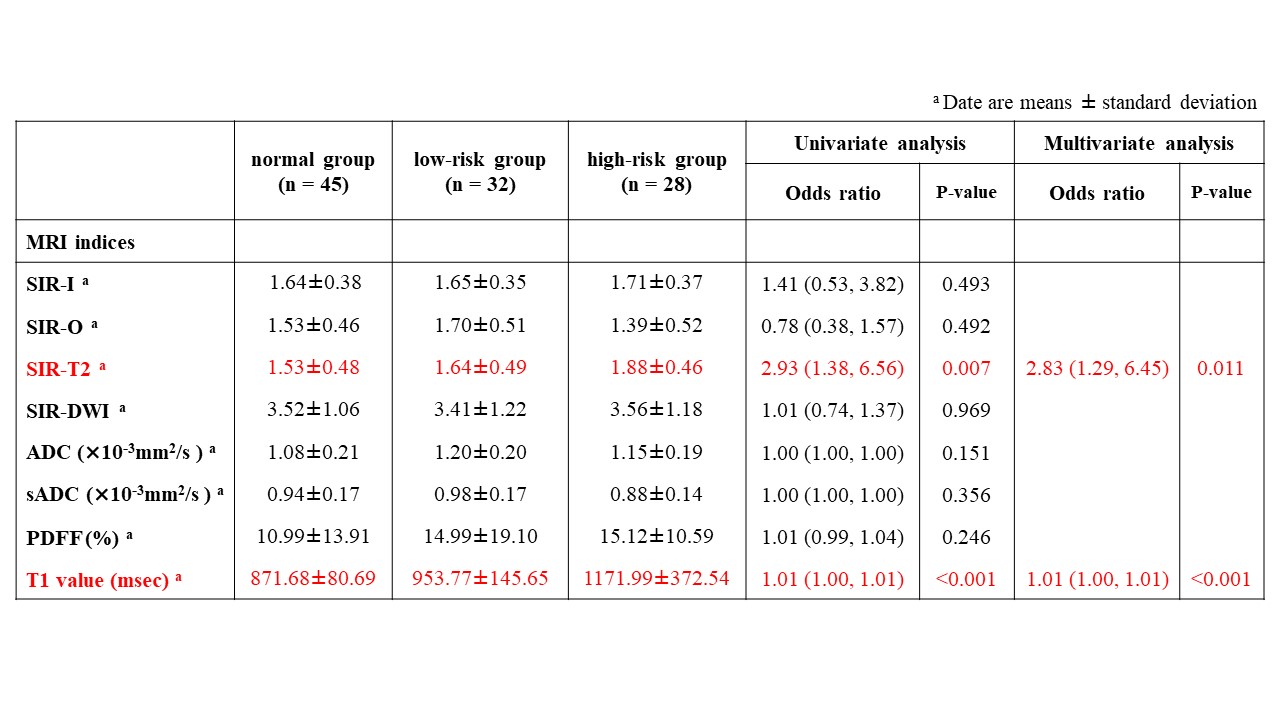
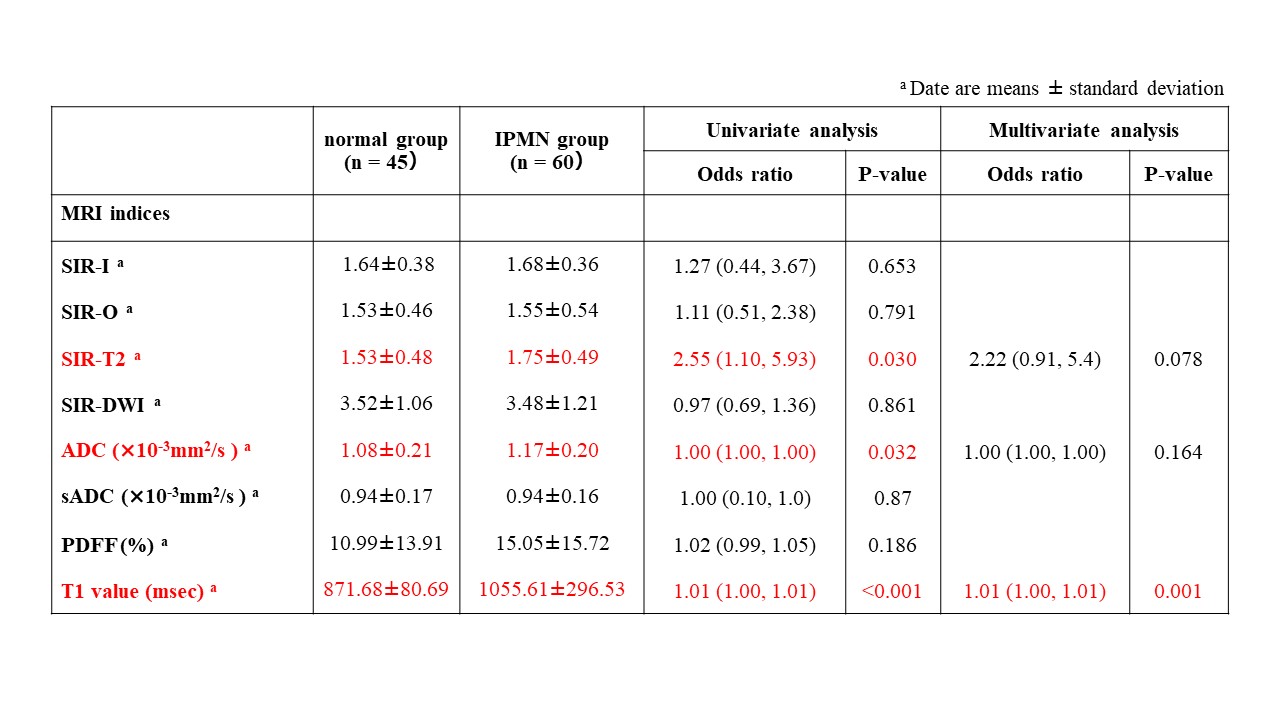
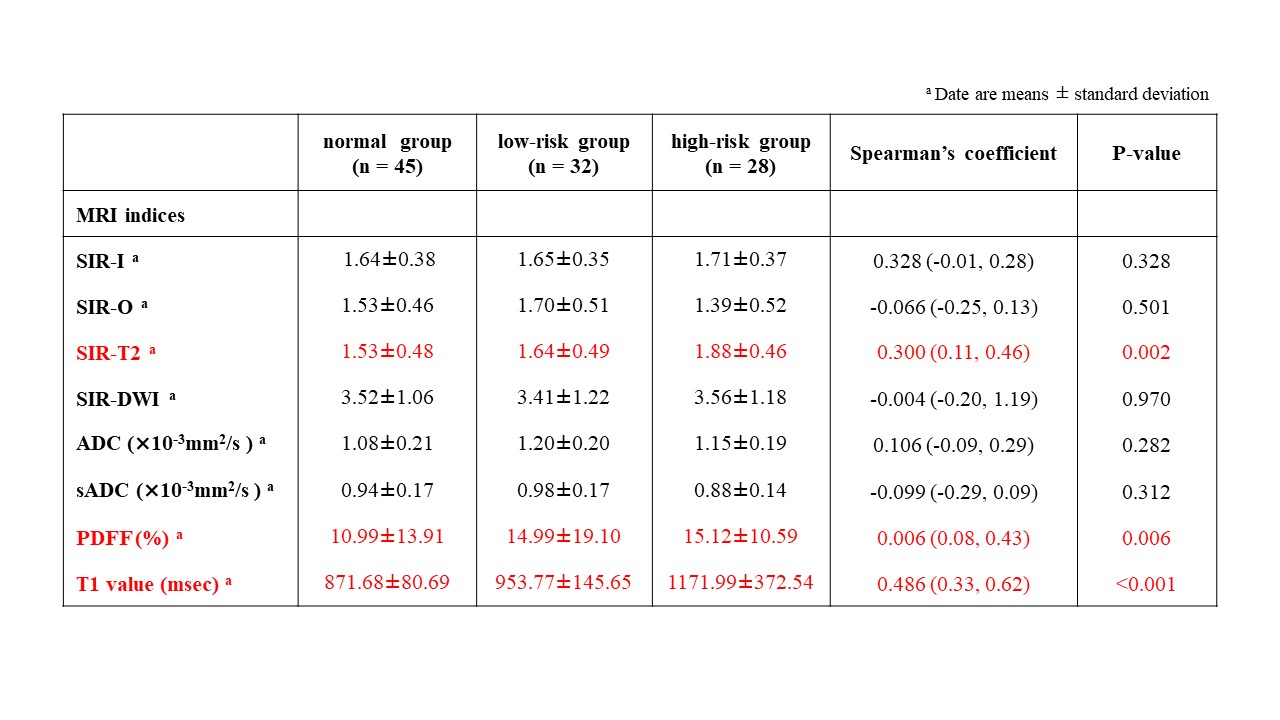
This retrospective study received institutional review board approval. One hundred five patients composed of 45 patients with no history of pancreas disease (normal group) and 60 patients with IPMN (IPMN group) underwent abdominal MRI including multi-echo 3D Dixon T1WI, fat-saturated turbo-spin echo T2WI, single-shot echo-planar DWI with b-values of 0, 200, and 1500 s/mm2, and T1-mapping images acquired using Look-Locker inversion recovery sequences. The pancreas-to-muscle signal intensity ratios on in-phase imaging (SIR-I), opposed-phase imaging (SIR-O), T2WI (SIR-T2), and DWI (SIR-DWI), and proton density fat fraction (PDFF) calculated with multi-echo 3D Dixon T1WI, ADC and shifted ADC (sADC) with DWI, and T1 relaxation time on T1 map were measured using an ROI. ADC and sADC values were calculated as follows: ADC=ln (S0/S1500)/1500 and sADC=ln (S200/S1500)/1300, where S0, S200, and S1500 are the signal with b-values of 0, 200, and 1500 s/mm2, respectively. The IPMN group was divided into high-risk group with high-risk stigmata or worrisome features (n=28) and low-risk group (n=32), according to the IAPCG2017. Spearman's rank correlation coefficient, and univariate and multivariate ordinary logistic regression analyses were performed to analyze the relationship with the progression of IPMN (the normal group, low-risk group, high-risk group). Univariate and multivariate logistic regression analyses were also used to analyze quantitative MRI indices for differentiating between normal and IPMN groups, and between low-risk and high-risk IPMN groups.RESULTS
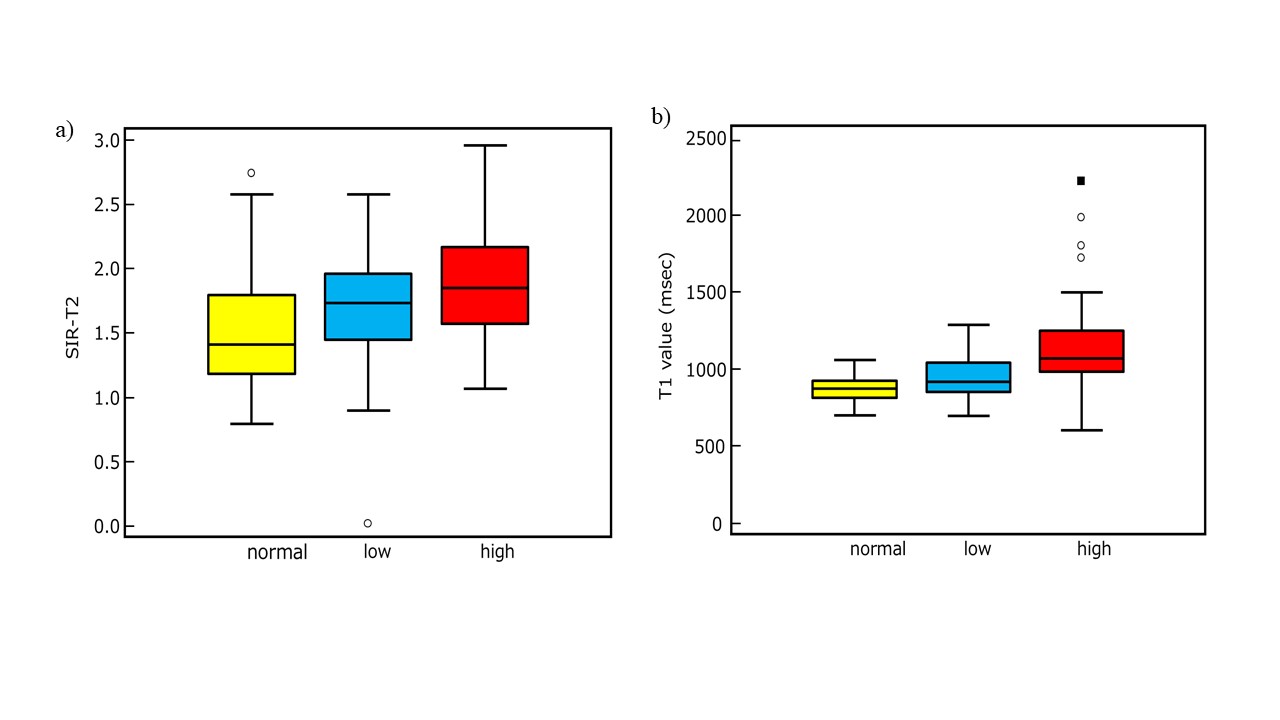
The progression of IPMN showed positive relationships with SIR-T2 (Spearman’s coefficient=0.30, P=0.002), PDFF (Spearman’s coefficient=0.27, P=0.006), and T1 relaxation time (Spearman’s coefficient=0.49, P<0.001) within the pancreas parenchyma (Figs 1 and 2). In ordinary logistic regression analyses univariate and, SIR-T2 (odds ratio=2.83, P=0.011) and T1 relaxation time (odds ratio=1.01, P<0.001) were associated with the progression of IPMN (Fig.3).For differentiating IPMN from normal patients, only T1 relaxation time within the pancreas parenchyma was an independent index (odds ratio=1.01, P=0.001, AUC=0.74 [95% CI: 0.65, 0.84]) (Fig. 4). SIR-T2 (odds ratio=0.99, P=0.001) and T1 relaxation time (odds ratio=1.00, P=0.005) were independent indices for predicting the high-risk group in IPMN patients (AUC=0.81 [95% CI: 0.70, 0.92]) (Fig. 5).
DISCUSSION
In our study, higher pancreas-to-muscle signal intensity ratio on T2WI and longer T1 relaxation time within the pancreas parenchyma were significantly related factors of IPMN with high-risk stigmata or worrisome features, as demonstrated by multivariate analysis.Acute and chronic pancreatitis are reported to be often present in patients with IPMN because of occlusion of the MPD by mucin. The presence of inflammation is considered to be a source of increased signal intensity on T2WI and longer T1 relaxation time that could serve as an imaging biomarker of fibrosis in the pancreas because there is a close topographical relationship between inflamed areas and those areas that develop fibrosis.
Our results showed that T1 relaxation time within the pancreas parenchyma was an independent index for differentiating between normal and IPMN groups, and between low-risk and high-risk IPMN groups. These results are supported by a prior histological study, which showed that the degree of fibrosis in the pancreas parenchyma showed an association with the progression of IPMN and could become a new marker for determining the indications for surgery7.
CONCLUSION
T1 relaxation time measurement of the underlying pancreas parenchyma may be useful for predicting the presence of IPMN and identifying high-risk IPMN.Acknowledgements
No acknowledgement found.References
1. Lafemina J et al. Malignant progression in IPMN: a cohort analysis of patients initially selected for resection or observation. Ann Surg Oncol 2013;20(2):440-447.
2. Gourgiotis S et al. Intraductal papillary mucinous neoplasms of the pancreas. Eur J Surg Oncol 2007;33(6):678-684.
3. Caponi S et al. Adjuvant chemotherapy seems beneficial for invasive intraductal papillary mucinous neoplasms. Eur J Surg Oncol 2013;39(4):396-403.
4. Yamaguchi K et al. Pancreatic ductal adenocarcinoma derived from IPMN and pancreatic ductal adenocarcinoma concomitant with IPMN. Pancreas 2011;40(4):571-580.
5. Kobayashi G et al. Natural history of branch duct intraductal papillary mucinous neoplasm with mural nodules: a Japan Pancreas Society multicenter study. Pancreas 2014;43(4):532-538.
6. Tanaka M et al. Revisions of international consensus Fukuoka guidelines for the management of IPMN of the pancreas. Pancreatology 2017;17(5):738-753.
7. Kakizaki Y et al. Stromal Fibrosis and Expression of Matricellular Proteins Correlate with Histological Grade of Intraductal Papillary Mucinous Neoplasm of the Pancreas. Pancreas 2016;45(8):1145-1152.
Figures
Relationships of tumor progression with the pancreas-to-muscle signal intensity ratio on T2WI and T1 relaxation time within pancreas parenchyma