1611
Establishment of SPGR-based MOLLI T1 mapping for the calculation of extracellular volume fraction (ECV) in Gd-EOB-DTPA-enhanced MRI1Radiology center, Fukuoka University Hospital, Fukuoka city, Japan, 2Department of Radiology, Faculty of Medicine, Fukuoka University, Fukuoka city, Japan, 3GE Healthcare, Hino city, Japan
Synopsis
Keywords: Quantitative Imaging, Quantitative Imaging, T1 mapping
In phantom study, SPGR-MOLLI acquisition scheme was optimized for abdominal T1 mapping in EOB-MRI, which was applied to clinical patients to measure ECV of the spleen and paraspinal muscle obtained 4 min and 25 min after the contrast administration. ECV obtained from contrast-enhanced CT within 3 months from EOB-MRI was used as reference standard. ECVs calculated from EOB-MRI showed significant agreements with those obtained from CT with ICCs of 0.9 and 0.74 for 4 min and 25 min, respectively (p<0.0001), which suggested that our T1 mapping protocol is appropriate and applicable to ECV measurement in EOB-MRI similarly with contrast-enhanced CT.INTRODUCTION
Recently, extracellular volume fraction (ECV) is expected to be an index of tissue fibrosis in various organs. The usefulness of ECV map calculated from contrast-enhanced CT or MRI using extracellular gadolinium (Gd)-based contrast medium (CM) has been reported for the assessment of liver fibrosis1,2. In addition, ECV of the spleen has been reported to be useful in predicting risky esophago-gastric varices in routine CT examinations for chronic liver disease patients3. Because the liver MRI with Gd-EOB-DTPA enhancement (EOB-MRI) has been increasingly prescribed especially in Asia, it would be of use if we can estimate ECV of upper abdominal organs other than the liver, including the spleen, on EOB-MRI. In this study, we attempted to establish optimal SPGR-based MOLLI T1 mapping parameters for ECV calculation in EOB-MRI in phantom study, which was validated in clinical patients using contrast-enhanced CT data as reference standard.METHODS
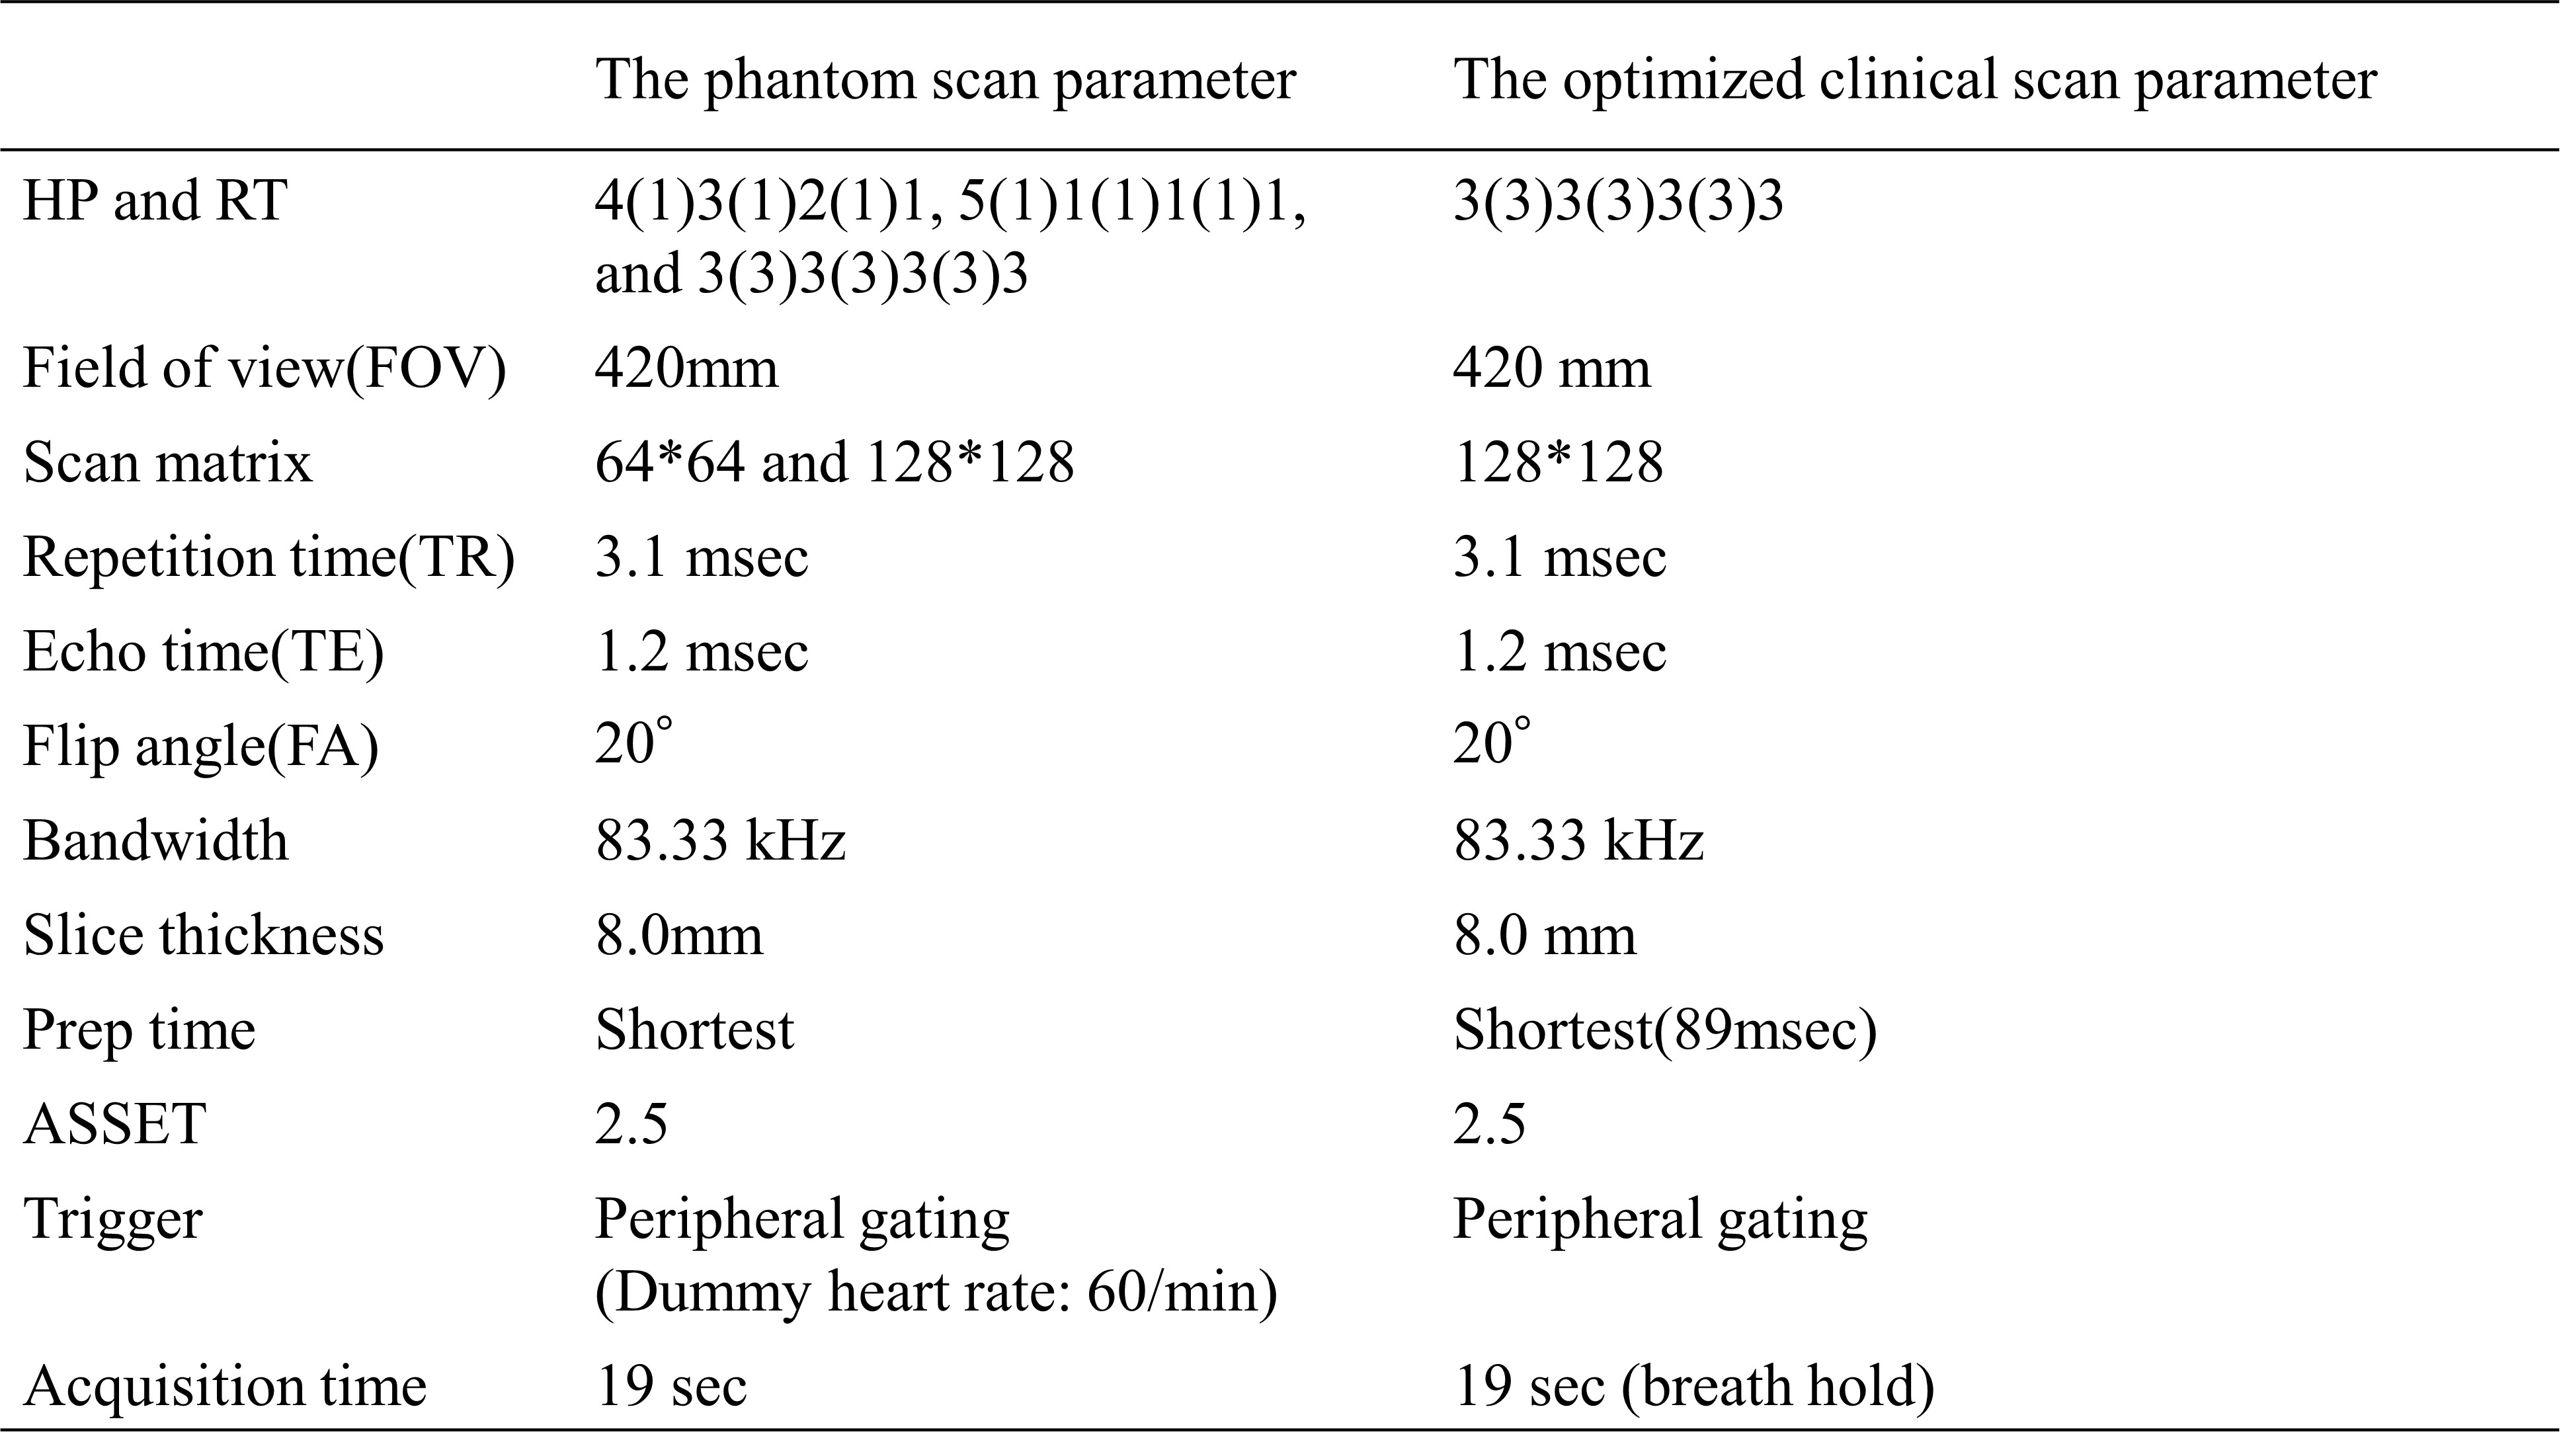
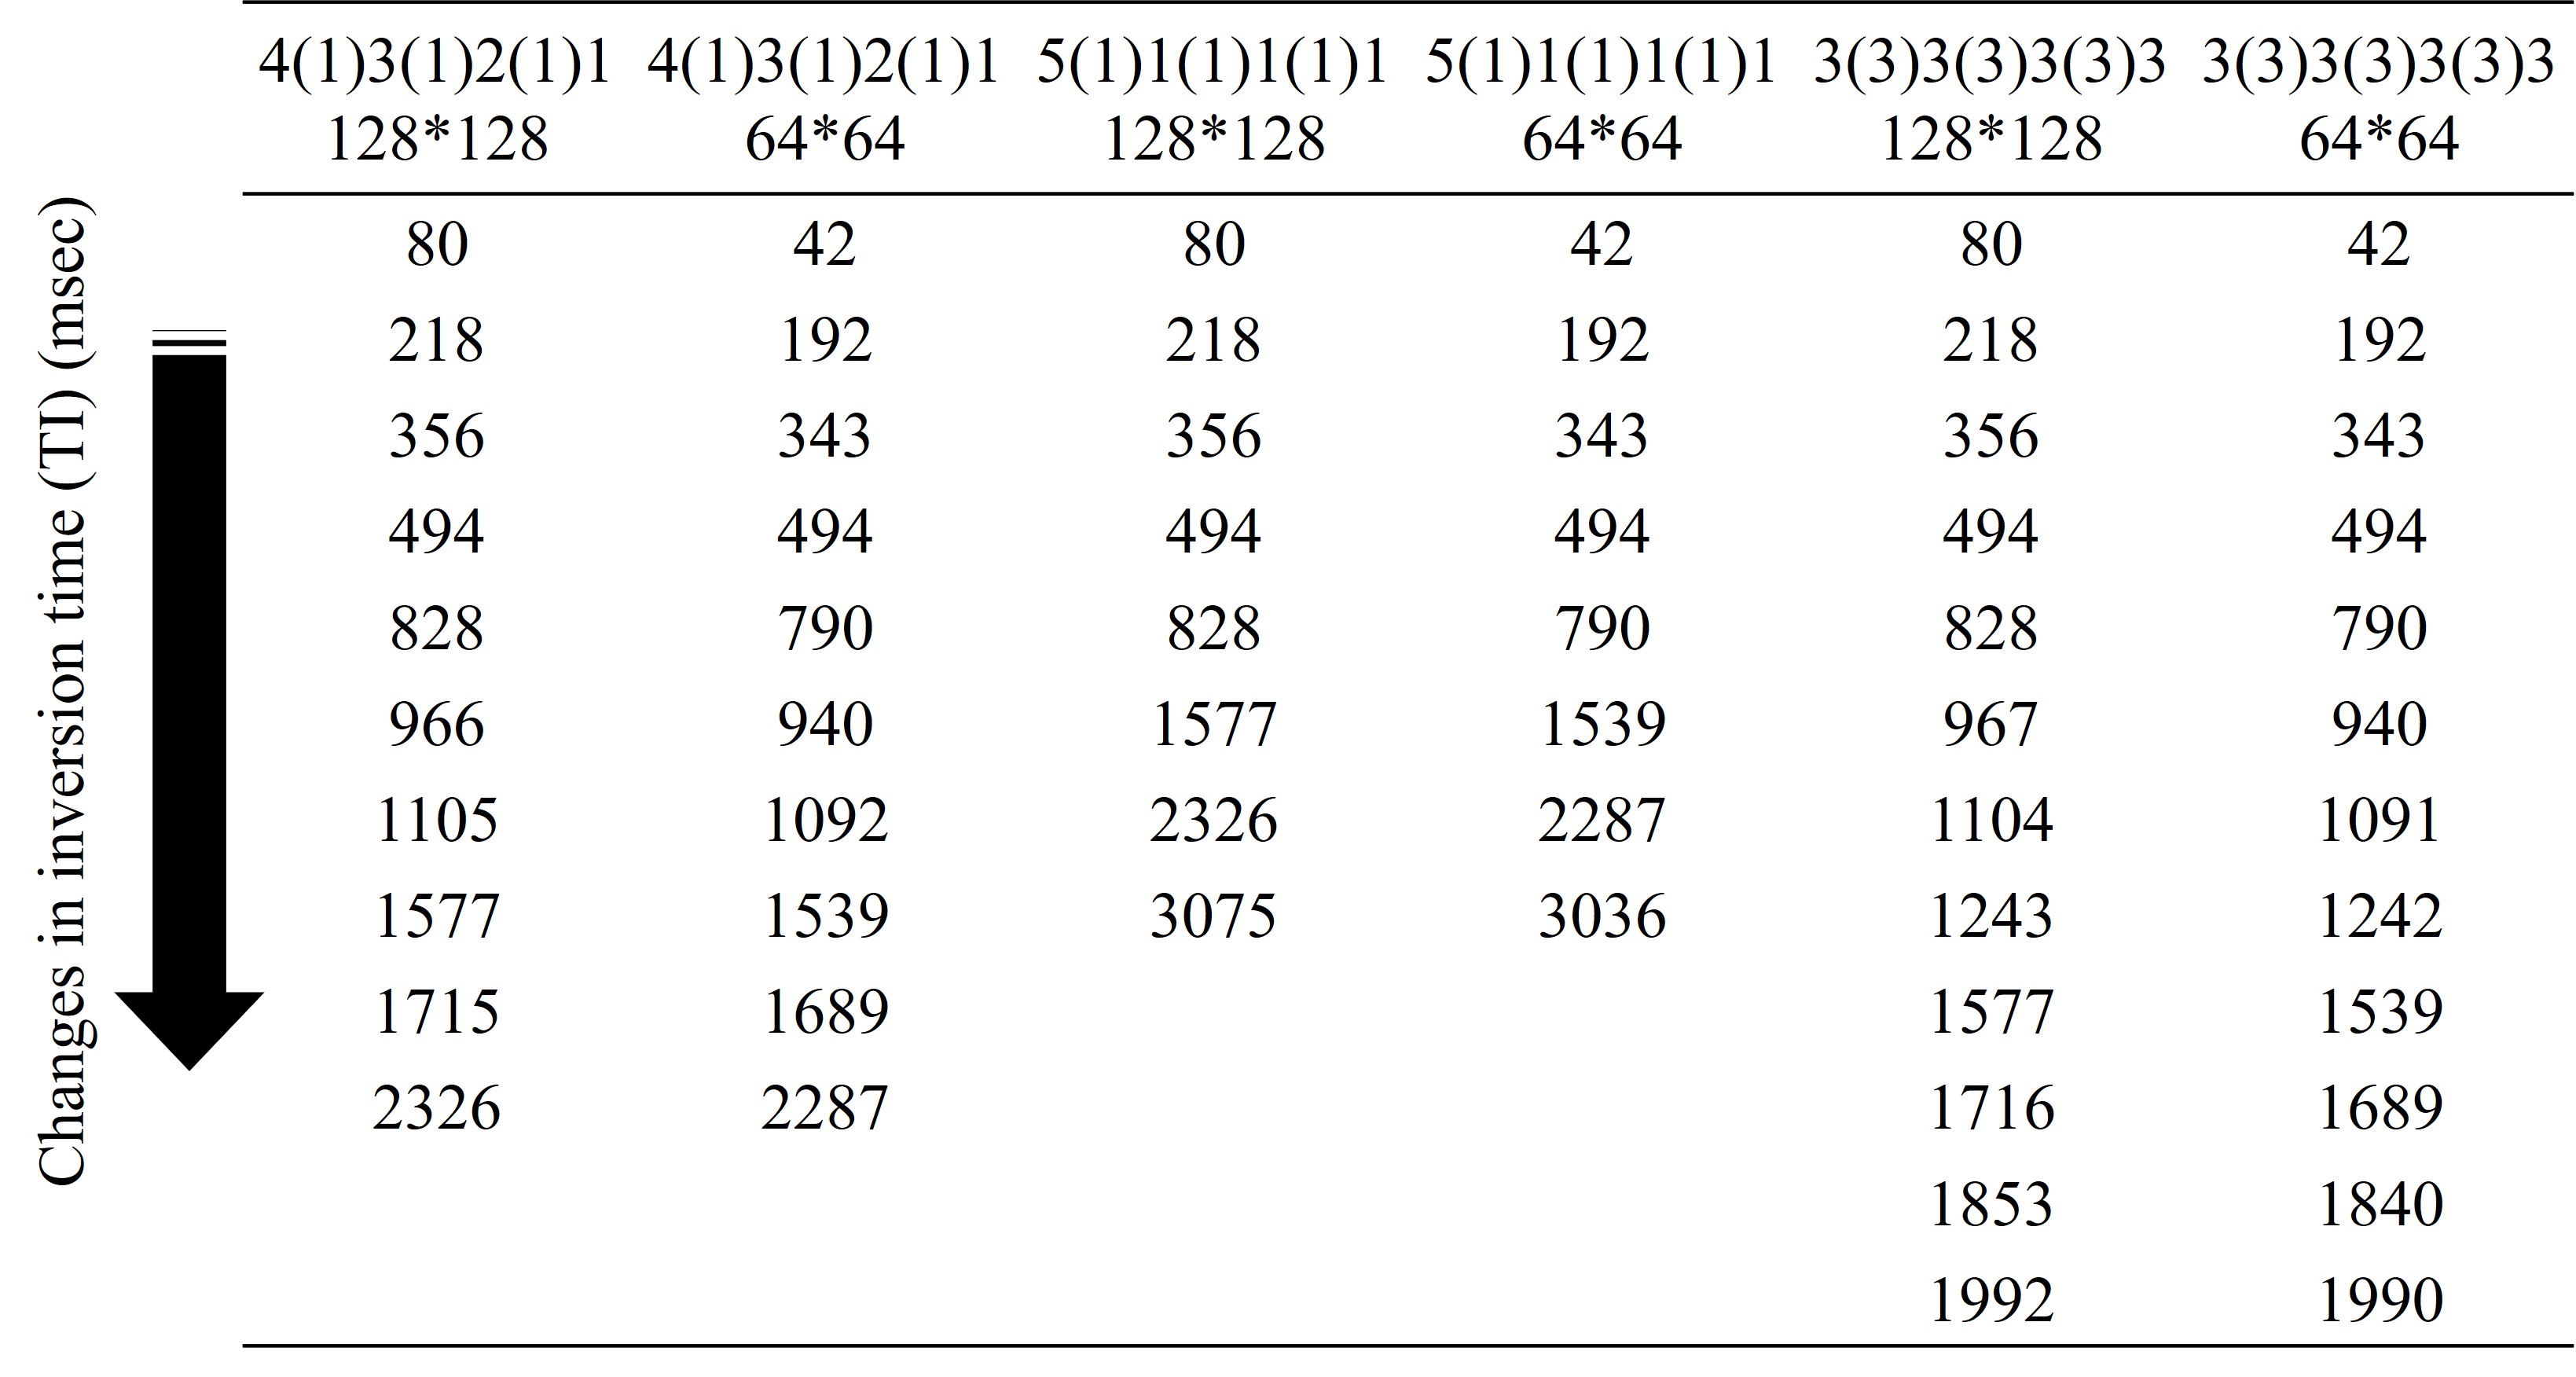
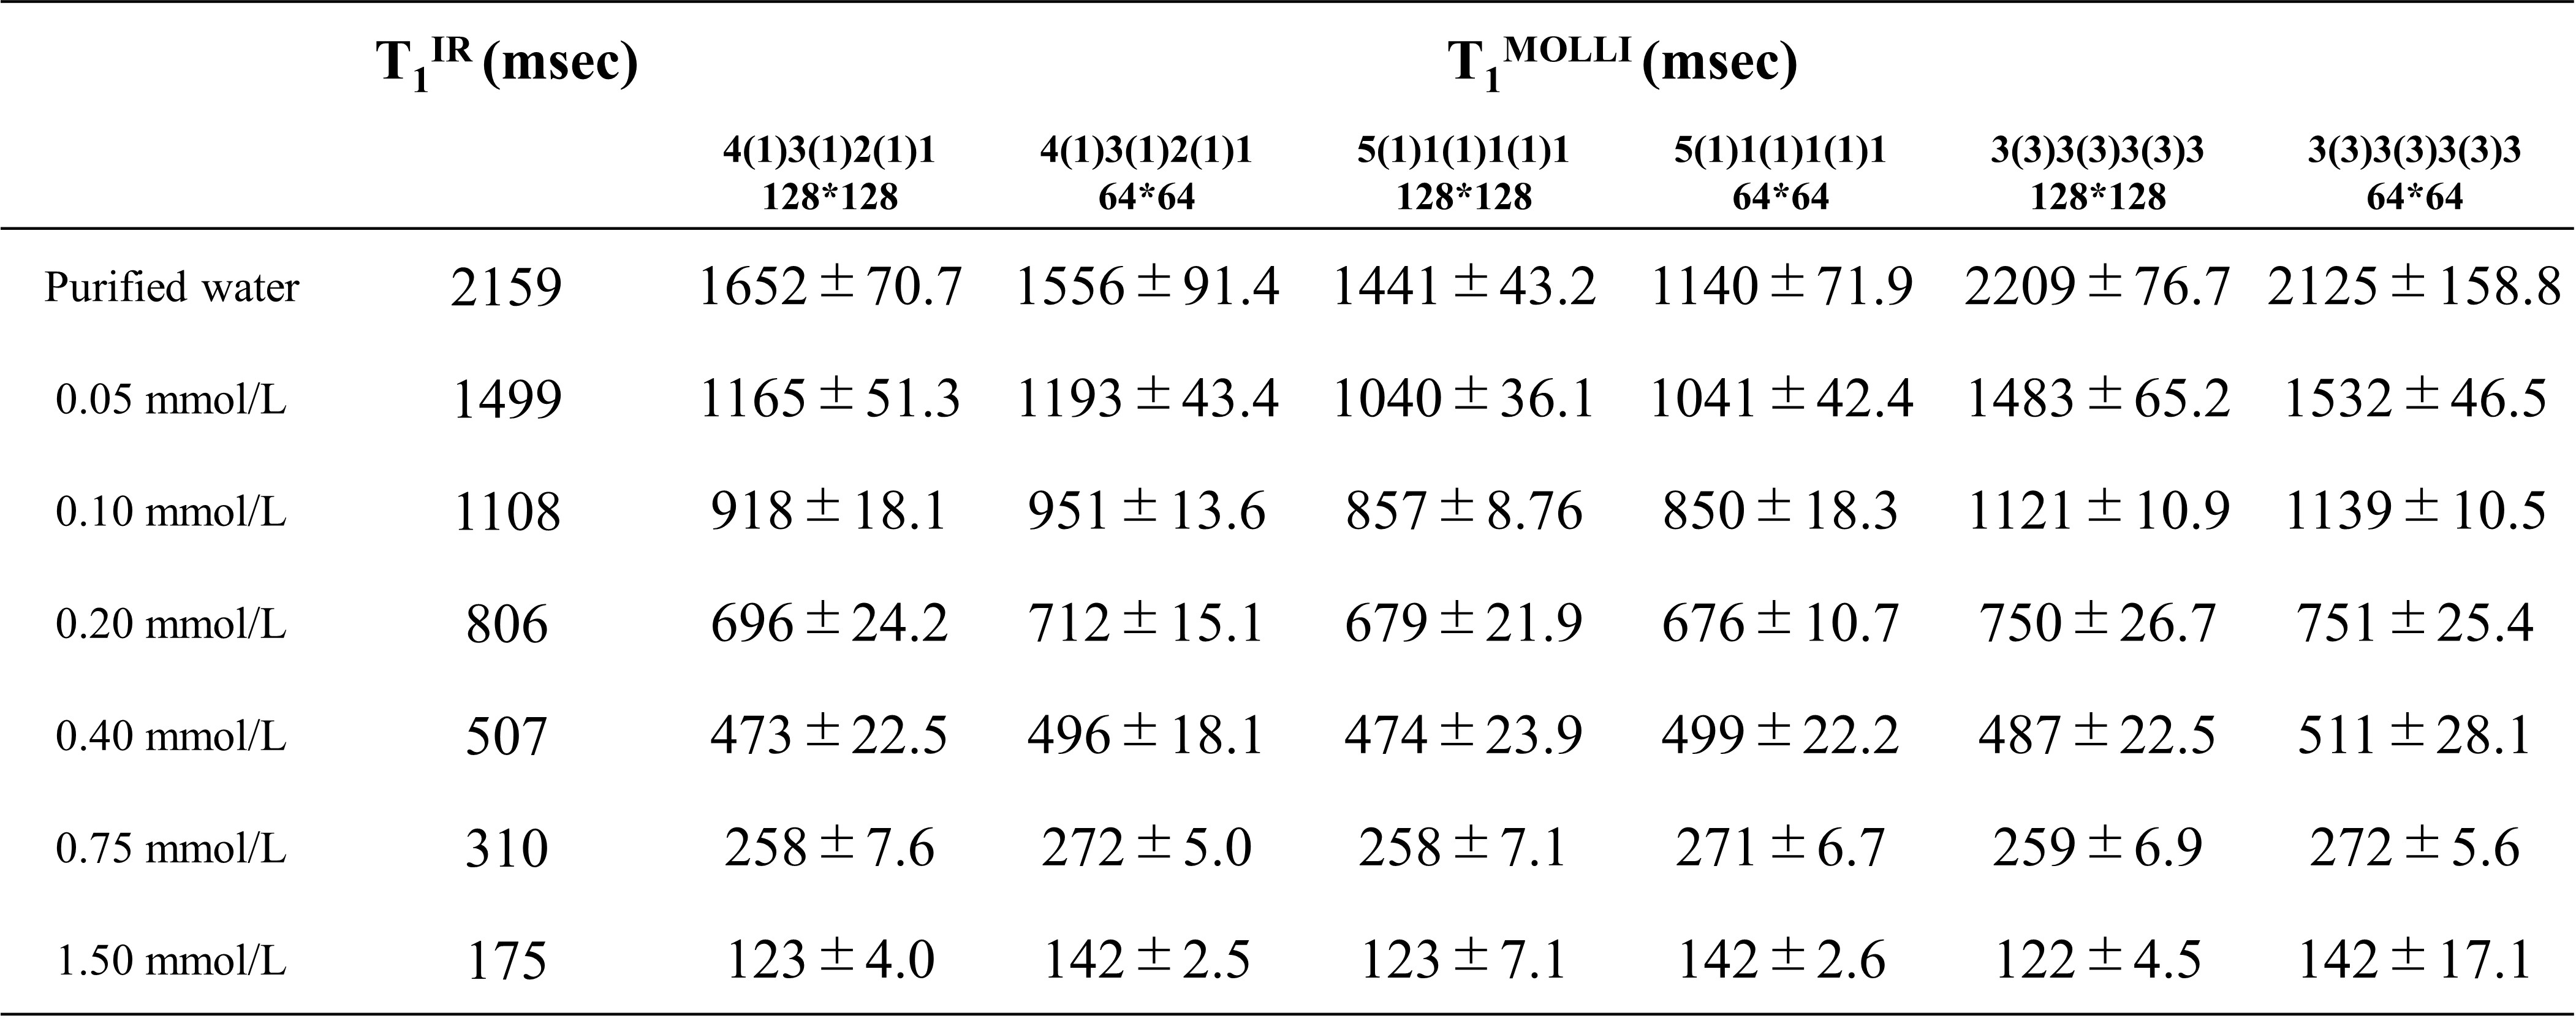
All MR imaging was performed with a 3.0T system (MR Discovery 750w 3.0T ; GE Healthcare) with GEM AA coil and PA coil. In the phantom study, we used seven Gd-CM solutions with various Gd concentration where T1 value ranges from 175 to 2159 ms in order to investigate the accuracy of T1 measurement. SPGR-MOLLI T1 map was acquired from the phantom with the scan parameters shown in Tables 1 and 2. The T1 values of SPGR-MOLLI, T1MOLLI, were compared with those of the conventional inversion recovery, T1IR, which is a gold standard method for T1 measurement. In clinical study, 50 patients (32 males and 18 females, mean age 64 years old) who underwent both EOB-MRI and contrast-enhanced CT of the upper abdomen within 3 months were retrospectively recruited. The content of this study has been approved by institutional review board. T1 maps acquired with the optimized SPGR-MOLLI T1 maps were obtained before, 4 min after, and 25 min after Gd-EOB-DTPA administration. The scan parameters for SPGR-MOLLI T1 map in clinical patients were shown in Table 1. During the T1 map calculation, non-rigid registration was used among each TI images. Clinical CT protocol included unenhanced, arterial phase, portal venous phase, and equilibrium phase (4 min) imaging. The ECV on MRI and CT was calculated using the following formula.ECVCT=(1-hematocrit)*(Dorgan,post – Dorgan,pre)/(Daorta,post - Daorta,pre),where Dorgan,post/pre, Daorta,post/pre indicate CT density after (4 min)/before enhancement of the organ of interest, or of aorta, respectively.
ECVMRI=(1-hematocrit)*(1/T1organ,post – 1/T1organ,pre)/(1/T1aorta,post – 1/T1aorta,pre), where T1organ,post/pre and T1aorta,post/pre indicate T1 values after (4 min and 25 min) and before contrast enhancement, respectively. ECVs of the spleen and paraspinal muscle were calculated both for CT and MRI, and ECVMRI was correlated to ECVCT, which was used as reference standard.
RESULTS
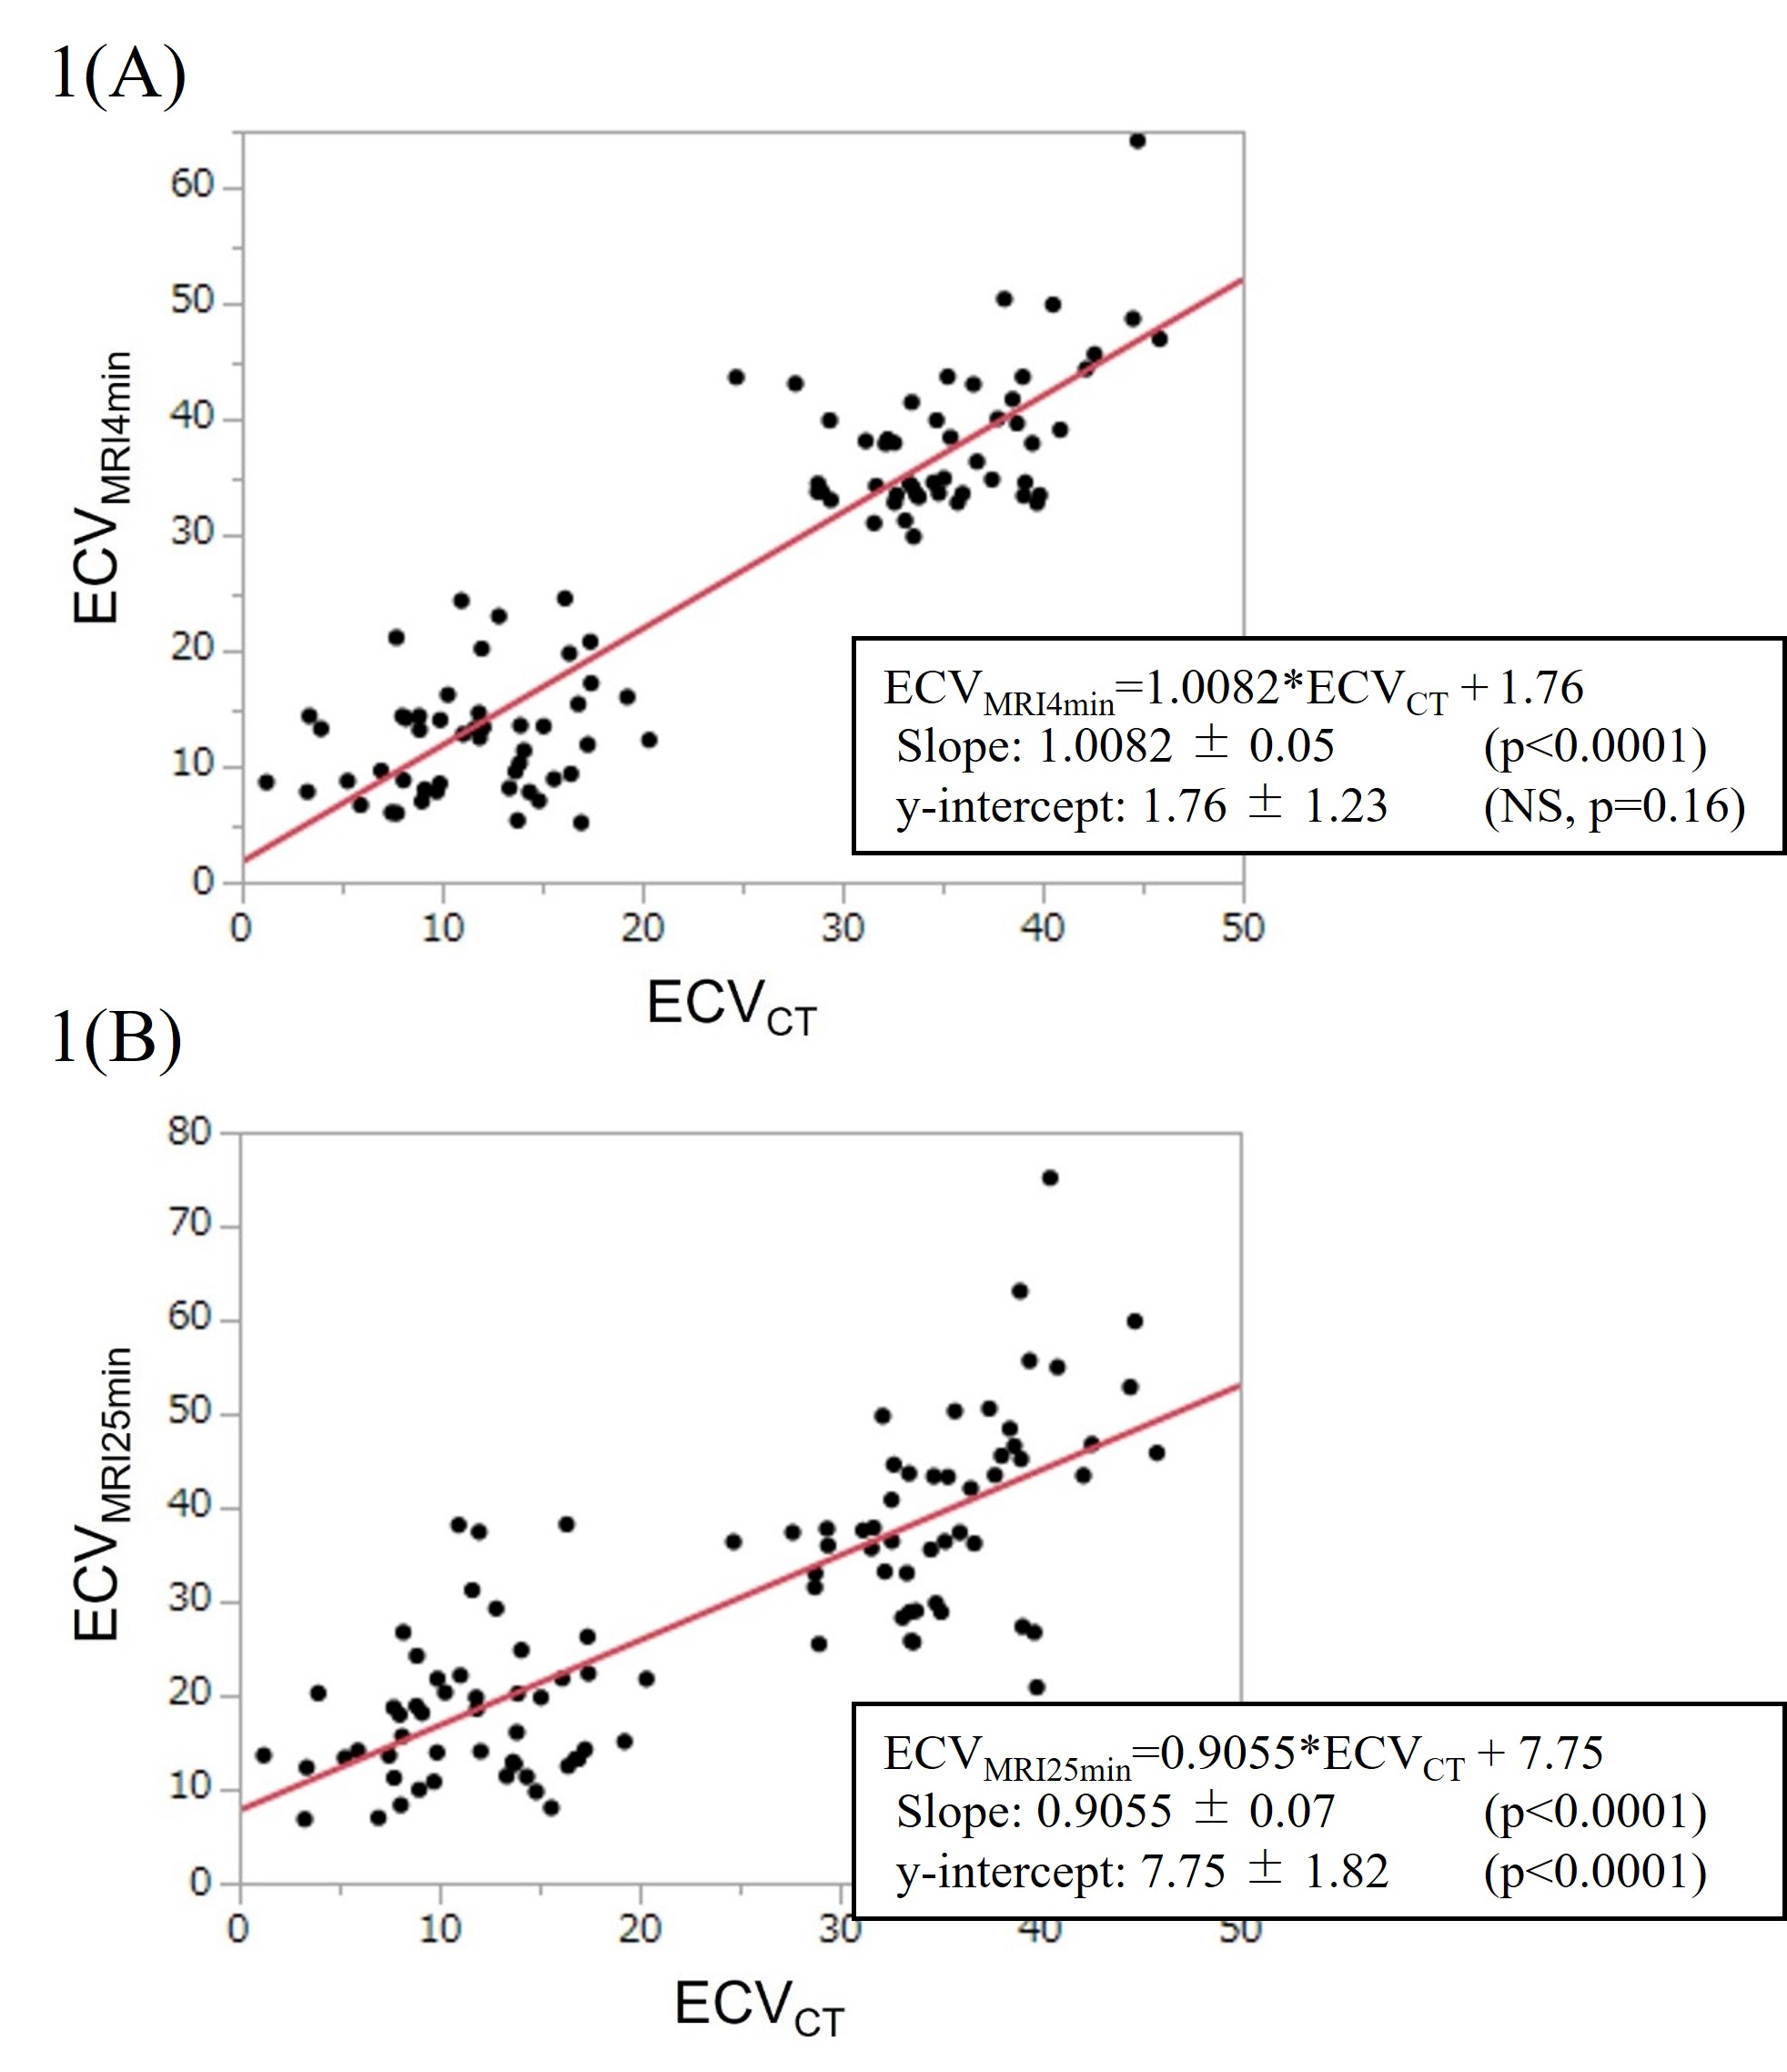
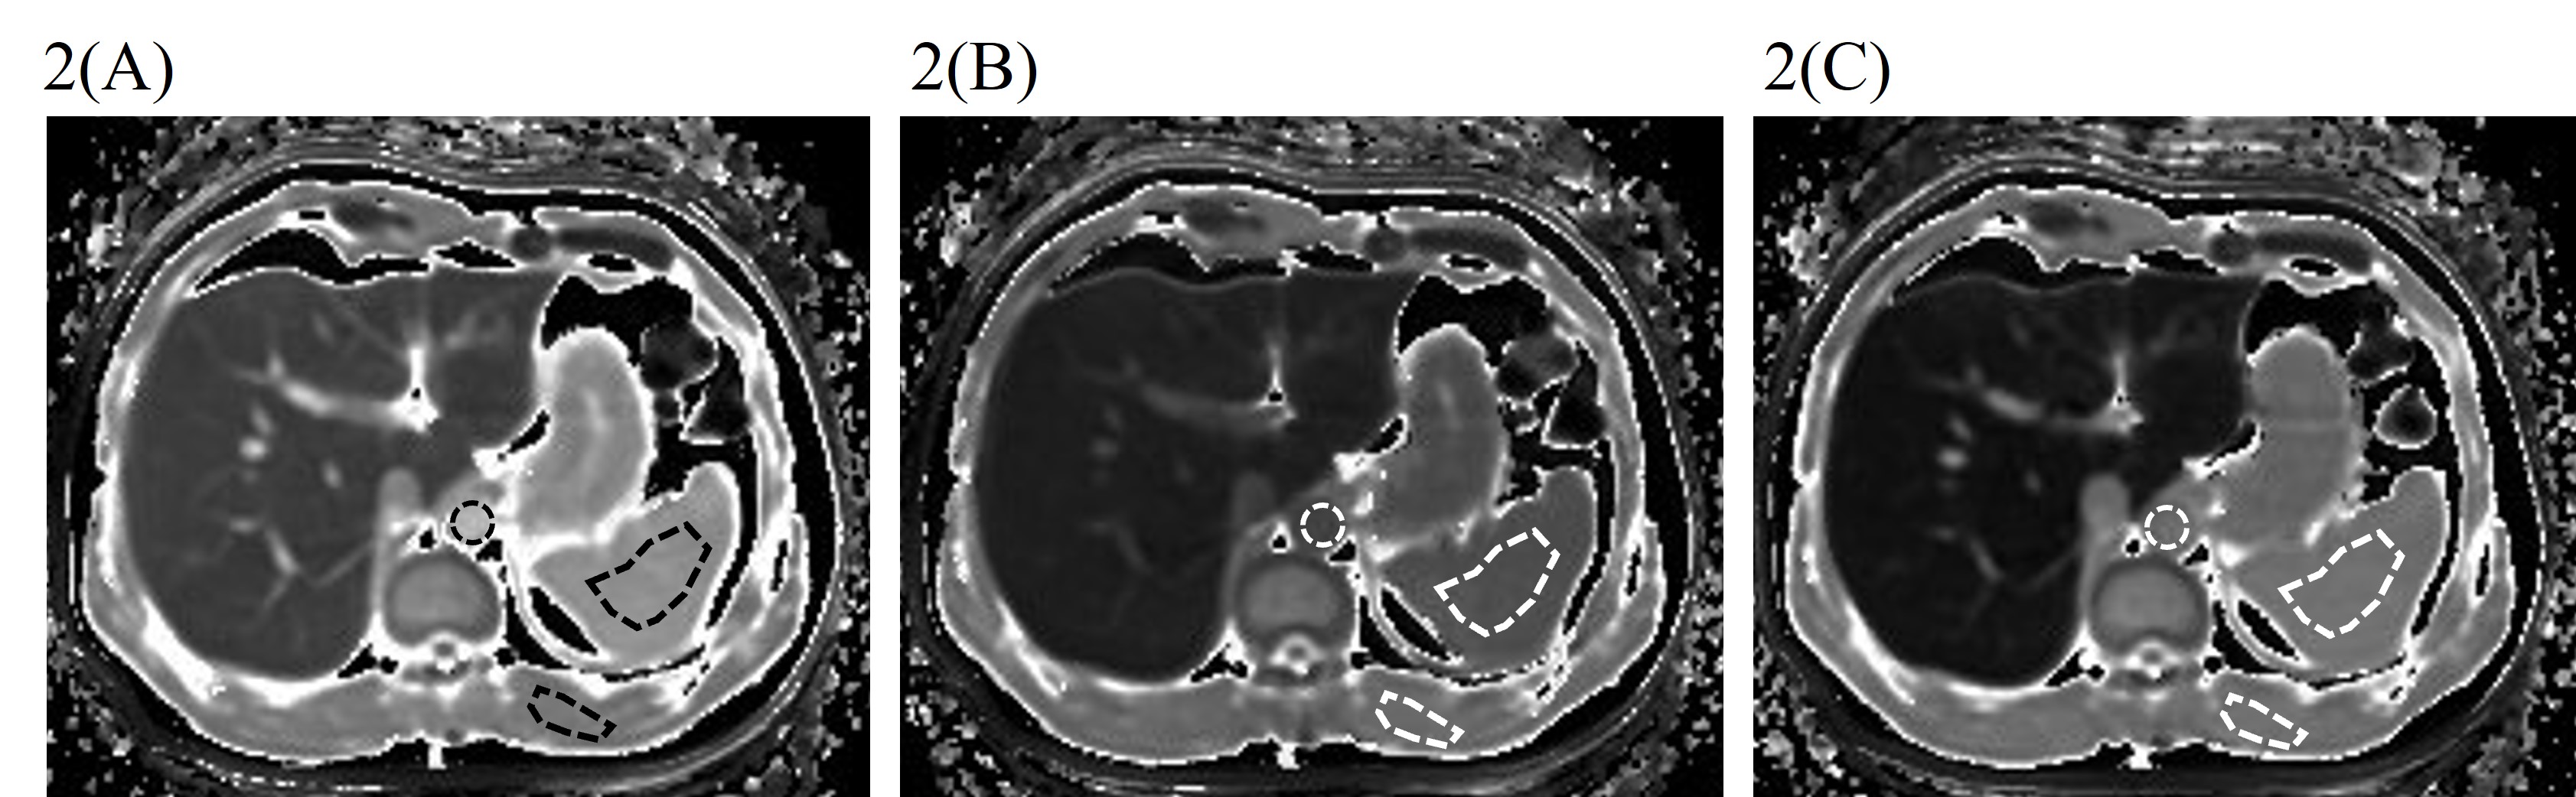
In the phantom study, T1MOLLI values were shown to be strongly dependent on the pattern of heartbeat and recovery time rather than matrix size. T1MOLLI values with 3(3)3(3)3(3)3(3)3 were most close to T1IR values (Table 3). In the clinical study, ECVs obtained from EOB-MRI showed significantly high agreements with those obtained from CT data. Interclass correlation coefficients (ICC) were 0.90 and 0.74 (both p<0.001) for 4min and 25 min images, respectively (Fig. 1). The representative T1 maps before, 4 min after, and 25 min after Gd-EOB-DTPA administration were shown in Fig.2.DISCUSSION
The accuracy of T1MOLLI was different among the acquisition schemes. As T1 value ranges widely from 300 to 1700 ms in abdominal organs on 3T 4, it is important to optimize the SPGR-MOLLI acquisition scheme to ensure the accuracy of T1 measurement with the wide range. Our results in the phantom study suggested that the number of TIs is the most important parameter for the accurate measurement of T1 longer than 1000ms. In clinical study, we used ECV obtained from CT data (4 min delay for the equilibrium phase) as reference standard. Theoretically, agreement between 25 min ECV from EOB-MRI and 4 min ECV from CT should not be good, nevertheless, relatively good ICC of 0.73 was obtained, suggesting equilibrium phase status might be similar between 4 min and 25 min. On the other hand, agreement between 4 min ECVs from EOB-MRI and CT was excellent (ICC 0.9), as readily expected.CONCLUSION
SPGR-MOLLI acquisition scheme was optimized for abdominal T1 mapping in EOB-MRI in the phantom study. It was demonstrated in the clinical study that splenic and muscular ECVs in EOB-MRI were well correlated with those with contrast-enhanced CT. In the future study, application of ECVMRI to the liver parenchyma or focal liver lesion is being considered.Acknowledgements
We thank the MRI staff for their assistance in this study.References
1. Shinagawa Y, Sakamoto K, Sato K, et al. Usefulness of new subtraction algorithm in estimating degree of liver fibrosis by calculating extracellular volume fraction obtained from routine liver CT protocol equilibrium phase data: Preliminary experience. European Journal of Radiology 2018; 103:99–104
2. Kupczyk PA, Mesropyan N, Isaak A, et al. Quantitative MRI of the liver : Evaluation of extracellular volume fraction and other quantitative parameters incomparison to MR elastograhy for the assessment of hepatopathy. Magnetic Resonance Imaging 2021;77: 7-13
3. Tani T, Sato K, Sakamoto K, et al. Importance of extracellular volume fraction of the spleen as a predictive biomarker for high-risk esophago-gastric varices in patients with chronic liver diseases: A preliminary report. Eur J Radiol 2021 Oct;143:109924.
4. Bazelaire CMJ, Duhamel GD, Rofsky NM et al. MR Imaging Relaxation Times of Abdominal and Pelvic Tissues Measured in Vivo at 3.0 T: Preliminary Results. Radiology 2004; 652-659
Figures