1610
Clinical application of MULTIPLEX as a rapid multi-parametric brain imaging method in early Parkinson’s disease1Department of Radiology, Nanjing first hospital,Nanjing Medical University, Nanjing, China, 2Department of Neurology, Nanjing first hospital,Nanjing Medical University, Nanjing, China, 3Central Research Institute, United Imaging Healthcare, Shanghai, China
Synopsis
Keywords: Quantitative Imaging, Multi-Contrast
Quantitative MRI can measure a variety of physiological tissue parameters, such as longitudinal T1 value, transverse T2 value and proton density, iron content and fat content. We tried to apply a multi-parametric MR imaging technique of MULTIPLEX that provides the maps of T1, T2*, proton density and quantitative susceptibility mapping into the diagnosis of early Parkinson’s disease (PD). We found that MULTIPLEX could provide comprehensive and quantitative assessment of Parkinson’s disease-related subcortical nucleus and dopaminergic midbrain regions captured in multiple MR imaging parameters, which might assist in the diagnosis and better understanding of early Parkinson’s disease under tight clinical time-constraints.Parkinson’s disease (PD) is characterized by the classical motor features of parkinsonism. Magnetic resonance imaging (MRI), including T1, T2*, Neuromelanin-Sensitive imaging, Susceptibility weighted imaging (SWI) and quantitative susceptibility mapping (QSM), has proved to provide multiple index to make diagnosis and further understand the complex pathological progress of PD[1–4]. Complex MRI sequence obtaining more imaging index requires longer time than standard clinic MR scanning, which subsequently requires longer time for patients to keep still for MR imaging. However, with tremor and bradykinesia symptoms, long time stillness for MRI scanning would be problematic for PD patients. Accelerated whole-brain multi-parametric MR imaging to acquire quantitative multi-contrast information is needed. MULTIPLEX is a single-scan 3D multi-parametric MR imaging, providing qualitative and quantitative images T1, T2*, proton density maps, SWI and QSM information with a scanning time of 10:15 minutes [5]. This study aimed to investigate its feasibility of clinical application in early Parkinson’s disease.
Methods
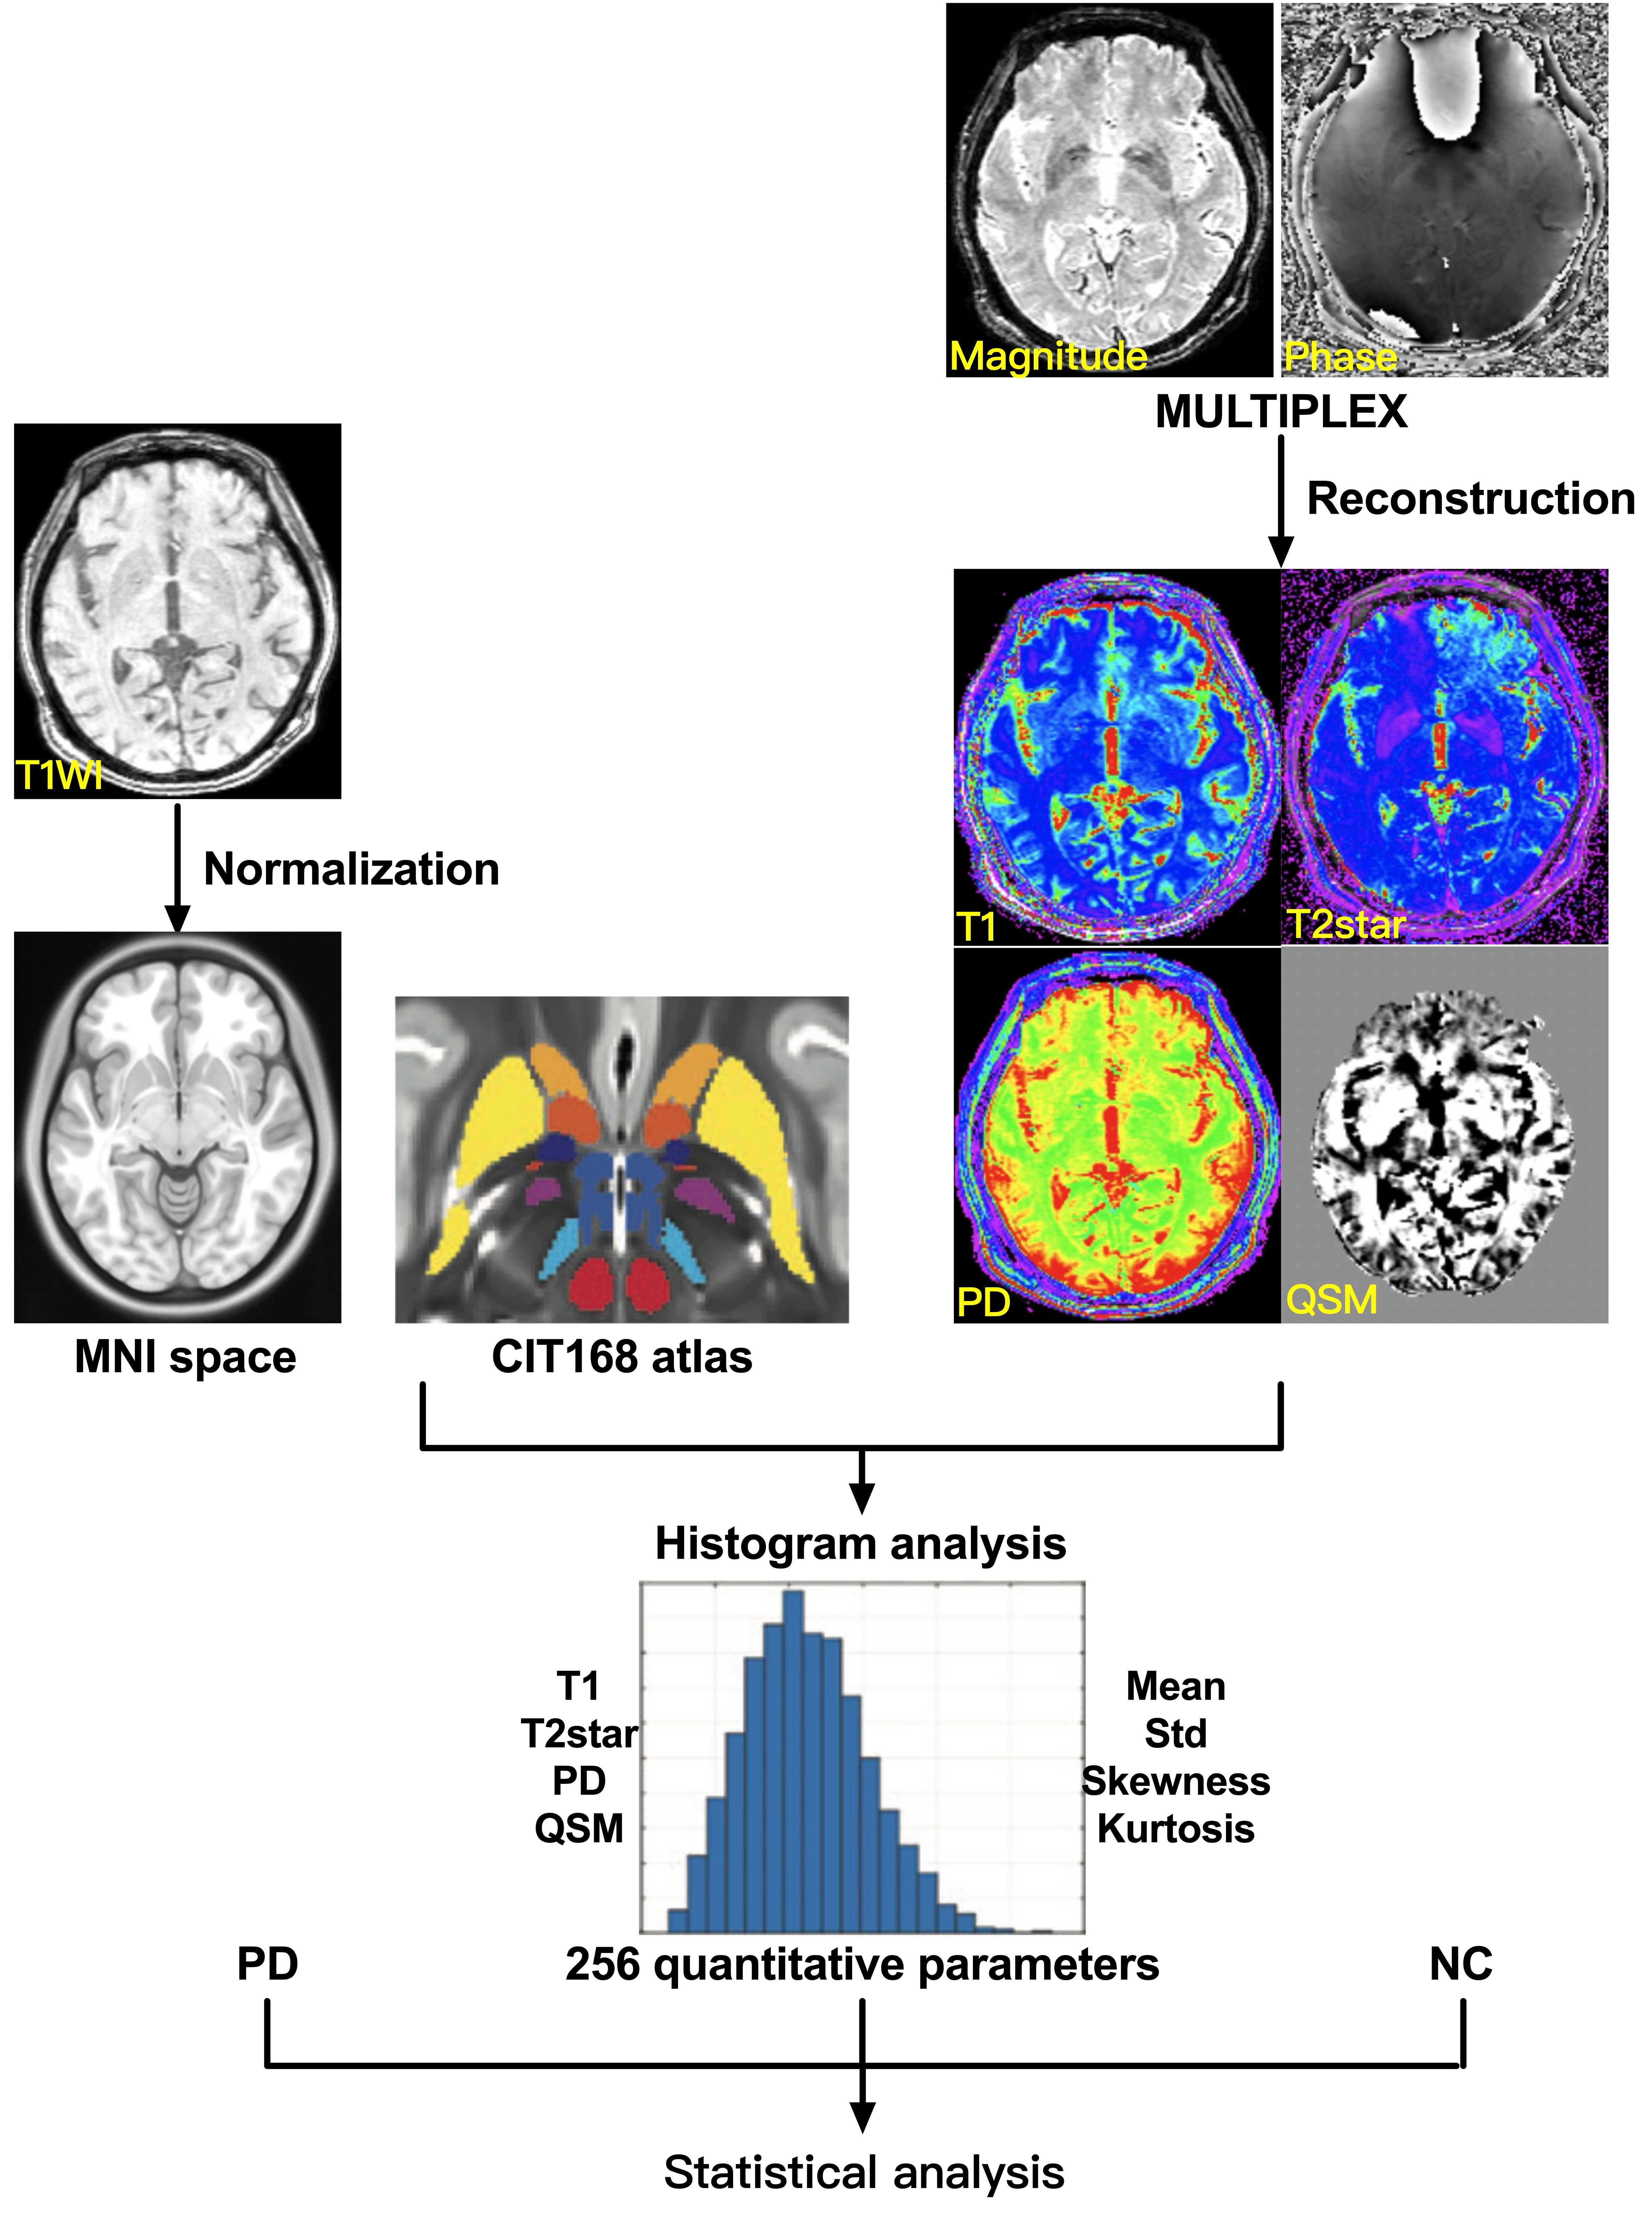
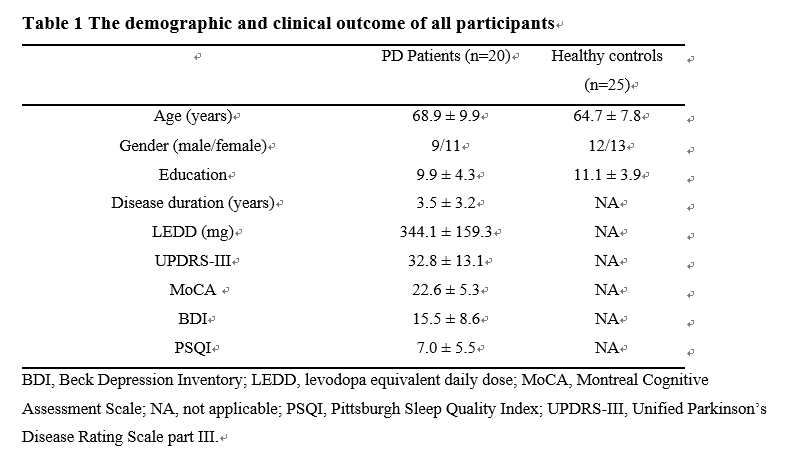
We recruited 20 early Parkinson’s disease patients (age range: 54-84 years, disease duration: 1-5 years) and 25 healthy control (HC) subjects who underwent MULTIPLEX acquisition in a 3T MRI system (uMR 780, United Imaging Healthcare, Shanghai, China). First, we explored the feasibility of MULTIPLEX (10:15 minutes scan time) for its use in clinical routine imaging, focusing on image reconstruction, parameter estimation, and contrast-weighted image synthesis. Second, according to the CIT168 atlas, the ROI-based analysis was conducted to extract quatitative parameters using histogram analysis and then identify abnormal T1, T2*, proton density maps and QSM values from the 16 human subcortical brain nuclei. The first group includes subcortical nuclei that are, either directly or indirectly, modulated by dopamine release, and guide behavior, including the caudate nucleus (Ca) and putamen (Pu), and downstream areas such as the external and internal segments of the globus pallidus (GPe and GPi, respectively), the subthalamic nucleus (STH), and the substantia nigra pars reticulata (SNr). The second group of nuclei drive activity in the dopaminergic midbrain and include the hypothalamus (HTH), habenular nucleus (HN), ventral pallidum (VeP), and the nucleus accumbens (NAC). The third group is comprised of the dopaminergic midbrain regions, including the substantia nigra pars compacta (SNc), parabrachial pigmented nucleus (PBP), and the ventral tegmental area (VTA). The final group consists of landmark structures including the extended amygdala (EXA), red nucleus (RN), and mammillary nucleus (MN). The flowchart of the study is illustrated in Figure 1.
Results
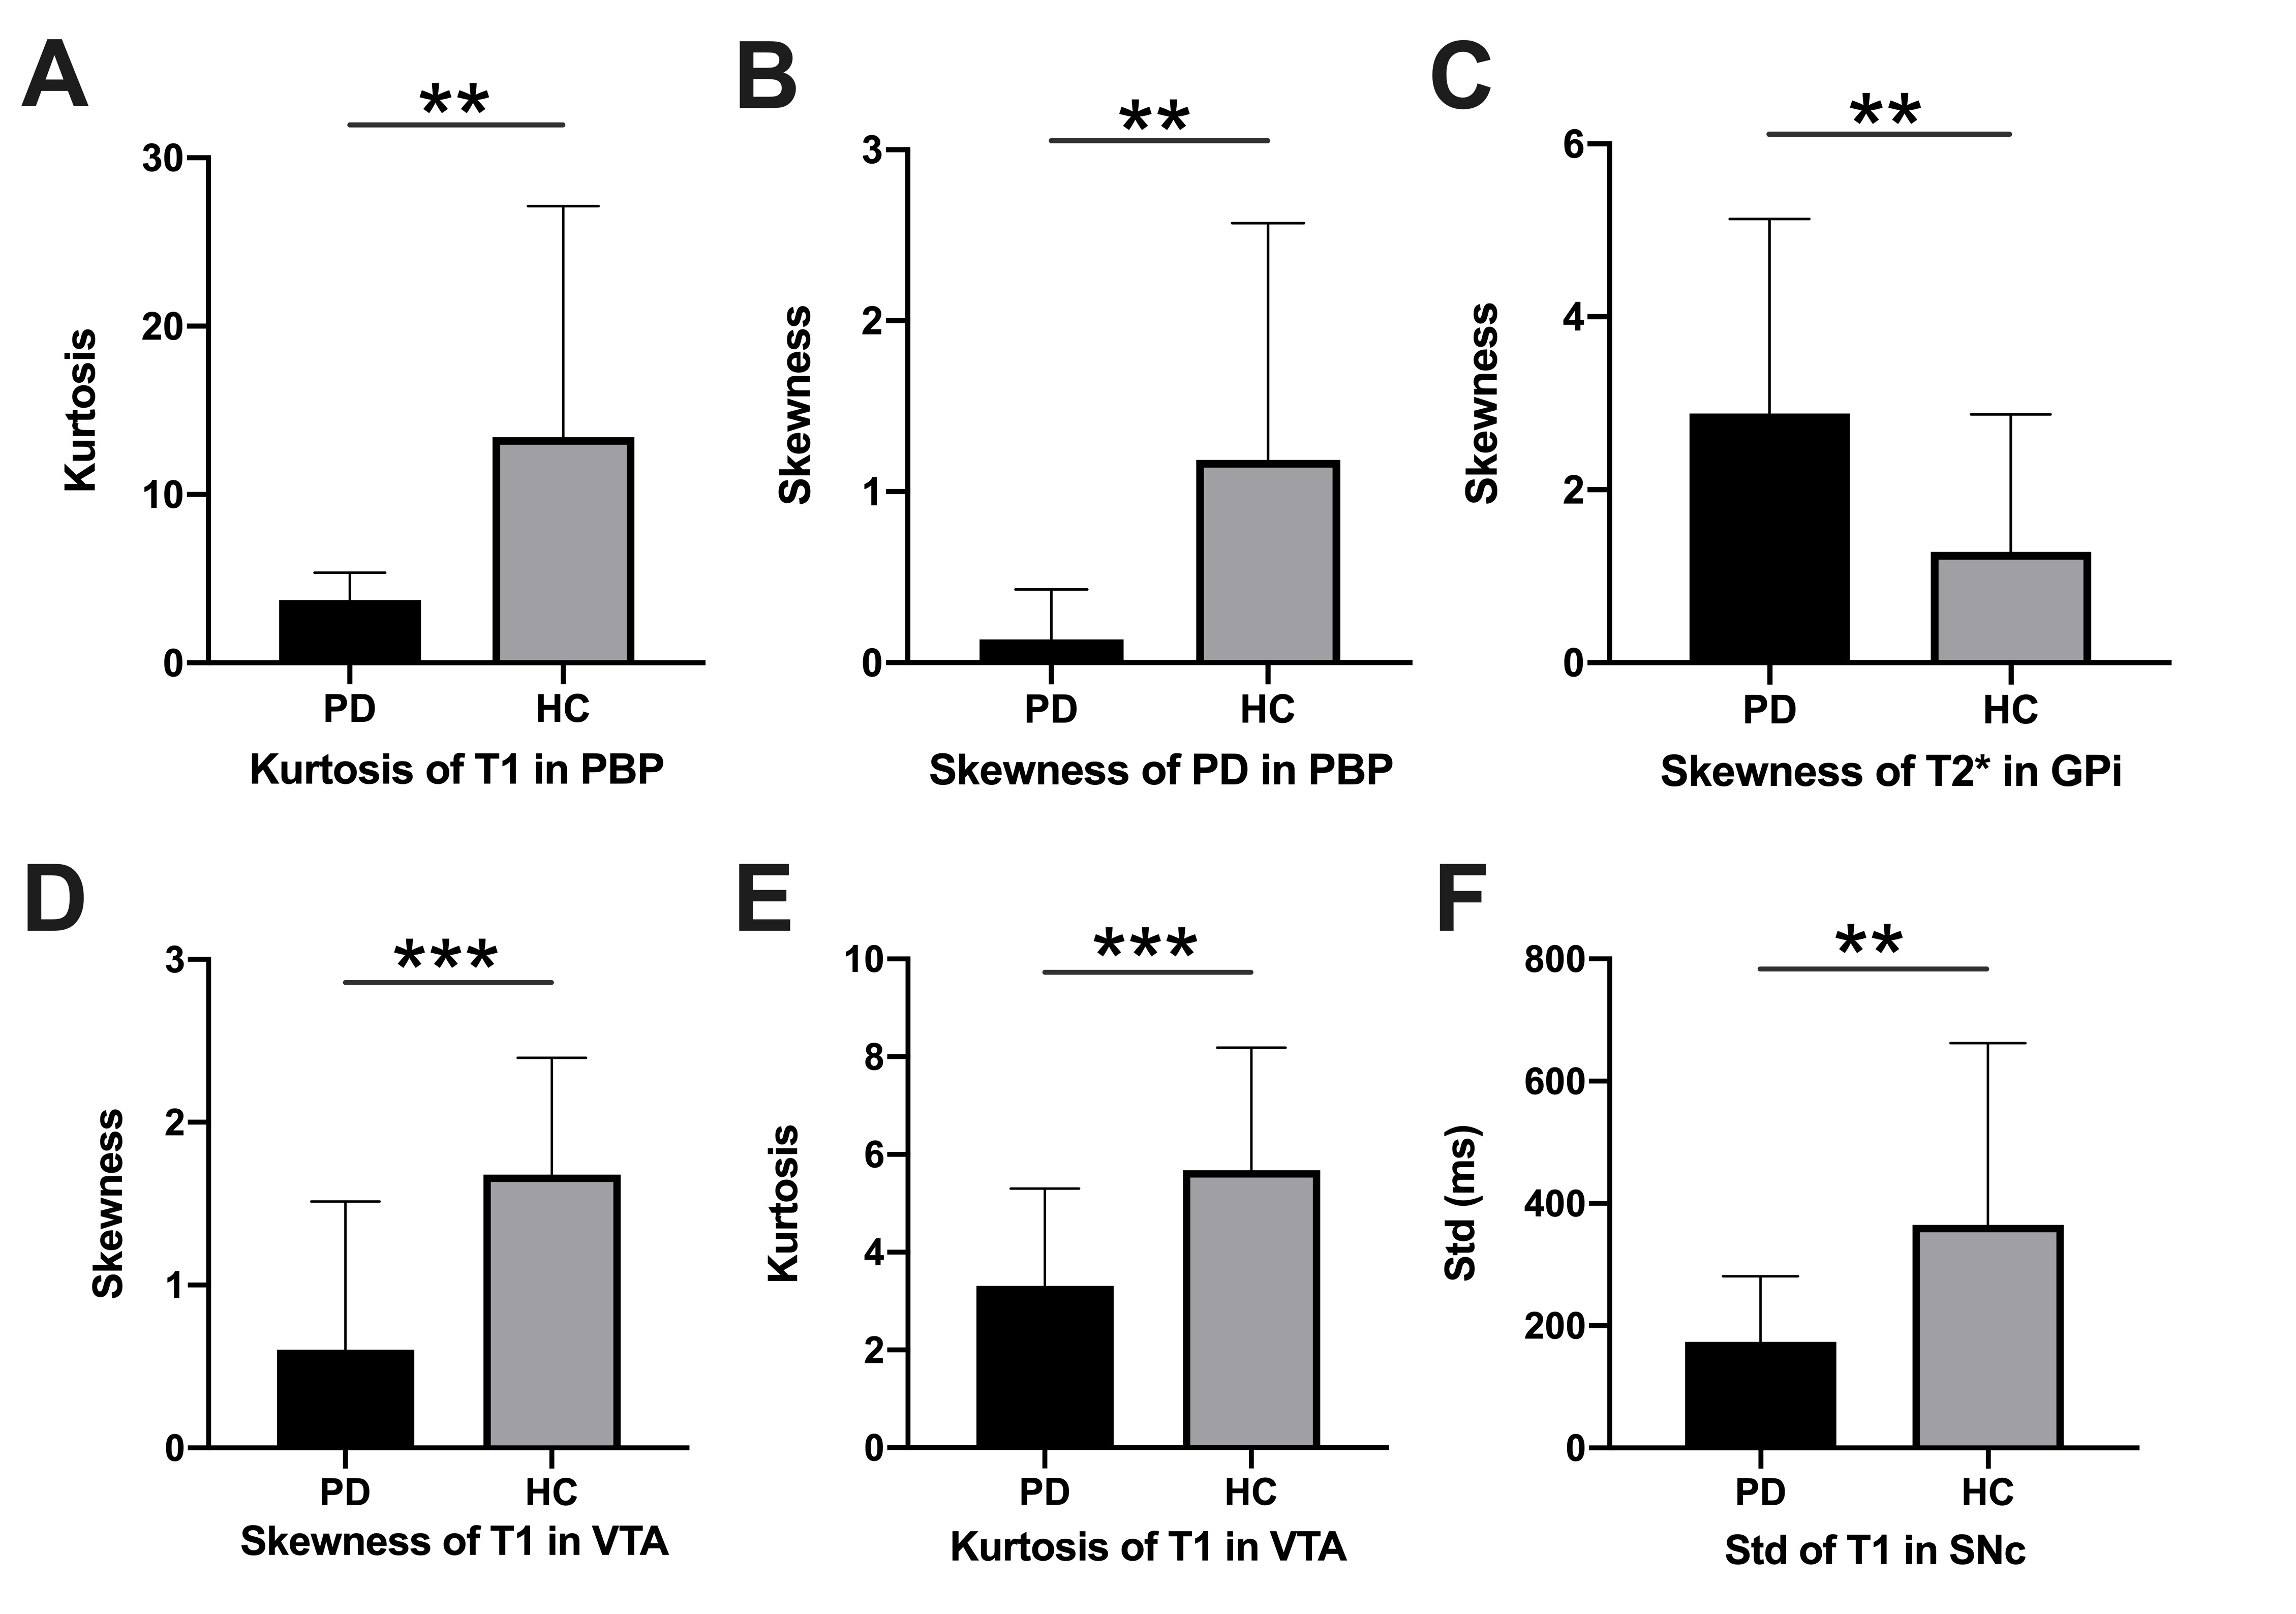
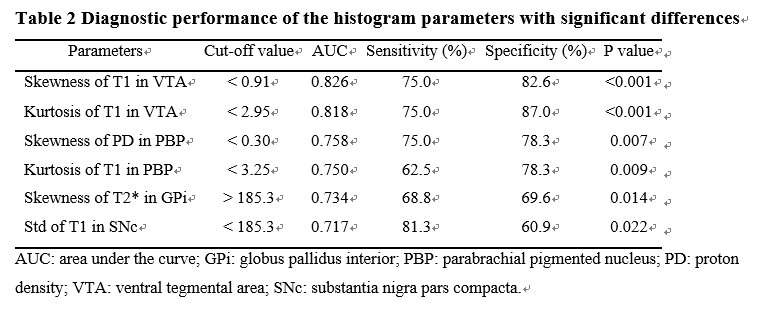
The demographic characteristics and clinical assessment of all participants were summarized in Table 1. All image reconstruction and processing were automatically performed using in-house C++ programs on the ADEPT (United Imaging Healthcare, Shanghai, China) platform. The MULTIPLEX produced T1, T2*, PD maps and susceptibility-weighted images and the corresponding quantitative maps (1×1×1 mm3 voxel size) without any extra scan time. The ROI-based analysis revealed significantly decreased kurtosis of T1 in PBP, skewness of proton density maps in PBP, skewness and kurtosis of T1 in VTA, standard deviation of T1 in SNc and increased skewness of T2* in GPi in PD patients, compared to HC (all p values < 0.01, after false discovery rate correction; Figure 2). Moreover, the diagnostic performance of these six quantitative parameters was listed in Table 2, using the ROC analysis.
Discussion & Conclusion
Our results derived from MULTIPLEX provided multiple imaging information showed consistency to previous studies which would help for early PD diagnosis and better understand the hetergenerity of the pathology of PD. The alteration index of T1 and PD maps in PBP, T1 in VTA, T1 in SNc and T2* in GPi showed consistency to previous studies of PD[4, 6–8]. The alteration of these structure implied the dysfunction of dopaminergic neurons and its projection in PD pathology progress. Our PD patients showed no positive results in QSM, which might attribute to their early disease phase with no obviously higher iron content in these anatomic structures.The diagnostic value of our quantitative parameters were validated with dedicated algorithm to achieve AUC from 0.717-0.818, which imply the robustness of our results. Comparing with previous representative multiple parametric methods, MULTIPLEX showed advantages in improvement of SNR and flexibility[5, 9]. Our promising findings warrant further validation with larger sample size and advanced PD patients in the future. In conclusion, MULTIPLEX could provide comprehensive and quantitative assessment of Parkinson’s disease-related ubcortical nucleus and dopaminergic midbrain regions captured in multiple MR imaging parameters. MULTIPLEX is a promising MR sequence to apply in clinic for time saving to prevent PD patients from unbearable long time of MR examination. It has potential to assist in the diagnosis of early Parkinson’s disease and better understanding of early Parkinson’s disease.
Acknowledgements
No acknowledgement found.References
1. Biondetti E, Santin MD, Valabrègue R, et al. The spatiotemporal changes in dopamine, neuromelanin and iron characterizing Parkinson’s disease. Brain https://doi.org/10.1093/brain/awab191.
2. Fu T, Klietz M, Nösel P, et al. Brain Morphological Alterations Are Detected in Early‐Stage Parkinson’s Disease with MRI Morphometry. J Neuroimaging 2020;30:786–92.
3. Liu Y, Li J, He N, et al. Optimizing neuromelanin contrast in the substantia nigra and locus coeruleus using a magnetization transfer contrast prepared 3D gradient recalled echo sequence. Neuroimage 2020;218:116935.
4. He N, Ghassaban K, Huang P, et al. Imaging iron and neuromelanin simultaneously using a single 3D gradient echo magnetization transfer sequence: Combining neuromelanin, iron and the nigrosome-1 sign as complementary imaging biomarkers in early stage Parkinson’s disease. Neuroimage 2021;230:117810.
5. Ye Y, Lyu J, Hu Y, et al. MULTI-parametric MR imaging with fLEXible design (MULTIPLEX). Magn Reson Med 2022;87:658–73.
6. Schwarz ST, Xing Y, Tomar P, et al. In Vivo assessment of brainstem depigmentation in Parkinson disease: Potential as a severity marker for multicenter studies. Radiology 2017;283:789–98.
7. Huynh B, Fu Y, Kirik D, et al. Comparison of Locus Coeruleus Pathology with Nigral and Forebrain Pathology in Parkinson’s Disease. Mov Disord 2021;36:2085–93.
8. Prodoehl J, Planetta PJ, Kurani AS, et al. Differences in Brain Activation Between Tremor- and Nontremor-Dominant Parkinson Disease. JAMA Neurol 2013;70:100.
9. Haacke EM, Chen Y, Utriainen D, et al. STrategically Acquired Gradient Echo ( STAGE ) imaging , part III : Technical advances and clinical applications of a rapid multi-contrast multi-parametric brain imaging method. 2020;65:15–26.
Figures