1609
T1 mapping of the pancreas in patients with pancreatic cancer—does pancreatic extracellular volume fraction increase the diagnostic value?1The Cancer Hospital of the University of Chinese Academy of Sciences (Zhejiang Cancer Hospital), Institute of Basic Medicine and Cancer (IBMC), Chinese Academy of Sciences, Hangzhou, China, 2Philips Healthcare, Beijing, China
Synopsis
Keywords: Quantitative Imaging, Quantitative Imaging
There was no related study focused on pancreatic cancer, and we have no idea whether T1 mapping and ECV fraction could be used in such patients. Our study was to evaluate whether the T1 relaxation time of the pancreas can detect parenchymal changes in pancreatic cancer (PC) patients and whether extracellular volume (ECV) fraction improves the diagnostic value.
We found that native T1 relaxation time of the pancreas in patients with PCs was significantly higher than patients with Non-PCs and volunteers, respectively. The pancreatic ECV was failed to show a significant difference among three groups.
Introduction
Pancreatic cancer (PC) is a highly malignant tumor, as with fibrosis being one of the dominant pathologic features, closely relating to therapeutic effect, occurrence, and prognosis (1). Hence, assessing fibrosis level might be more precise than either response evaluation criteria in solid tumors score or even pathological regression grade (2). Recently, T1 relaxation time mapping has been used to evaluate the degree of fibrosis in chronic pancreatitis (3), or even assess pancreatic endocrine insufficiency (4). The extracellular volume (ECV) fraction is another parameter to reflect fibrosis, and could predict impaired glucose tolerance (5). There was no related study focused on pancreatic cancer, and we have no idea whether T1 mapping and ECV fraction could be used in such patients.Purpose
To evaluate whether the T1 relaxation time of the pancreas can detect parenchymal changes in PC patients and whether ECV fraction improves the diagnostic value.Methods
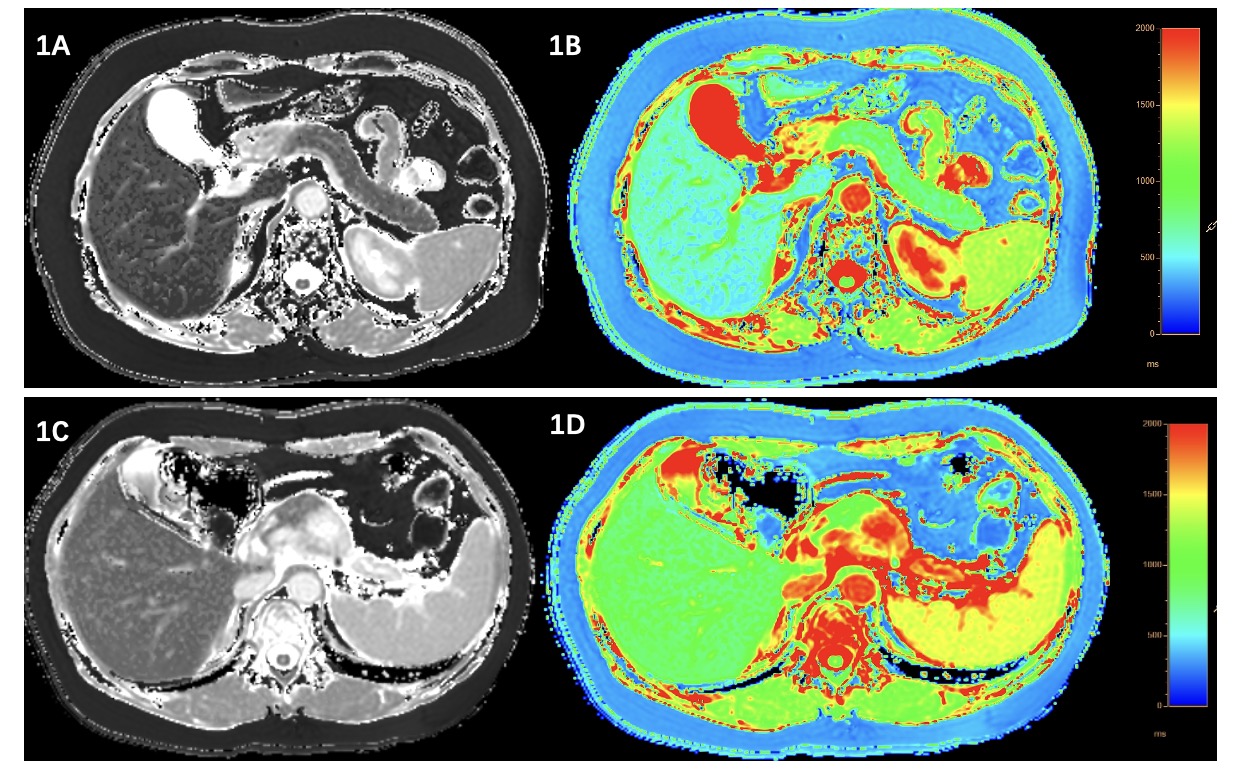
This prospective study was conducted between 01/02/2021 to 30/10/2022. Contrast-enhanced pancreatic MRI (Ingenia CX, Philips Healthcare, the Netherlands) including native and post-contrast T1 mapping, was performed in 45 patients with PCs, 14 patients with other solid pancreatic lesions but non-pancreatic cancers (NPC), and 16 patients with normal pancreas (NP) (volunteers) served as control. Modified Look-Locker inversion recovery sequence (MOLLI) was exploited to perform T1 mapping scan before and after administration of contrast agent. The parameters were: TR/TE of 2.4/1.1 ms; flip angle of 20°; slice thickness of 5 mm; field-of-view of 360 × 380 mm; matrix of 180 × 190 pixels. Two radiologists evaluated all images by consensus at the Philips IntelliSpace Portal workstation without knowing any clinical information. T1 relaxation time of the lesion, pancreas, and aorta were extracted. The region of interest (ROI) was manually draw carefully to avoid vessels, artifacts, and pancreatic duct. Pancreatic ECV was calculated as follows: Pancreatic ECV (%) = (1/T1 pancreas post-contrast - 1/T1 pancreas native)/(1/T1 aorta post-contrast – 1/T1 aorta native) × (100 - hematocrit). For statistics, χ2 test or Mann-Whitney U test was used to compare the difference among three groups. The intraclass correlation coefficient (ICC) was measured with ten patients. (Figure1)Results
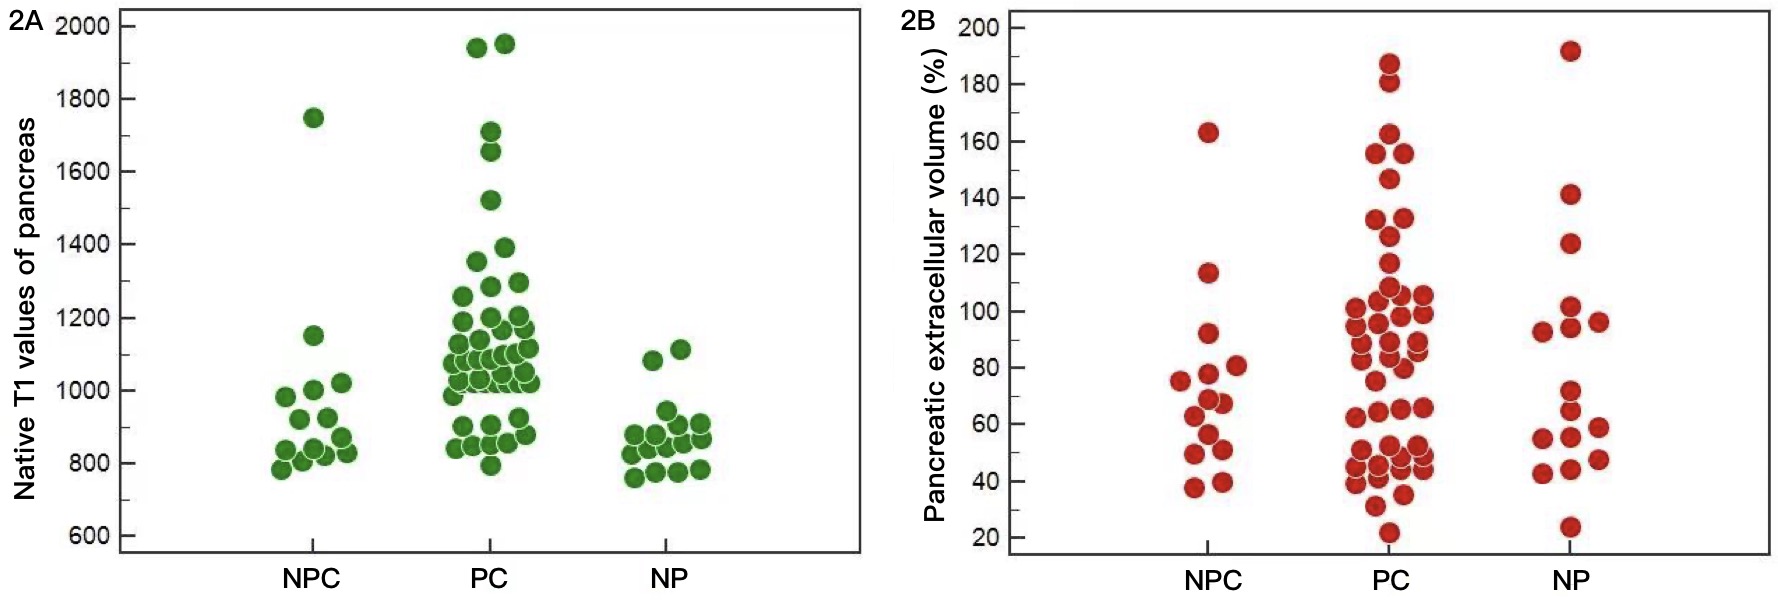
The ICC values were stable, ranging from 0.902-0.999. There was no significant difference found in sex, age and hematocrit among three groups (P > 0.05). Native T1 relaxation time of the PC was higher than NPC (1629.3 ± 171.0 ms vs. 1544.1 ± 308.7 ms), however, it did not reach the level of significance. Native T1 relaxation time of the pancreas in patients with PCs was significantly higher than patients with NPCs and volunteers, respectively (1141.5 ± 265.0 ms vs. 968.7 ± 247.7 ms/878.3 ± 101.0 ms, P < 0.05), while no difference was evident in patients with NPCs and volunteers (Figure 2A). The pancreatic ECV of PC, NPC, NP group was 87.8 ± 41.7 %, 74.2 ± 32.8 % and 81.8 ± 43.2 %, respectively, but we failed to show a significant difference among three groups (P > 0.05) (Figure 2B). There was no significant difference in post-contrast T1 relaxation time of lesions and pancreas in three groups.Discussion
The most compelling result in our study was that a significant correlation was confirmed between native T1 mapping values and pancreatic cancers, which indicating that T1 relaxation of pancreas could be used as potential predictors for the assessment of fibrosis. Native T1 mapping could reflect inflammation of autoimmune pancreatitis and predict their treatment response (6), which gave us a hint that changes during chemotherapy in patients with PCs might be predicted through T1 mapping values due to changes of fibrosis and inflammation (1). Another interesting observation of our study was that pancreatic ECV fraction did not improve the diagnostic performance in patients with PCs. In Noda et al’s study (5), the pancreatic ECV could reflect subtle changes in patiens with impaired glucose tolerance, they found that ECV was even more sensitive to represent pancreatic fibrosis compared with native T1 value, which indicating that ECV could provide more potential biomarkers than existing MRI sequences. However, in our preliminary research, we initially explored the relationship between ECV and PC, but with no significant difference was built in this study. Robust conclusion cannot be settle based upon existing results alone, and more data was needed to verify our results in the future.Conclusions
Native T1 relaxation of pancreas could be as a potential imaging biomarker for the evaluation of pancreatic fibrosis in patients with pancreatic cancers. However, the pancreatic ECV did not improve the diagnostic performance in this research.Acknowledgements
No acknowledgements found.References
1. Huang C, Iovanna J, Santofimia-Castaño P. Targeting Fibrosis: The Bridge That Connects Pancreatitis and Pancreatic Cancer. Int J Mol Sci 2021;22(9).
2. Erstad DJ, Sojoodi M, Taylor MS, Jordan VC, Farrar CT, Axtell AL, Rotile NJ, Jones C, Graham-O'Regan KA, Ferreira DS, Michelakos T, Kontos F, Chawla A, Li S, Ghoshal S, Chen YI, Arora G, Humblet V, Deshpande V, Qadan M, Bardeesy N, Ferrone CR, Lanuti M, Tanabe KK, Caravan P, Fuchs BC. Fibrotic Response to Neoadjuvant Therapy Predicts Survival in Pancreatic Cancer and Is Measurable with Collagen-Targeted Molecular MRI. Clin Cancer Res 2020;26(18):5007-5018.
3. Cheng M, Gromski MA, Fogel EL, DeWitt JM, Patel AA, Tirkes T. T1 mapping for the diagnosis of early chronic pancreatitis: correlation with Cambridge classification system. Br J Radiol 2021;94(1121):20200685.
4. Higashi M, Tanabe M, Yonezawa T, Furukawa M, Iida E, Ito K. The pancreatic exocrine function in patients with pancreatic endocrine insufficiency: the evaluation with cine-dynamic magnetic resonance cholangiopancreatography using a spatially selective inversion-recovery pulse and T1 mapping. Jpn J Radiol 2022;40(7):696-702.
5. Noda Y, Goshima S, Tsuji Y, Kajita K, Akamine Y, Kawai N, Kawada H, Tanahashi Y, Matsuo M. Pancreatic extracellular volume fraction using T1 mapping in patients with impaired glucose intolerance. Abdom Radiol (NY) 2020;45(2):449-456.
6. Zhu L, Lai Y, Makowski M, Zhang W, Sun Z, Qian T, Nickel D, Hamm B, Asbach P, Duebgen M, Xue H, Jin Z. Native T1 mapping of autoimmune pancreatitis as a quantitative outcome surrogate. Eur Radiol 2019;29(8):4436-4446.
Figures