1608
T2 mapping with ZOOM-OLED on the kidney
Jian Wu1, Taishan Kang2, Simin Li1, Weikun Chen1, Zhigang Wu3, Congbo Cai1, and Shuhui Cai1
1Department of Electronic Science, Xiamen University, Xiamen, China, 2Department of Radiology, Zhongshan Hospital of Xiamen University, School of Medicine, Xiamen University, Xiamen, China, 3Clinical & Technical Solutions, Philips Healthcare, Shenzhen, China
1Department of Electronic Science, Xiamen University, Xiamen, China, 2Department of Radiology, Zhongshan Hospital of Xiamen University, School of Medicine, Xiamen University, Xiamen, China, 3Clinical & Technical Solutions, Philips Healthcare, Shenzhen, China
Synopsis
Keywords: Quantitative Imaging, Kidney
The overlapping-echo detachment (OLED) imaging can capture a T2 map within about 150 ms. However, when the region of interest (ROI) is smaller than the object, it is inefficient to acquire the whole object because many unnecessary phase-encoding steps should be acquired. The zonal oblique multislice (ZOOM) is a method to reduce the field of view (FOV) by using two pulses to excite two slabs that have a specific angle between them. This study combined ZOOM with OLED to capture the T2 map with reduced FOV. The ZOOM-OLED can reduce geometric distortion and improve image resolution.Introduction
The overlapping-echo detachment (OLED) imaging is a fast quantitative magnetic resonance imaging (MRI) method which can quantify multiple MR parameres within a single shot. As the EPI readout is used in data acquisition, OLED is sensitive to the B0 inhomogeneity, and the image resolution is limited. For the EPI-based sequence, reducing the field of view (FOV) in the phase-encoding direction can reduce the image distortion when the region of interest (ROI) is much smaller than the object. Zonal oblique multislice (ZOOM) is a technique that can reduce the FOV by rotating the excitation slab by a specific angle. Here, we combined OLED and ZOOM to obtain the T2 map with high image resolution and less geometric distortion. The ZOOM-OLED can obtain the T2 map in a single shot, which allows us to capture the real-time T2 values of the kidney without breath-hold.Methods
Pulse sequence design: The OLED sequence can be easily combined with the ZOOM technique. The ZOOM-OLED sequence is shown in Figure 1c. Two excitation RF pulses are applied to generate two magnetization pathways (Figure 1b) that can be considered replicas of the k-space signal with different T2 weightings. The excitation and refocusing slabs have a specific angle (Figure 1a). Before the two excitation pulses, regional saturation (RS) pulses are used to suppress the signals outside the ROI.Training samples generation: The open-source MRI simulation software (MRiLab) was used to generate the training samples. Details about training samples generation can be found in literature [1].
Reconstruction: The flowchart of T2 map reconstruction is shown in Figure 2. U-Net was used to reconstruct the T2 map from the acquired OLED image. At the training stage, we took the simulated OLED image as input, and the corresponding T2 map was taken as the label. At the testing stage, the acquired DICOM data were fed into the pre-trained U-Net to obtain the T2 map. Experiments: This study was approved by the IRB at Zhongshan Hospital of Xiamen University. One volunteer (male, age = 27) was recruited and imaged on a 3.0 T MR scanner (Ingenia CX, Philips Healthcare). The experiments were performed with the ZOOM-OLED sequence (TE/TR, 41 ms/2000 ms; FOV, 250 × 120 mm2; matrix, 125 × 60). The flip angle of the excitation pulses was α = 55°.
Results
The OLED image acquired with the original OLED technique was compared with that acquired with ZOOM-OLED (Figure 3), and the volunteer was scanned under free breathing. It shows that the stripe is finer in ZOOM-OLED image, resuting higher spatial resolution of the T2 map. The ZOOM-OLED scans were also performed multiple times with TR = 2000 ms. During the scan, the volunteer was asked to keep his breath. The reconstructed real-time T2 maps are shown in Figure 4. We can see that due to its ultrafast characteristic, ZOOM-OLED provides T2 maps without motion artifacts. The regions of interest (ROI) are located almost at the same place in different T2 maps. The boxplot of the T2 value for the ROI shown in Figure 4 (TR = 1) is given in Figure 5. The T2 variation could probably be attributed to the dynamic physiological process of the blood flow and the volunteer’s tiny movement.Conclusion
In this work, we proposed a fast quantitative MRI method, ZOOM-OLED, to obtain less-distortion and high-spatial-resolution T2 maps.Acknowledgements
This work was supported by the National Natural Science Foundation of China under grant number 11775184.References
[1] Ma LC, Wu J, et al. Single-shot multi-parametric mapping based on multiple overlapping-echo detachment (MOLED) imaging. Neuroimage, 2022, 263:119645.Figures
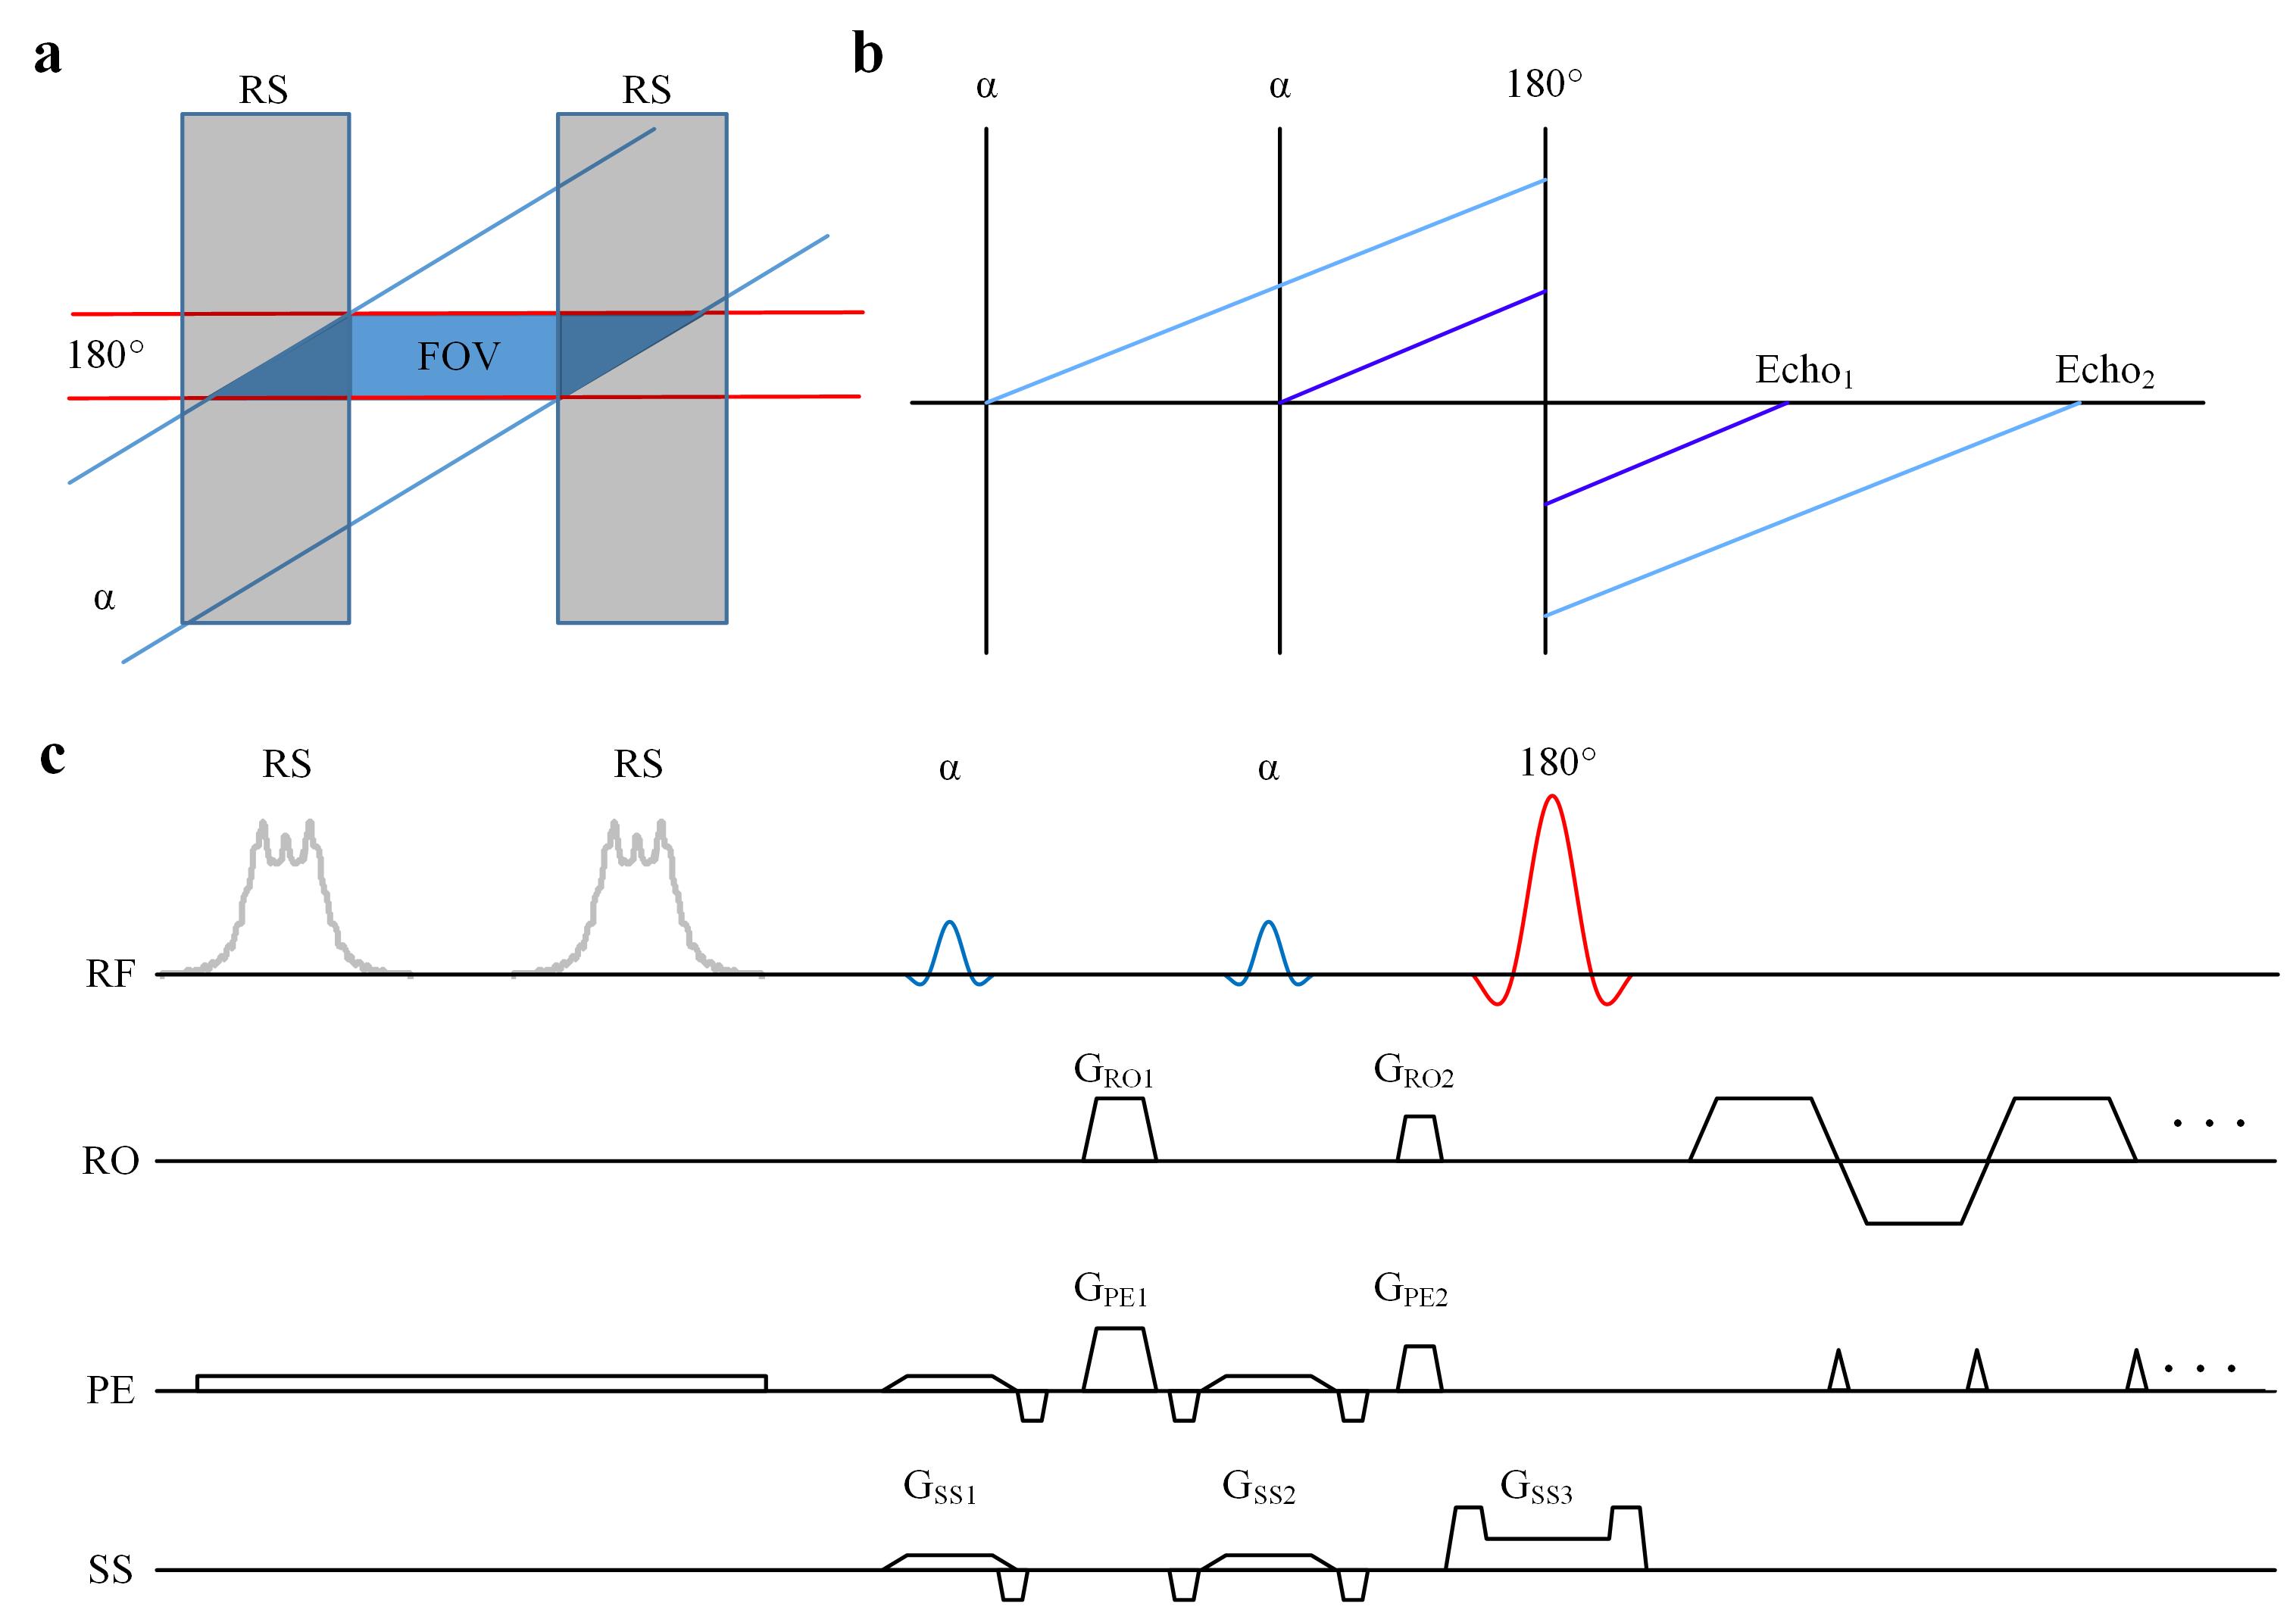
Figure 1 (a) The ZOOM technique. (b) The extended phase
graphs of OLED. The vertical lines represent the RF pulses, and the solid color
lines denote the pathways of spin echoes. (c) The ZOOM-OLED sequence.
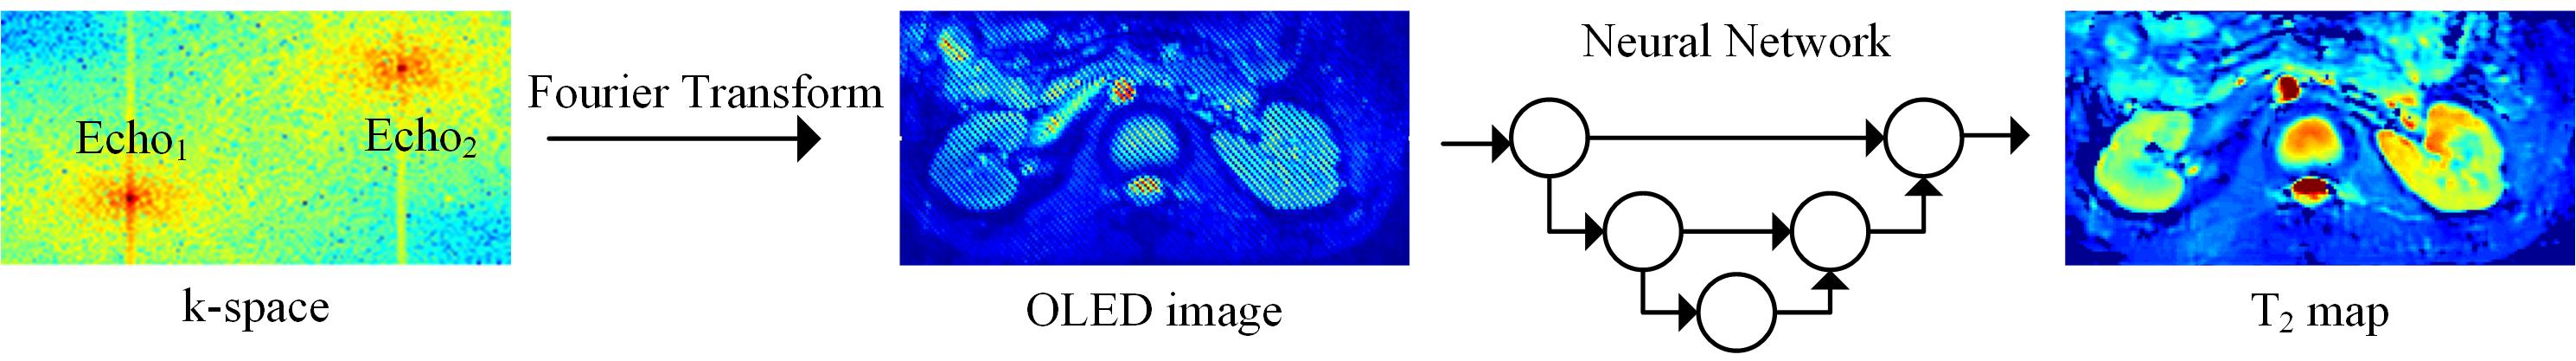
Figure 2 The flowchart
of T2 map reconstruction from the acquired OLED image.
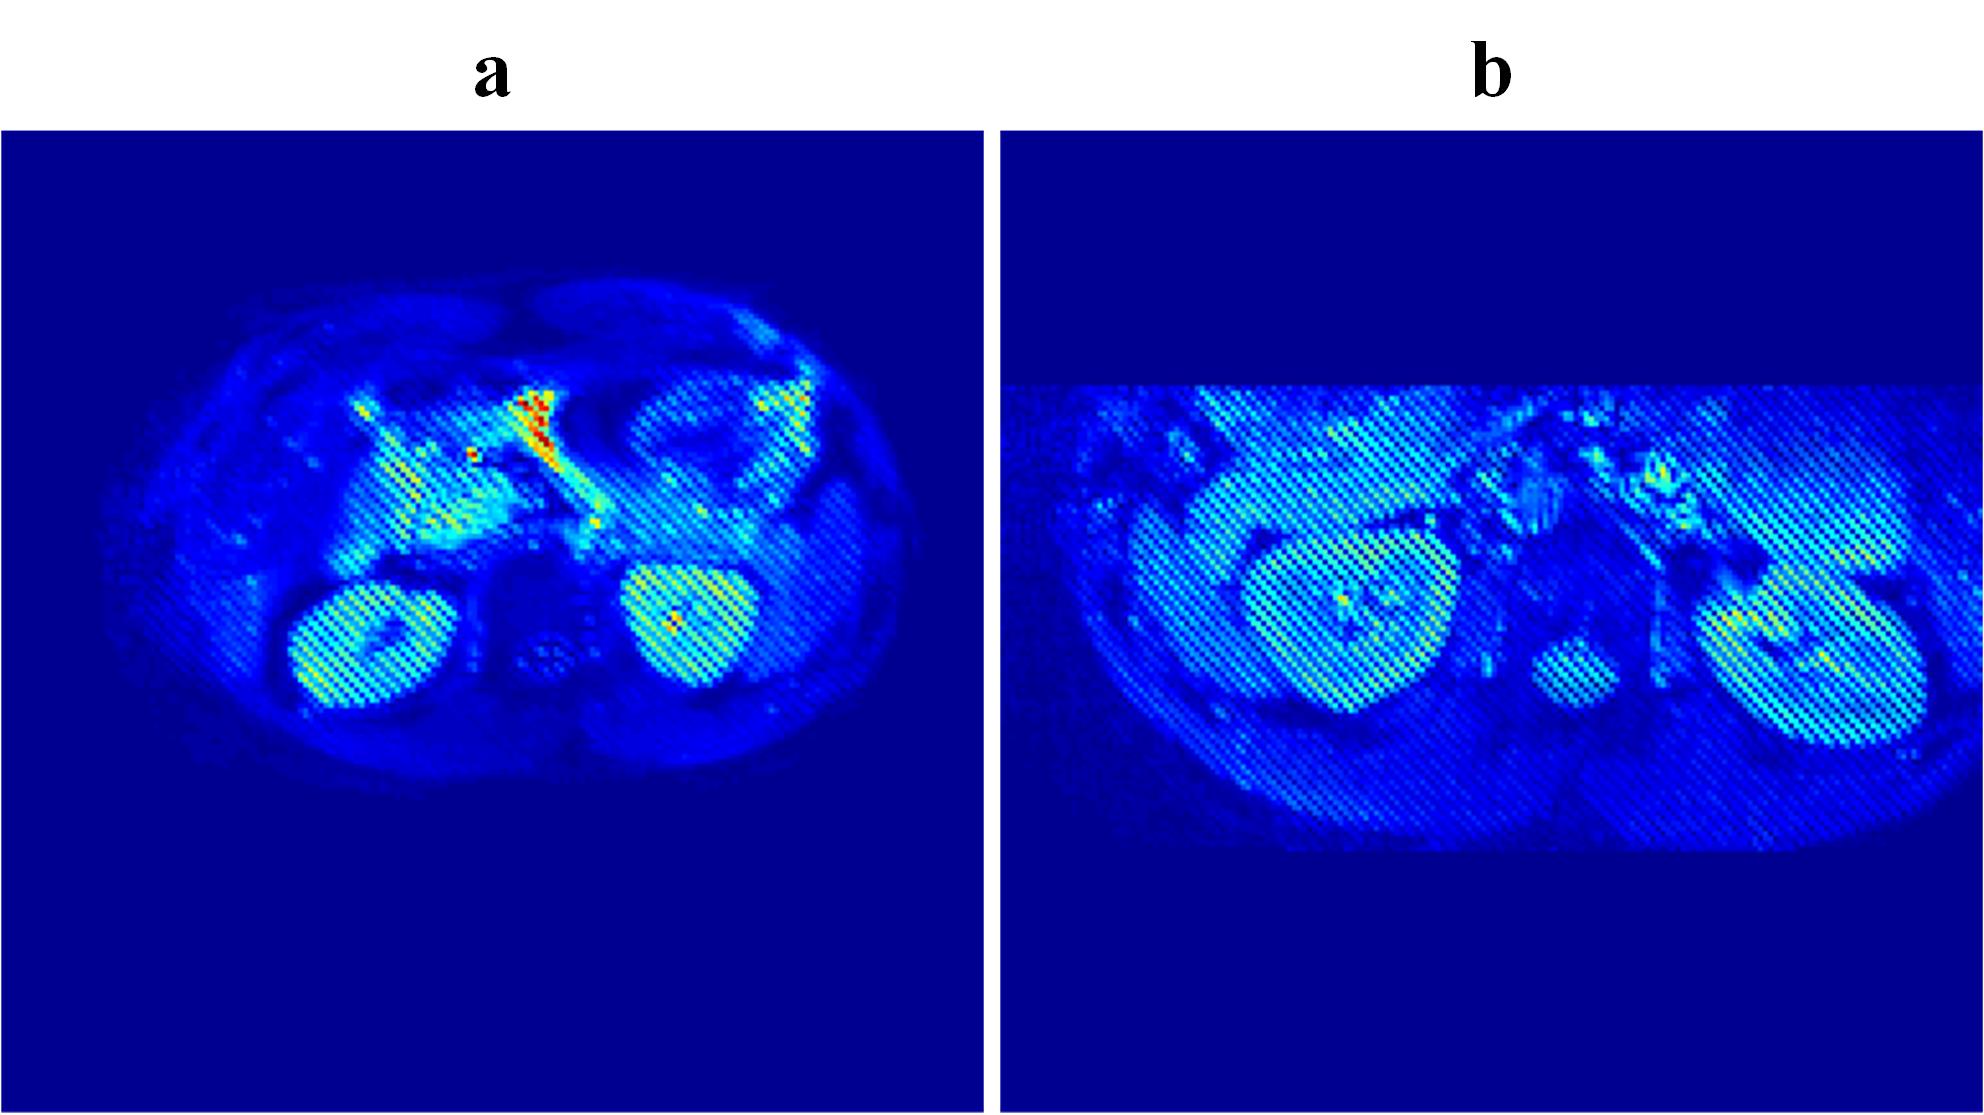
Figure 3 (a) The OLED image acquired without
the ZOOM technique. (b) The OLED image acquired with the ZOOM technique.
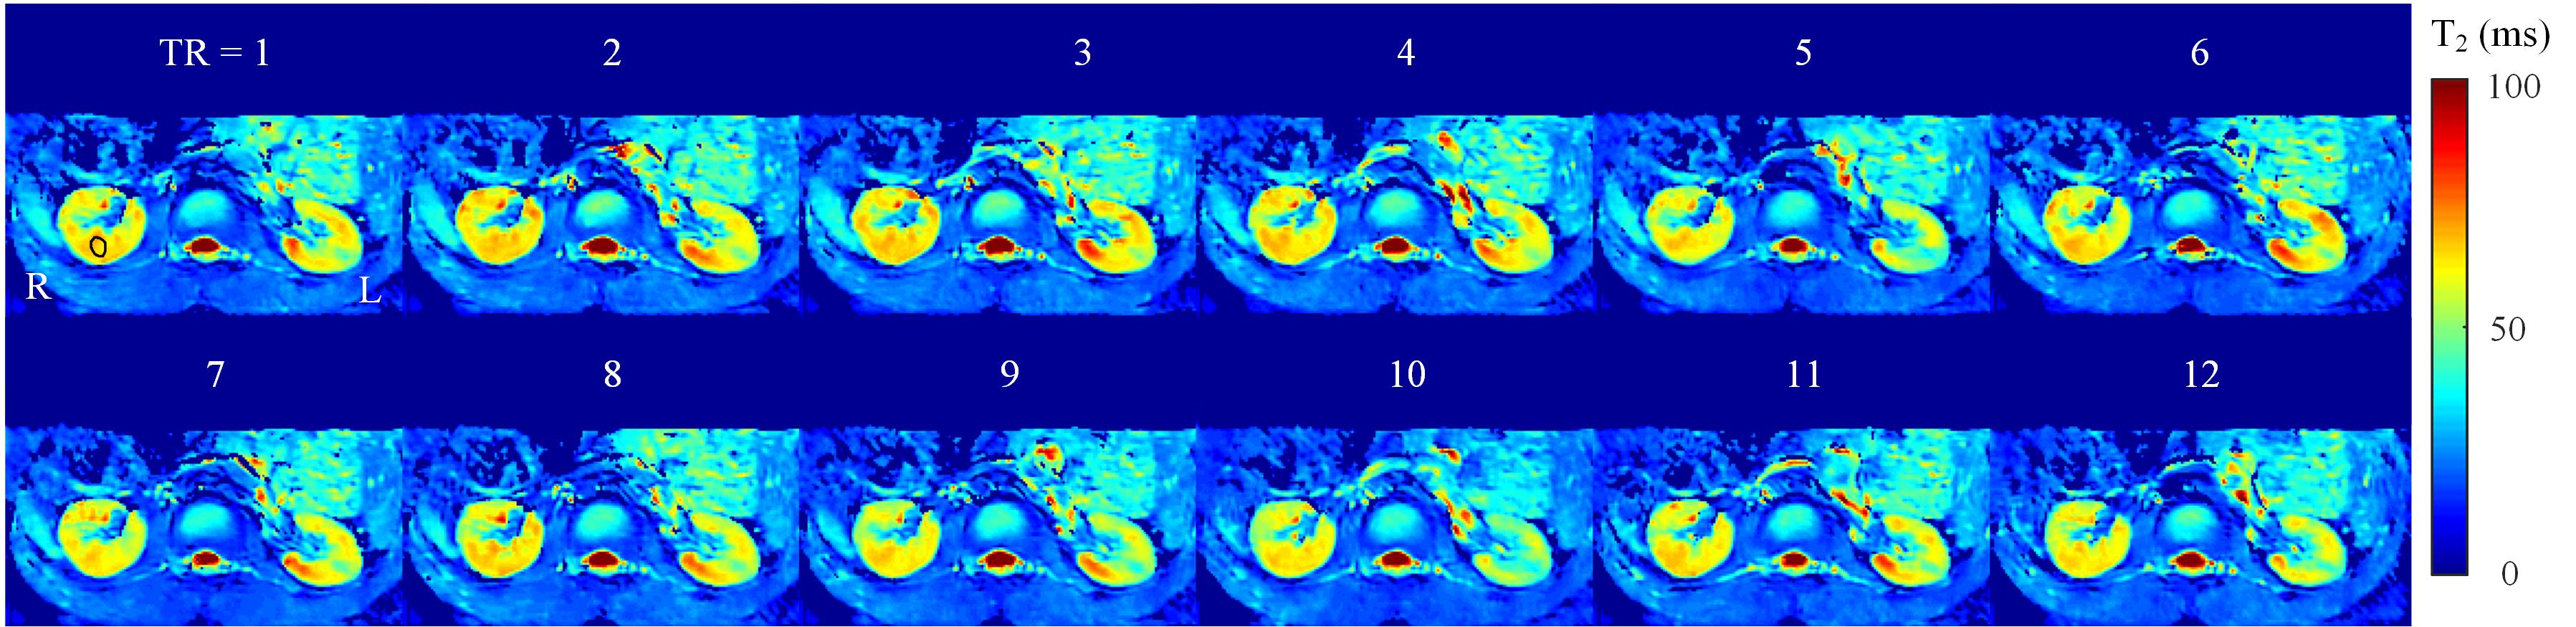
Figure 4
Real-time T2 maps under different TR periods.
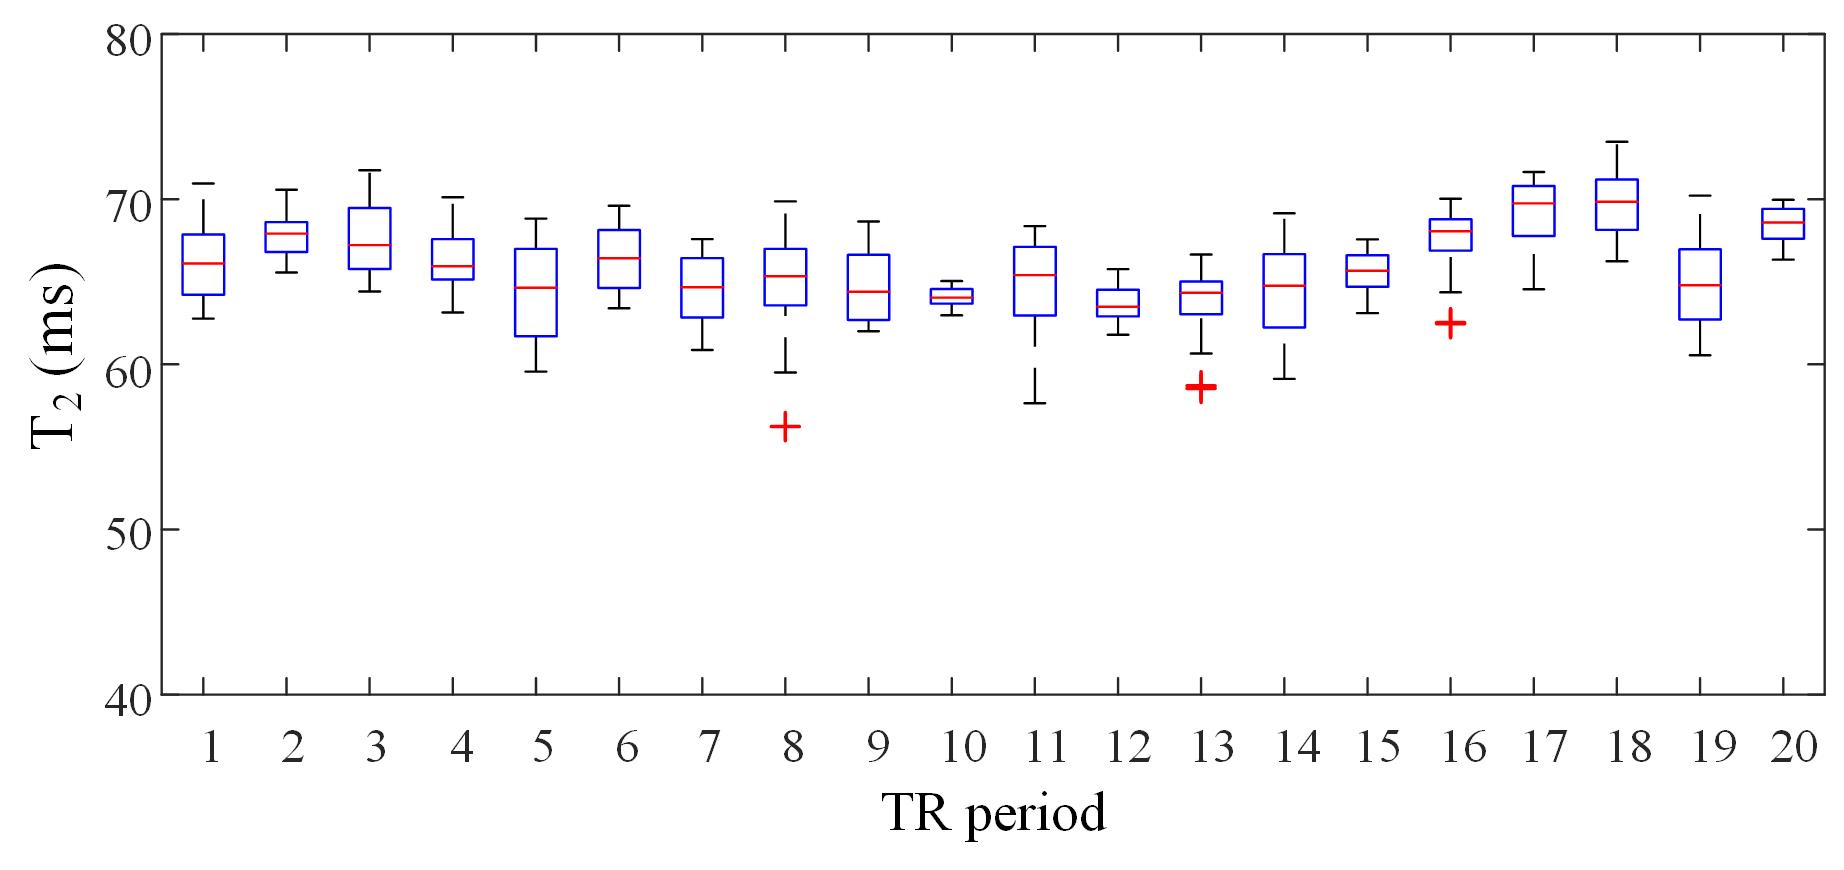
Figure 5 The boxplot of T2 value
under different TR periods. The top and bottom of the boxes are the 25th and
75th percentiles of the datasets, and red crosses are outliers.
DOI: https://doi.org/10.58530/2023/1608