1606
Diagnostic value of ultrafast quantitative T2 imaging in the preoperative differentiation of meningioma WHO grades1Department of Magnetic Resonance Imaging, the First Affiliated Hospital of Zhengzhou University, Zhengzhou, China, 2Department of Electronic Science, Xiamen University, Xiamen, China, 3Department of Imaging Sciences, University of Rochester, Rochester, NY, United States
Synopsis
Keywords: Quantitative Imaging, Neurography
We assess the ability of a novel single-shot quantitative T2 magnetic resonance imaging (MRI) sequence and apparent diffusion coefficient (ADC) maps in predicting the WHO grade in meningiomas. We used histogram analysis of T2 maps and ADC maps to compare different grades of meningioma. ADC P10 proved to be the best predictor among all histogram parameters of ADC. While histogram analysis of T2 maps did not receive satisfactory results, the combination of T2 kurtosis and ADC P10 proved to be the best predictor. It is worthy of consideration to try another method of ROI placement and increase the sample size.
Introduction
The 2021 World Health Organization (WHO) classified meningiomas into three grades pathologically1: Grade 1 is low-grade meningiomas (LGM), grade 2 and 3 are high-grade meningiomas (HGM). The treatment and prognostic outcomes of LGM and HGM are significantly different2,3. Therefore, a preoperative and noninvasive prediction method to diagnose the histological grade of meningioma has always been the focus of neurosurgeons and neuroradiologists. T2 mapping4-6 has been proven to be more objective and reproducible than conventional qualitative or semi-quantitative technology, but its application is often limited due to the long acquisition time in a clinical setting. In our study, we used a deep learning-based single-shot quantitative T2 method to generate a whole brain T2 mapping within just 12 seconds. We also used the apparent diffusion coefficient (ADC) map to distinguish LGM and HGM.Method
We enrolled 69 patients, among which 59 were classified as LGM (17 males, 42 females; mean age, 57.34±9.40 years; age range, 30-78 years) and 10 were classified as HGM (4 males, 6 females; mean age, 58.18±9.36 years; age range, 46-73 years). All patients underwent preoperative MRI examination using a 3.0 T scanner (MAGNETOM Prisma, Siemens Healthcare, Erlangen, Germany) with an integrated 64-channel head and neck coil. The sequences involved in this study include axial T2 fluid attenuated inversion recovery imaging (TR=6500 ms, TE=85 ms, acquisition time=1 minutes 18 seconds), diffusion-weighted imaging (TR=4600 ms, TE=80 ms, acquisition time=41 seconds), contrast-enhanced (Magnevist, gadopentetate dimeglumine) T1-weighted imaging (TR=220 ms, TE=2.46 ms, acquisition time=28 seconds), and axial single-shot T2 mapping (TR=8000/3000/3000/3000 ms, TE=66/400/600/800 ms, acquisition time=32 seconds). MRI pulse sequence diagram of the single-shot T2 mapping was shown in Figure 1. Hematoxylin and eosin (HE) staining was performed on all surgically resected specimens for histological grading. Patients were classified as LGM and HGM based on 2021 WHO CNS classification1. Two independent neuroradiologists (with 5 years’ and 10 years’ experience in neurological imaging, respectively) manually delineated polygonal regions of interest (ROI) on each slice to acquire the whole lesion measurements using 3D Slicer (version 4.10.2, www.slicer.org), with the final results relying on their consensus7. ROI was defined as tumor parenchyma that was significantly enhanced on CE-T1WI with the exclusion of large vessels, cysts and necrosis. The histogram parameters for each ROI were extracted with FeAture Explorer (FAE; https://github.com/salan668/ FAE). All the metrics are listed as follows: mean, median, maximum, minimum, ten percentiles (P10), 90 percentiles (P90), interquartile range (IQR), range; entropy, skewness, kurtosis, uniformity and variance. We verified the data normality using the Shapiro-Wilk test. And then independent t-test or Mann-Whitney U test was used for the comparison of histogram parameters. The receiver operating characteristic (ROC) analysis was performed for all statistically significant histogram parameters. Moreover, parameters with the best predictive performance were screened to construct a binary logistic regression model to get a combined variable, which also underwent ROC analysis. The corresponding area under the ROC curves (AUCs) with a 95% confidence interval (CI) and the optimal cut-off values were calculated. The Delong test was used for the comparison of AUCs. A value of p<0.05 was considered to be the significance level. Representative patients are shown in Figure 2.Result
As shown in Table 1 and Figure 3, there were significantly higher ADC mean, ADC median, ADC minimum and ADC P10 in LGM patients than those in HGM patients. However, histogram parameters based on T2 maps showed no significant difference between LGM and HGM. In addition, diagnostic performance of all statistically significant parameters and the combined index were listed in Table 2.Discussion and Conclusion
We demonstrated that the ADC can effectively differentiate the WHO grade of meningiomas. The lower ADC values in HGM may be reasoned from the restricted diffusion since HGM has larger cellularity, smaller extracellular space and greater nuclear cytoplasmic ratio. On the other hand, our study found little difference in T2 histogram parameters between LGM and HGM. Interestingly, although all histogram parameters based on T2 maps did not reach the significance level, the characteristic indicators representing heterogeneity (IQR, maximum, skewness, kurtosis) showed a more obvious tendency towards distinction than the other parameters. We, therefore, hypothesized that differences in T2 heterogeneity between LGM and HGM actually exist and studies of larger cohorts may help to uncover these subtle discrepancies. Considering that obvious cystic lesions and necrosis have been excluded when placing ROIs, it is reasonable to assume that microscopic cysts and necrosis that cannot be identified visually could explain the greater heterogeneity in HGM patients. Multiple factors may have influenced our final results. We did not take into account the differences between subtypes within the same grade of meningioma, which could have an opposite effect on T2 values. Furthermore, there may be focal higher-grade lesions within the tumor parenchyma of LGM, the latter of which may not be detected on histopathological examination. In the following study, we will seek to clarify the differences in T2 relaxation times between subtypes and try new ROI profiling methods based on a larger sample size.Acknowledgements
No acknowledgement found.References
1. Louis D N, Perry A, Wesseling P, et al. The 2021 WHO Classification of Tumors of the Central Nervous System: a summary. Neuro-Oncology, 2021, 23(8): 1231–1251.
2. Goldbrunner R, Stavrinou P, Jenkinson M D, et al. EANO guideline on the diagnosis and management of meningiomas. Neuro-Oncology, 2021, 23(11): 1821–1834.
3. Ugga L, Spadarella G, Pinto L, et al. Meningioma Radiomics: At the Nexus of Imaging, Pathology and Biomolecular Characterization. Cancers, 2022, 14(11).
4. Bauer S, Wagner M, Seiler A, et al. Quantitative T2'-mapping in acute ischemic stroke. Stroke, 2014, 45(11): 3280–3286.
5. Kvernby S, Flejmer A M, Dasu A, et al. T1 and T2 Mapping for Early Detection of Treatment-Related Myocardial Changes in Breast Cancer Patients. Journal of magnetic resonance imaging: JMRI, 2022, 55(2): 620–622.
6. Hepp T, Kalmbach L, Kolb M, et al. T2 mapping for the characterization of prostate lesions. World journal of urology, 2022, 40(6): 1455–1461.
7. Gao E, Gao A, Kit Kung W, et al. Histogram analysis based on diffusion kurtosis imaging: Differentiating glioblastoma multiforme from single brain metastasis and comparing the diagnostic performance of two region of interest placements. Eur J Radiol, 2022, 147: 110104.
Figures
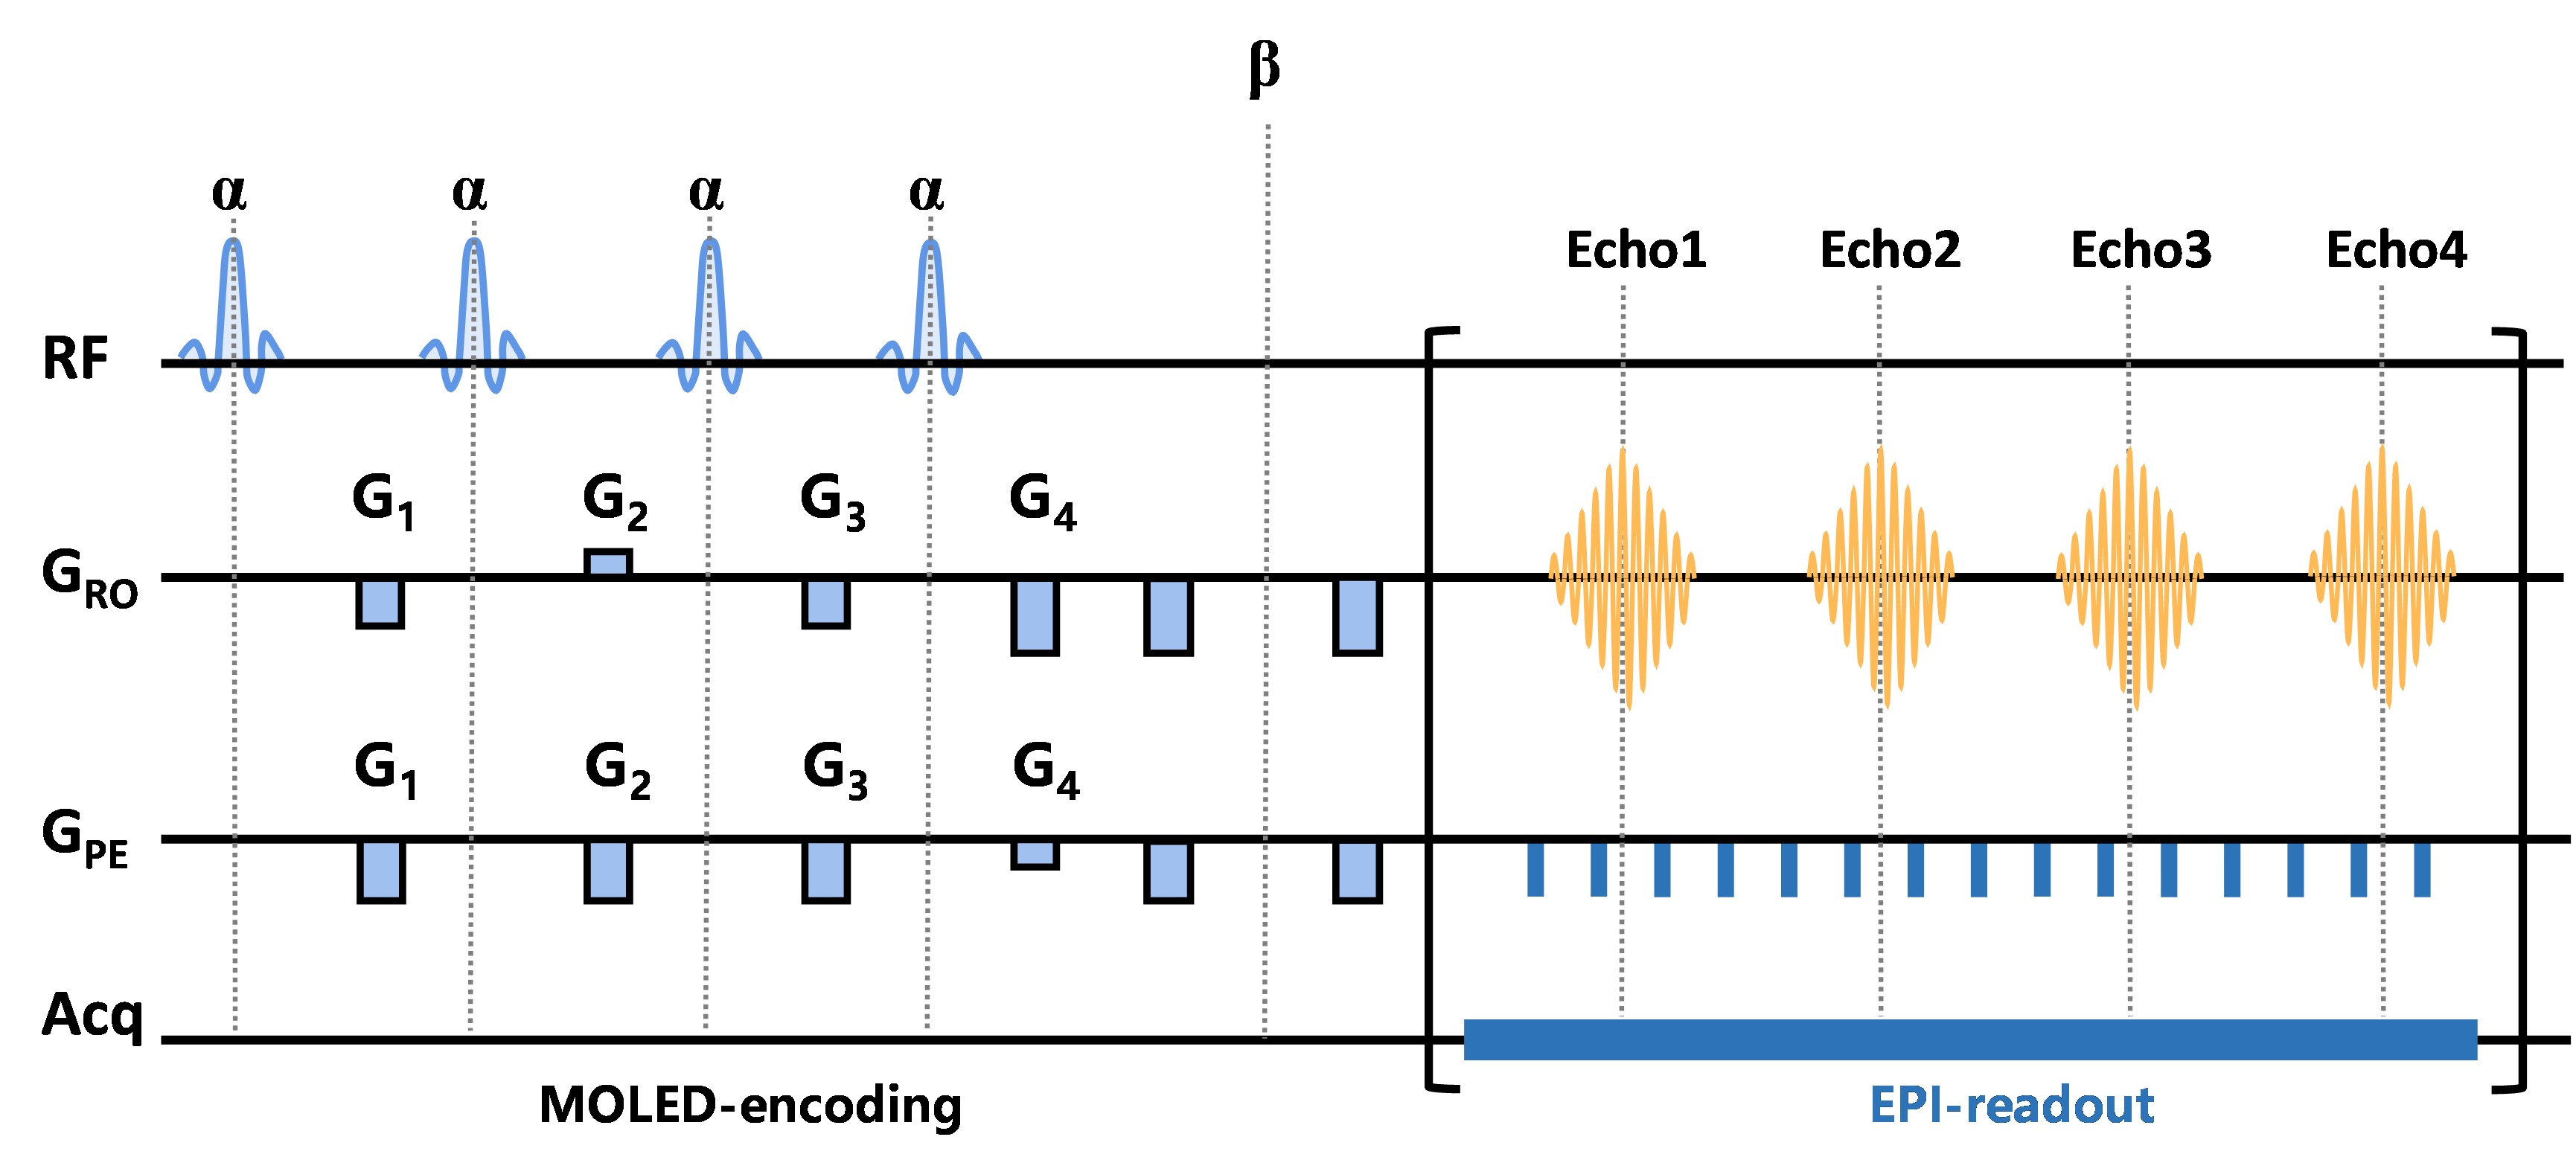
Figure 1 MRI pulse sequence diagram of the single-shot T2 mapping.
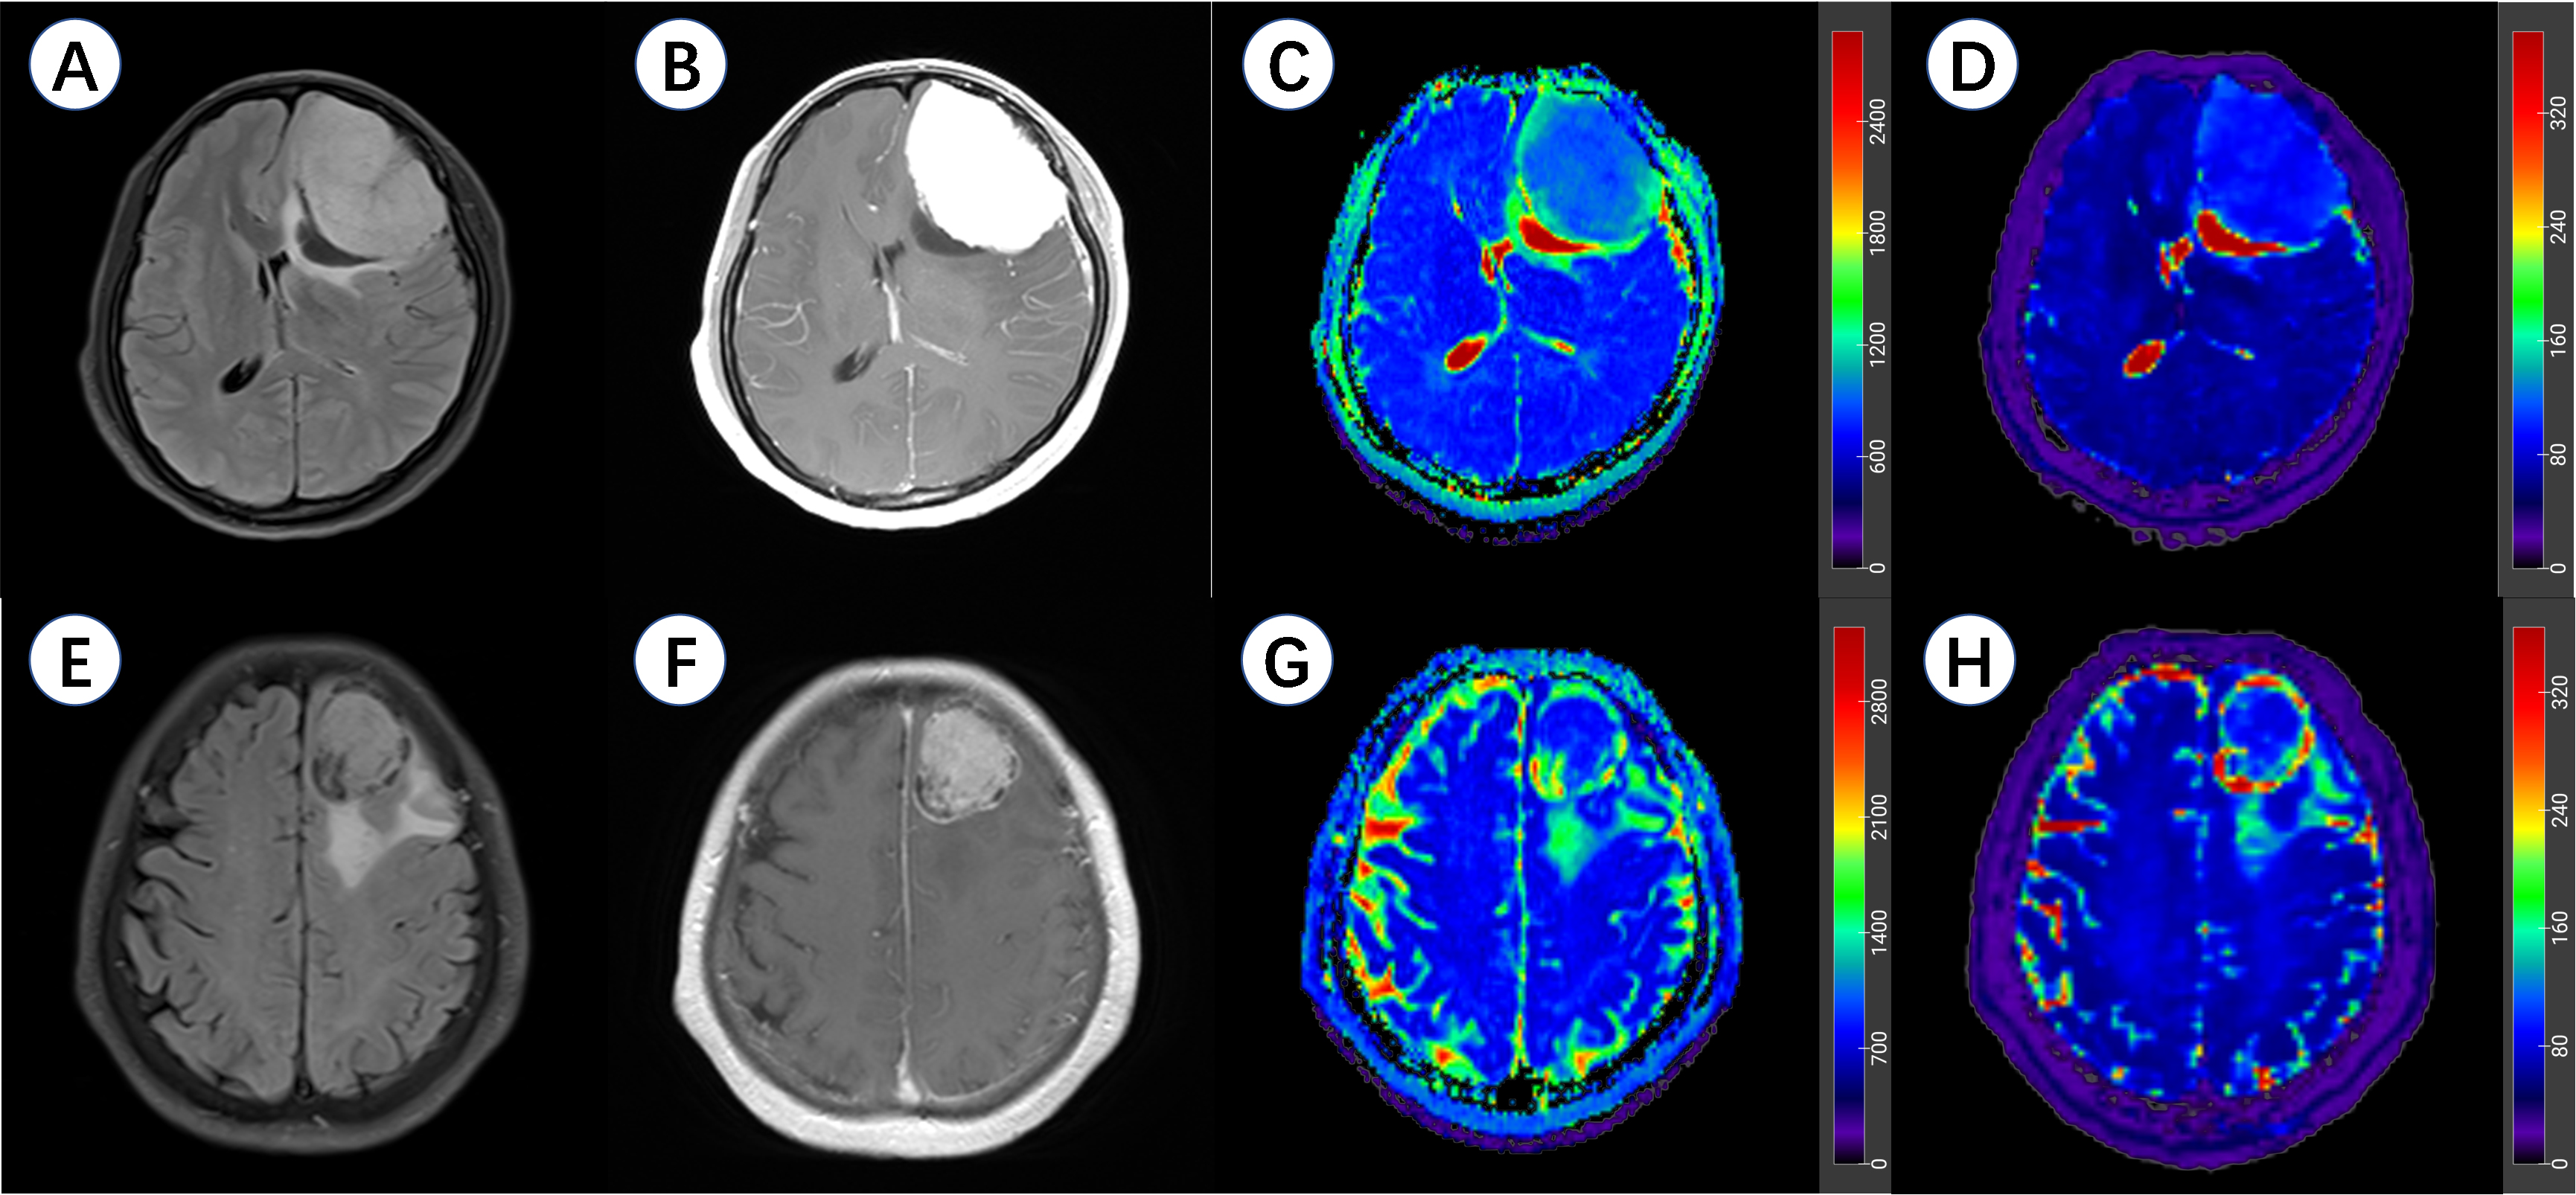
Figure 2 Representative meningioma patients in this study.
A-D, a 37-year-old female patient with a left frontal lobe WHO 1 meningioma. A, axial T2 fluid attenuated inversion recovery imaging (T2 FLAIR); B, contrast-enhanced T1-weighted imaging (CE-T1WI); C, apparent diffusion coefficient (ADC) maps; D, T2 maps.
E-H, a 70-year-old female patient with a left frontal lobe WHO 2 meningioma. E, axial T2 FLAIR; F, CE-T1WI; G, ADC maps; H, T2 maps.
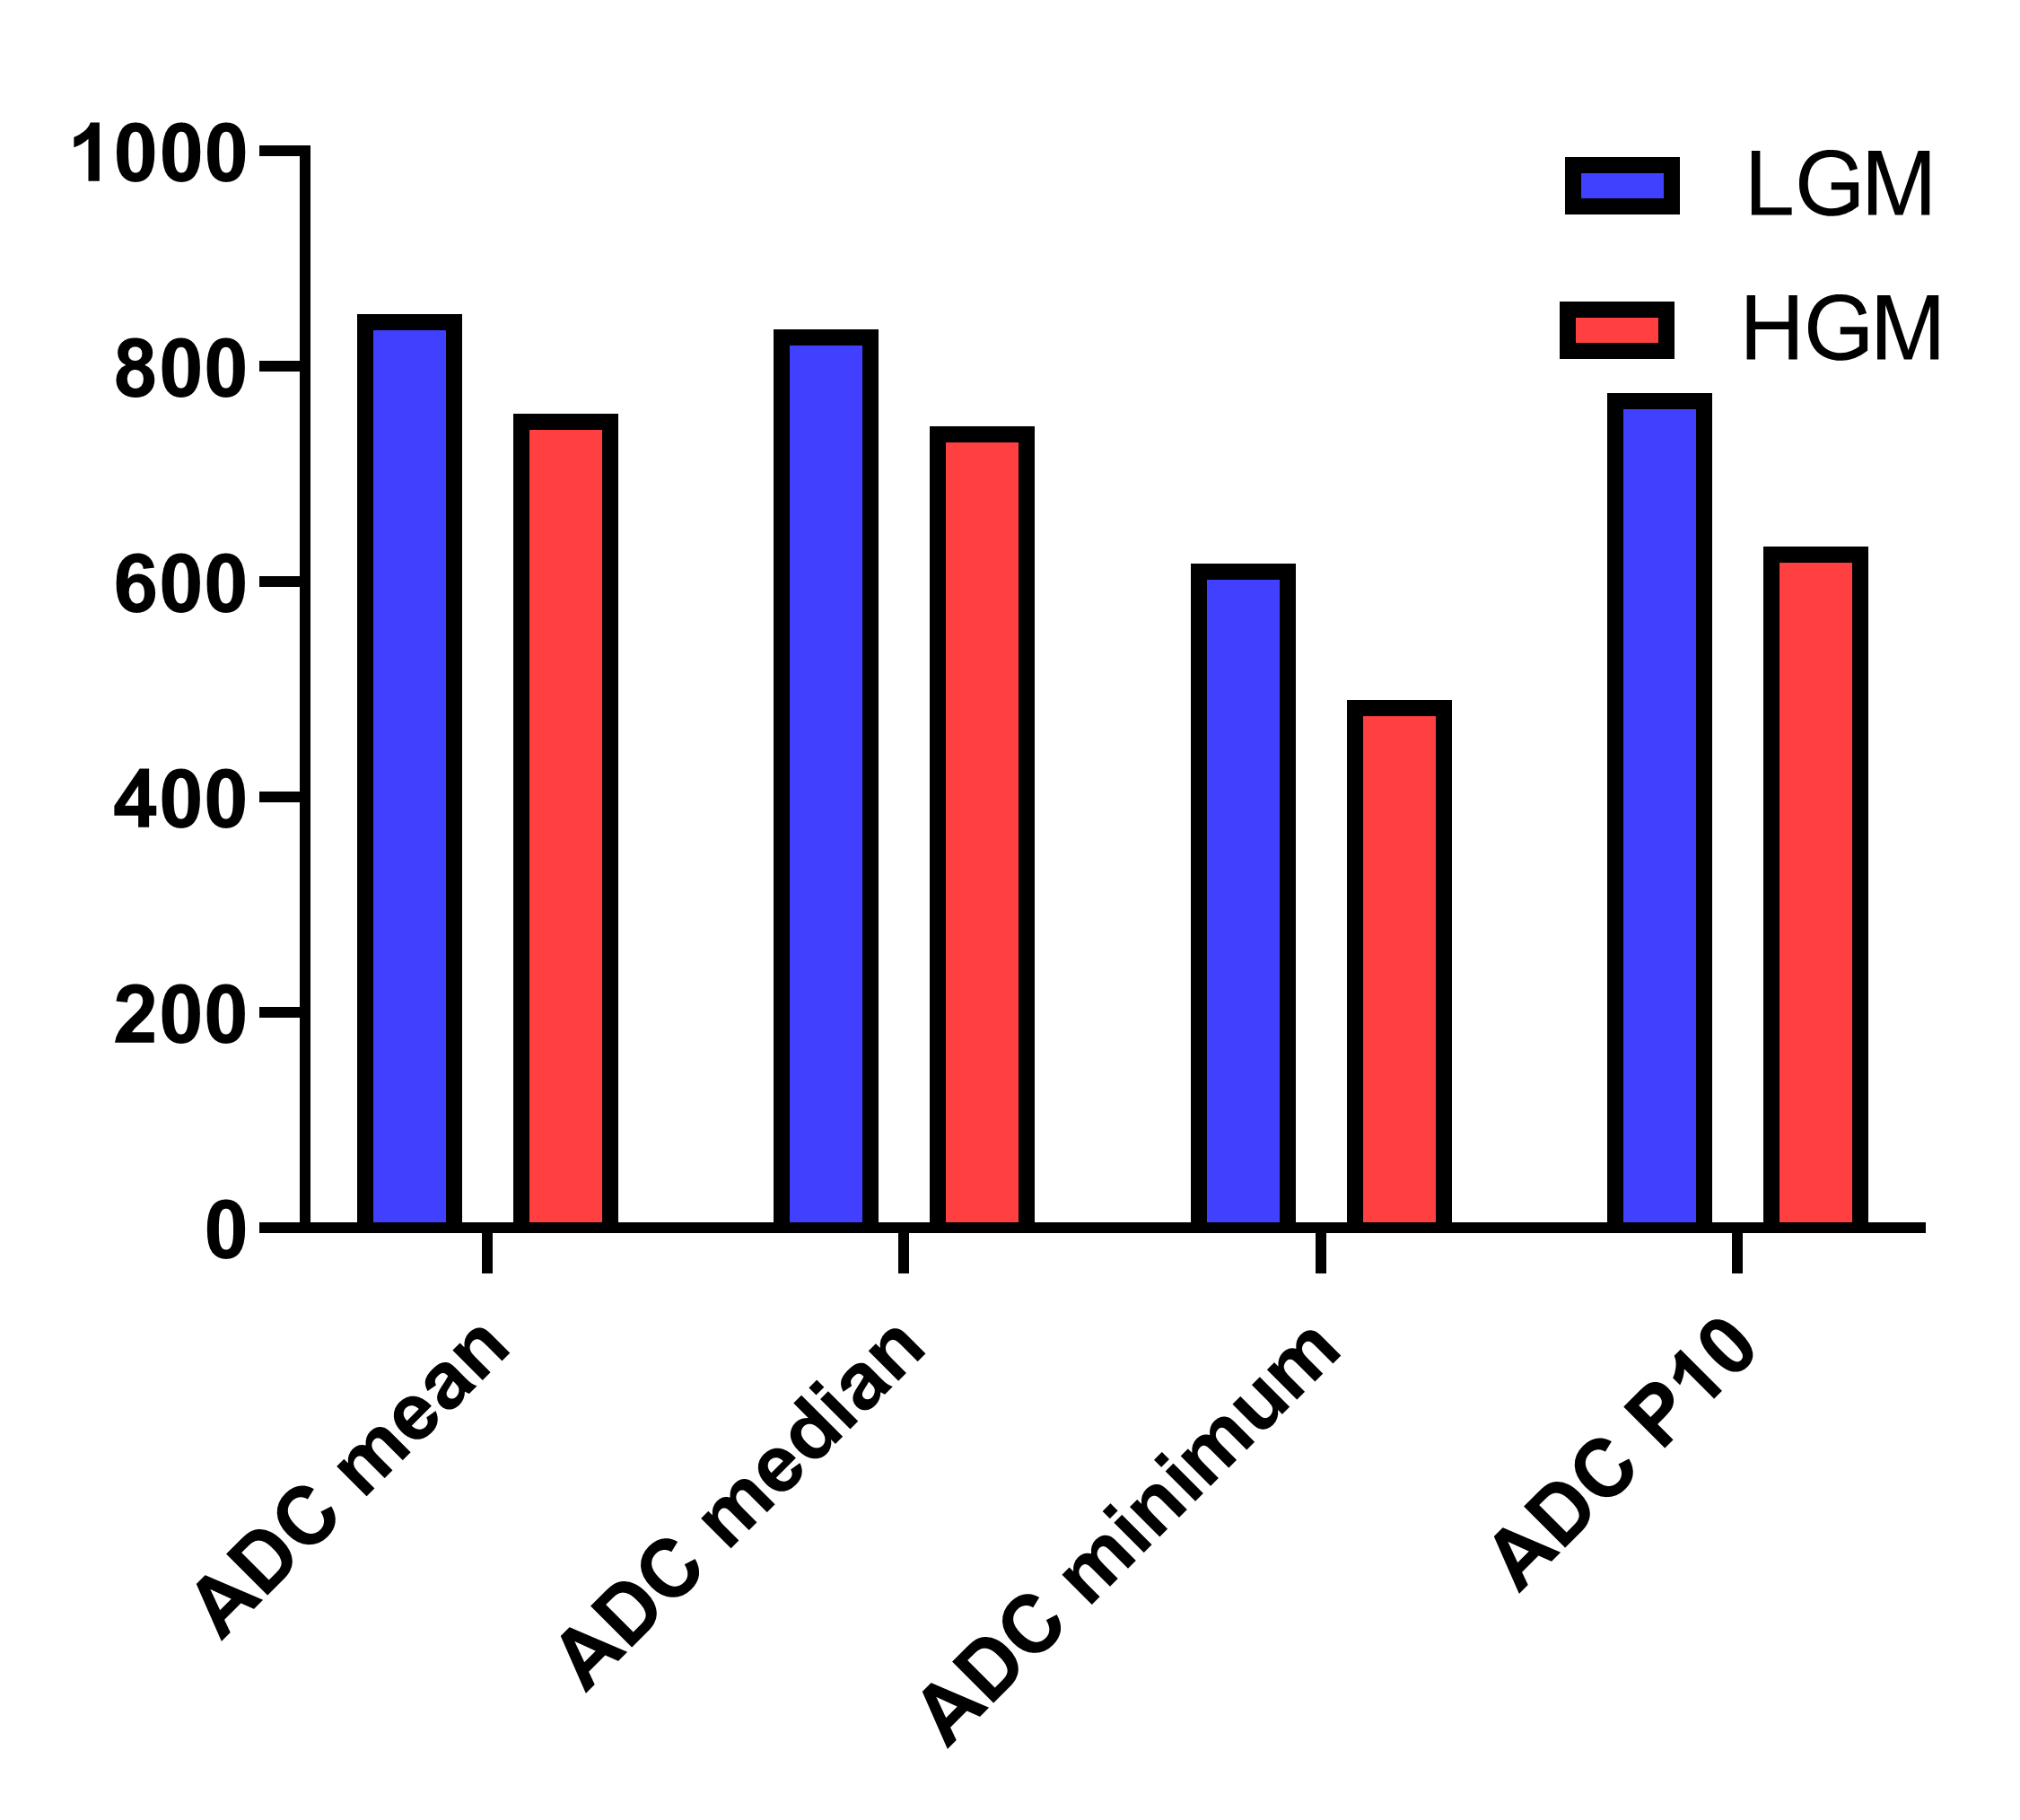
Figure 3 The histogram maps of parameters based on apparent diffusion coefficient (ADC) maps for the differentiation of histological grade.
LGM, low grade meningioma; HGM, high grade meningioma; P10, 10 percentiles.
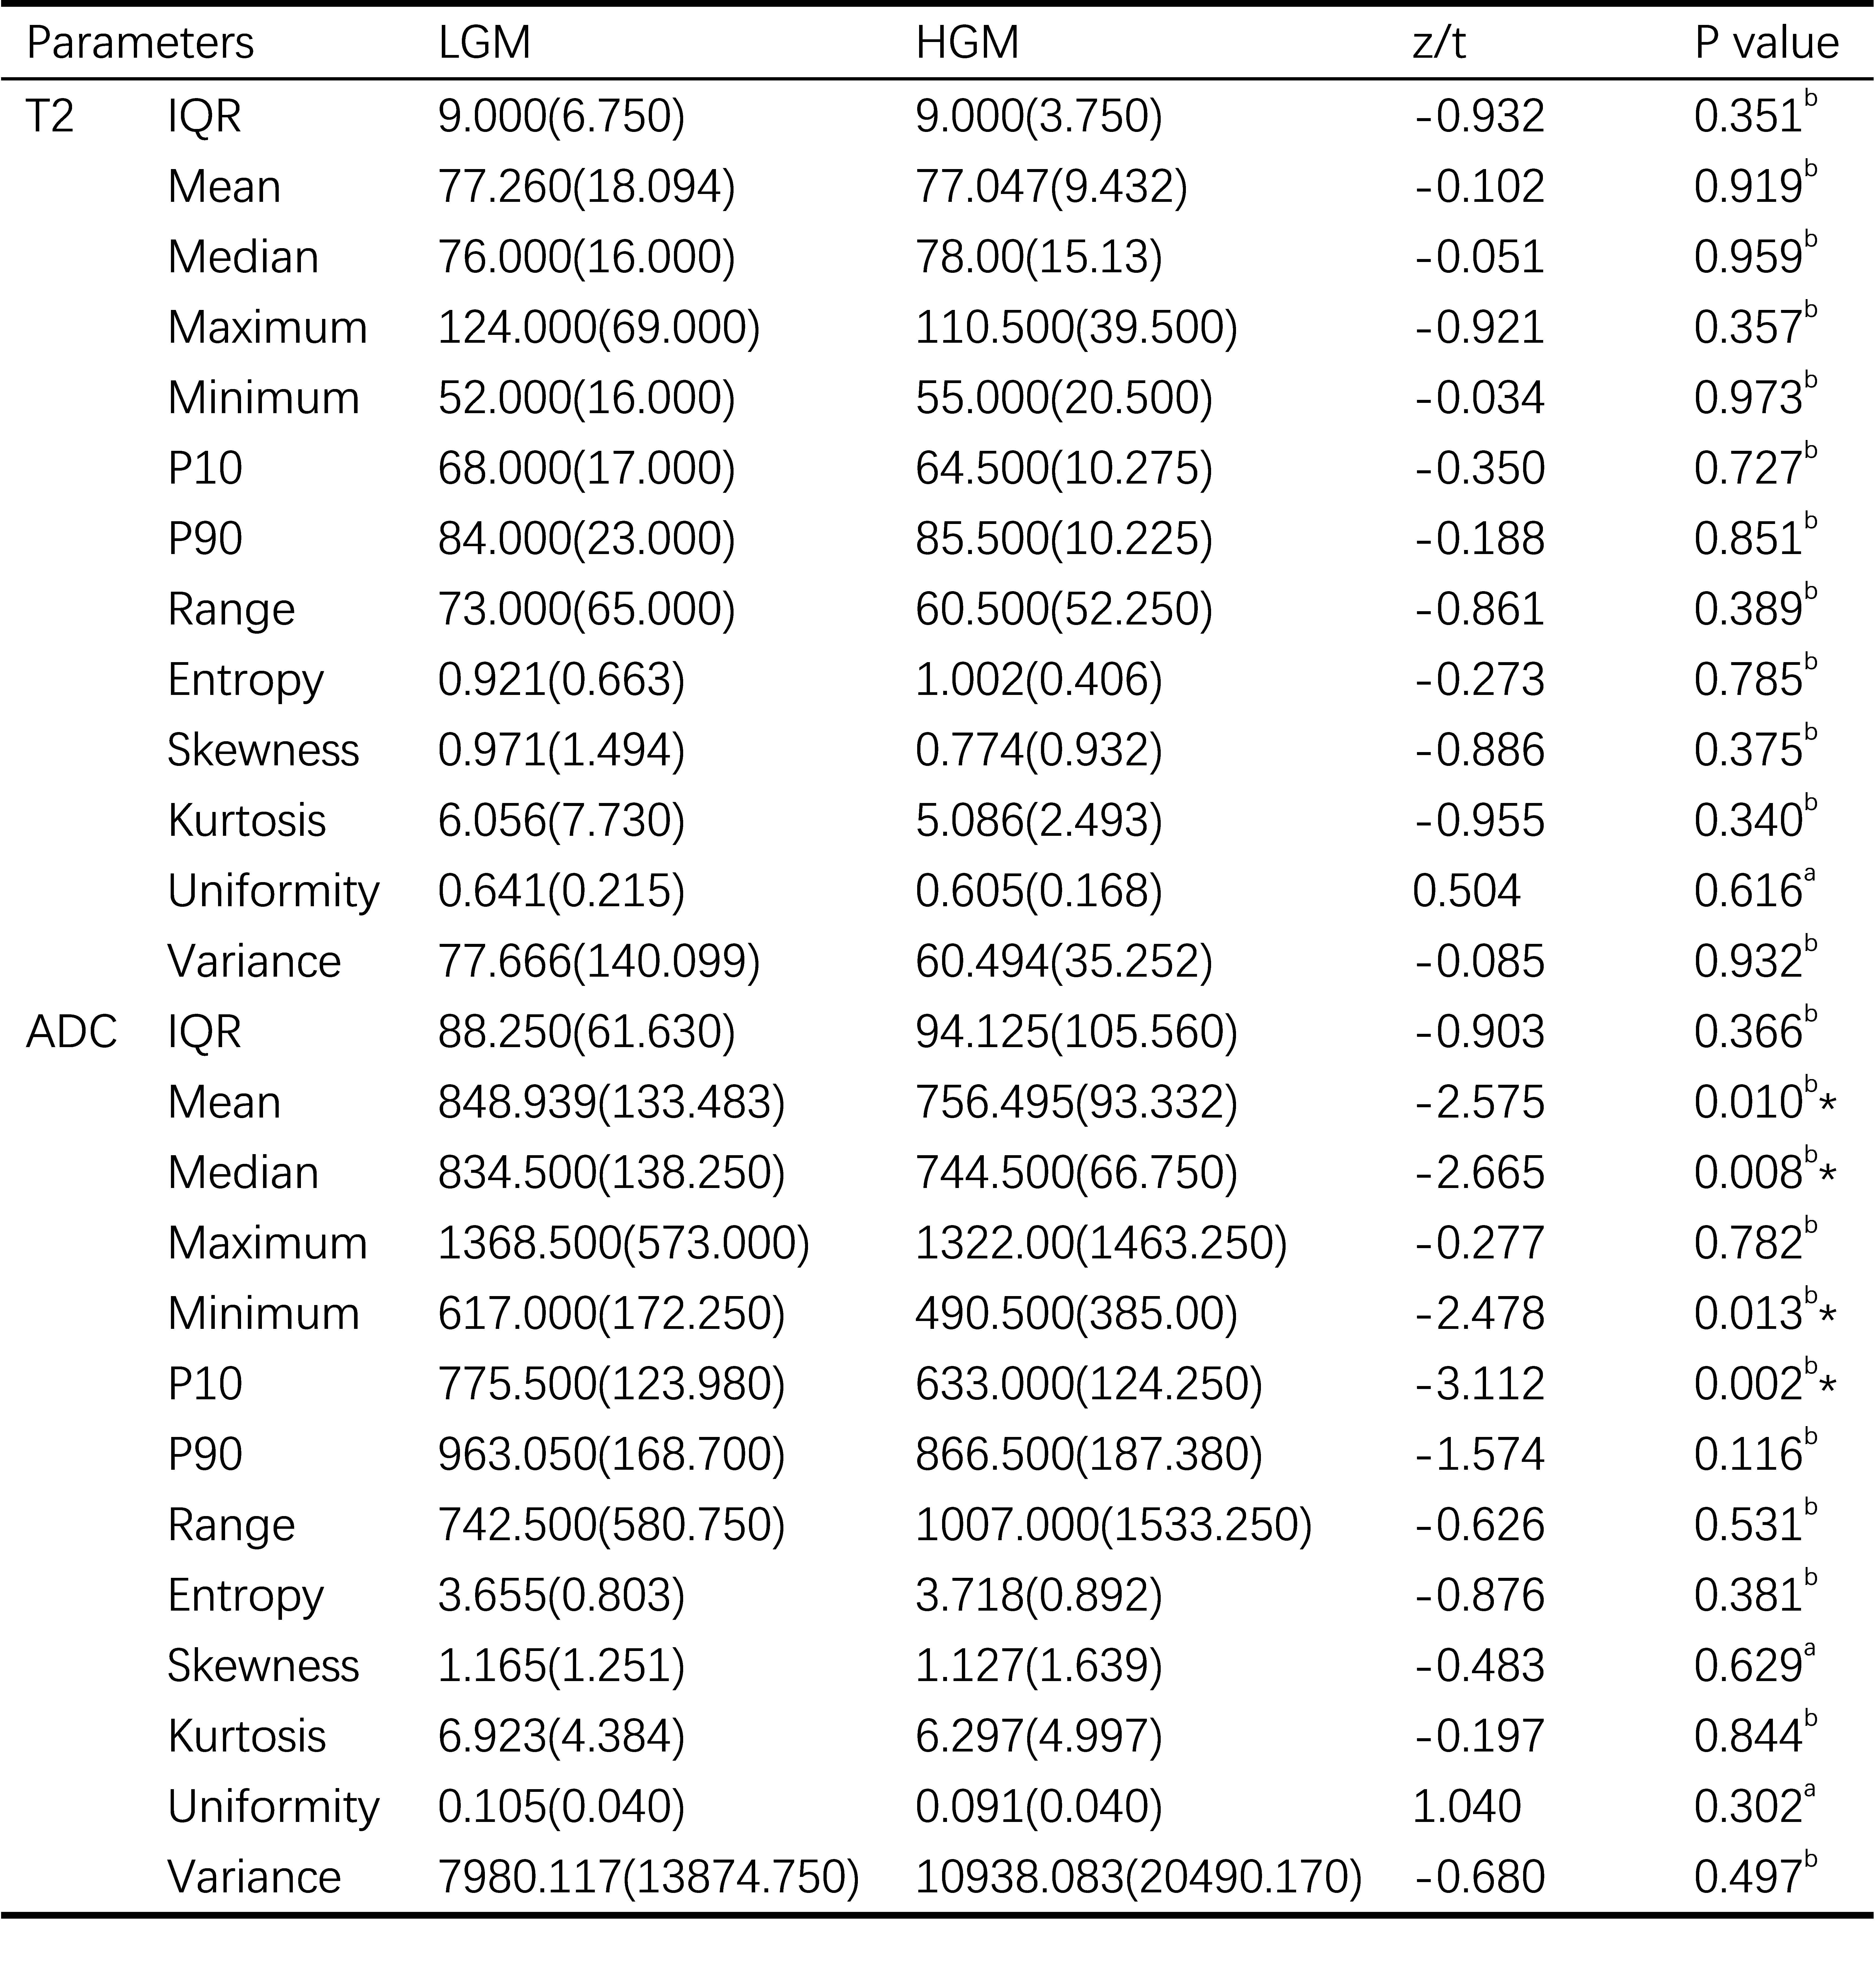
Table 1 Comparison of histogram parameters between LGM and HGM.
LGM, low grade meningioma; HGM, high grade meningioma; IQR, Interquartile range; P10, 10 percentiles; P90, 90 percentiles.
a, independent t-test was applied for normally distributed continuous variables; b, Mann-Whitney U test was applied for non-normally distributed continuous variables.
*, statistically significant.
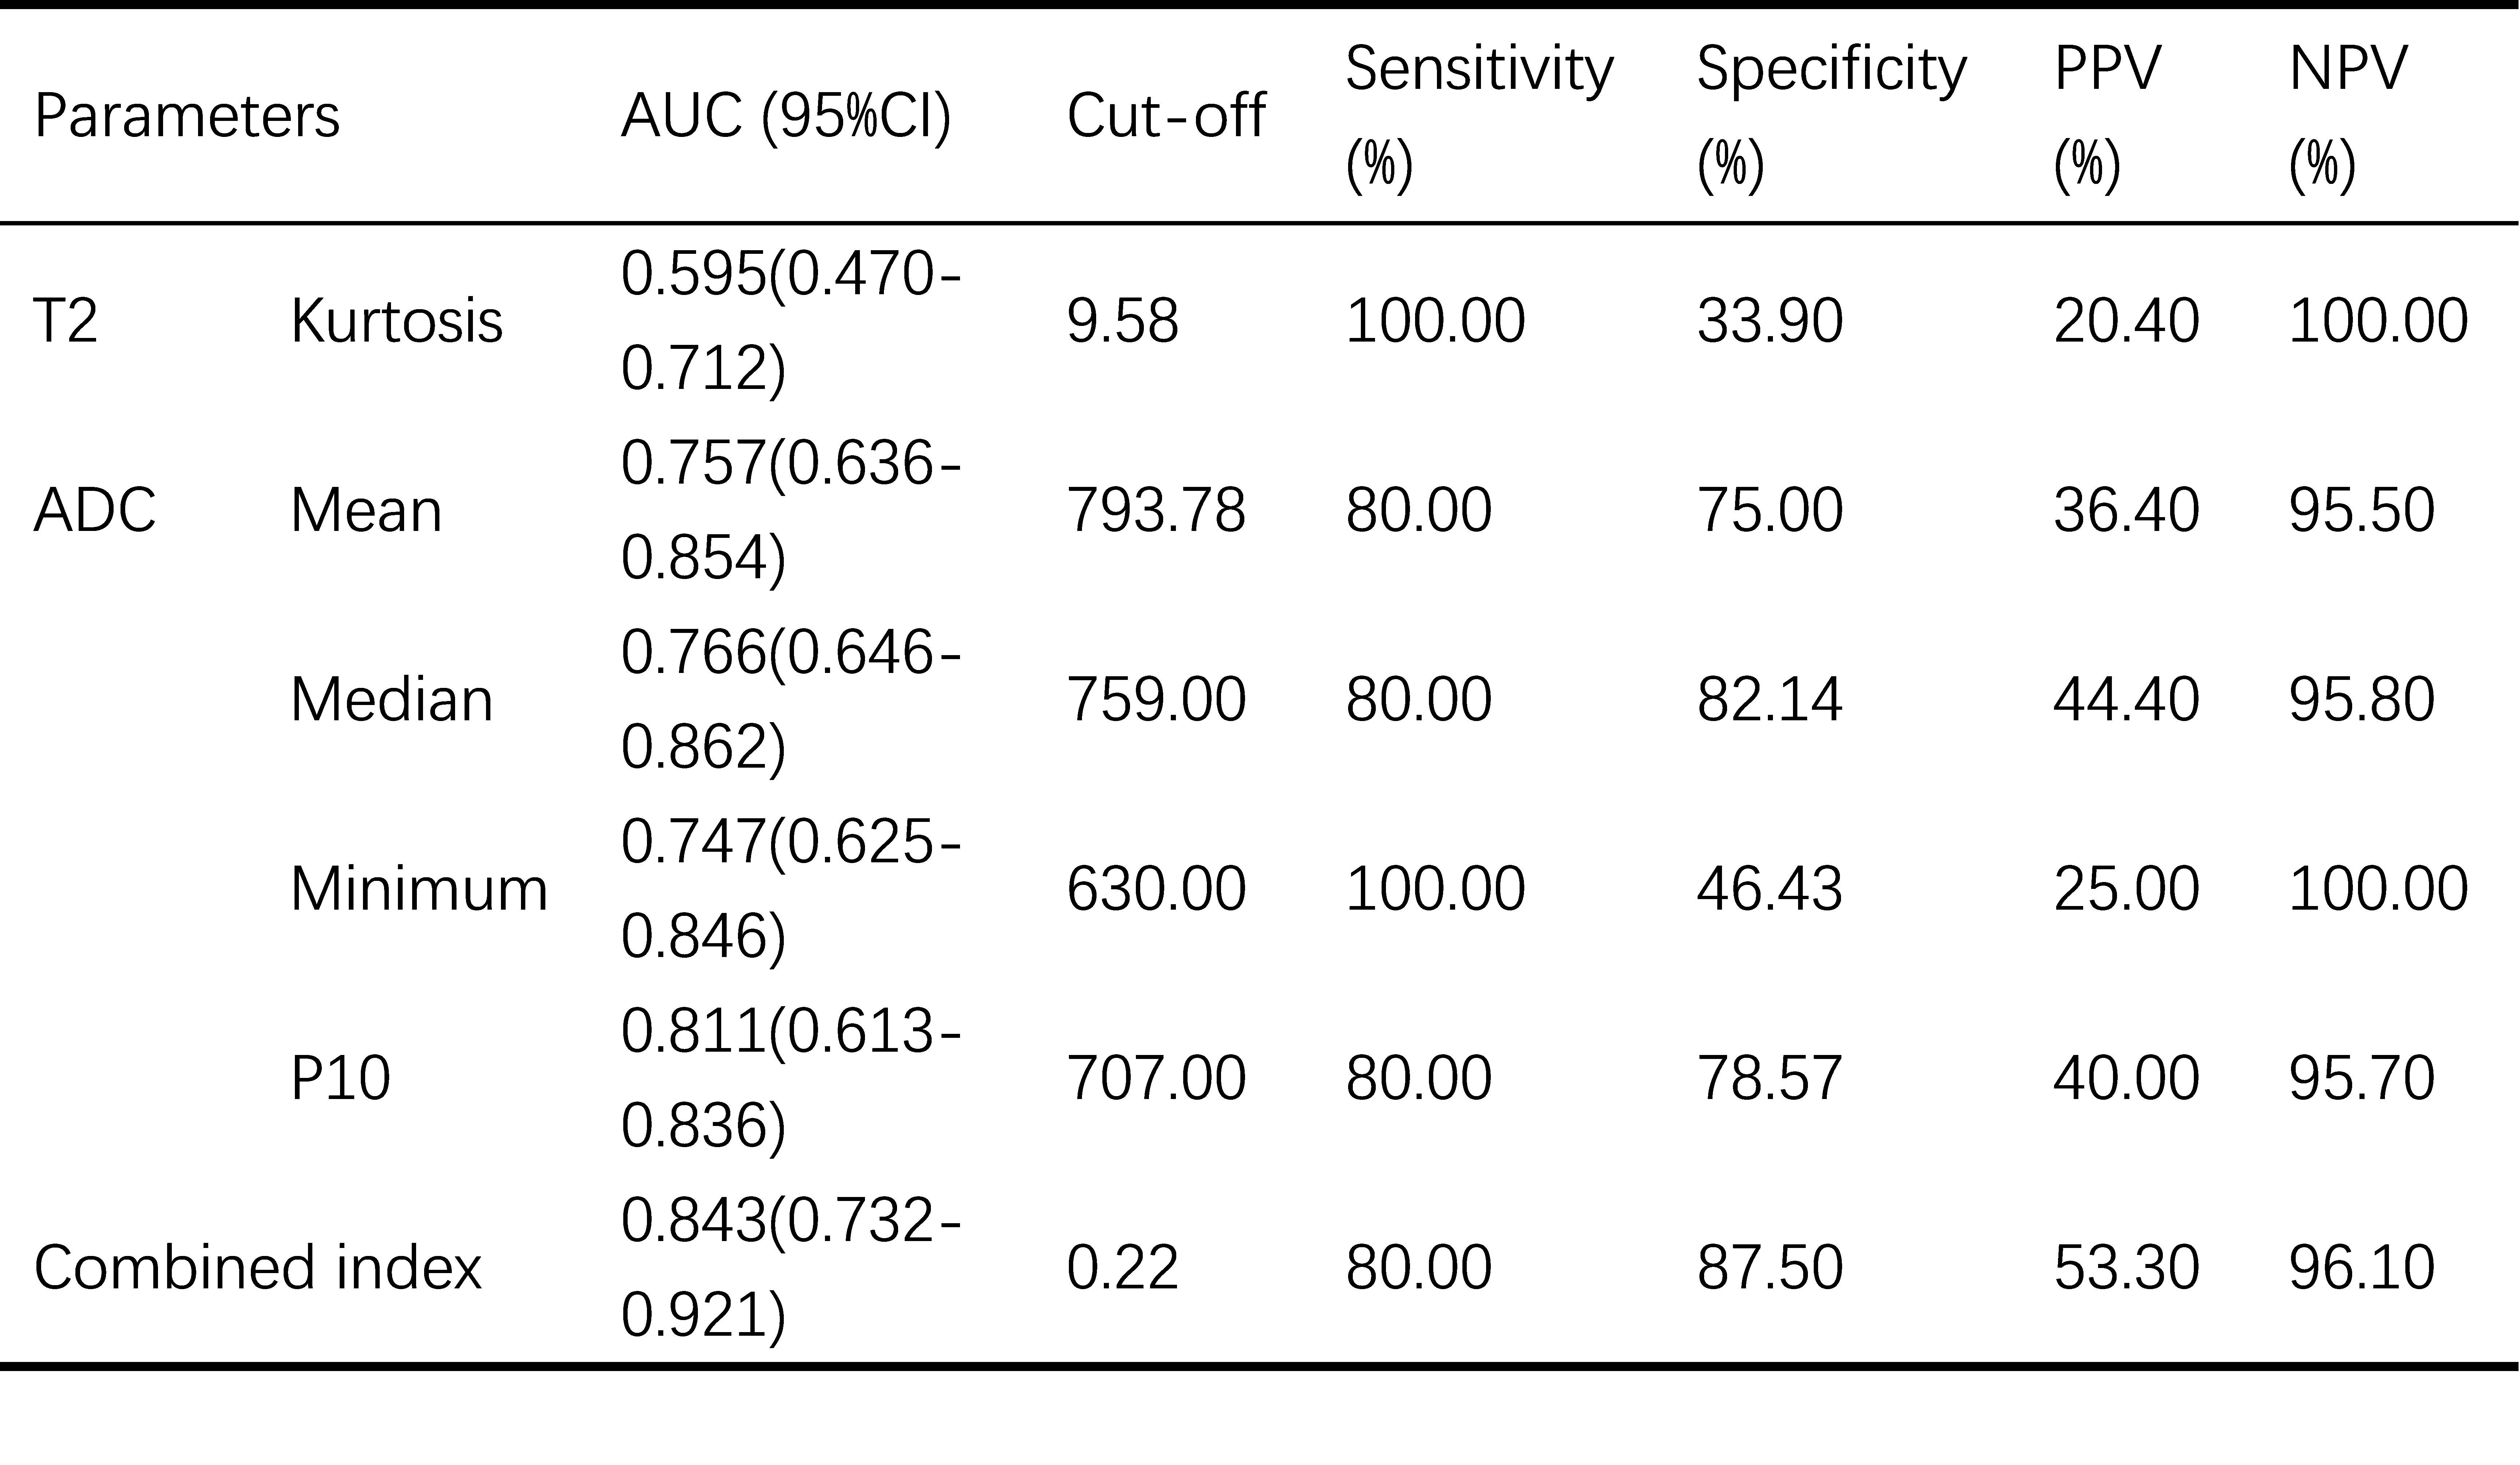
Table 2 Diagnostic performance of histogram parameters for the differentiation of LGM and HGM
AUC, area under the curve; CI, confidence interval; PPV, positive predictive value; NPV, negative predictive value; P10, 10 percentiles; combined index, the combination of T2 kurtosis and ADC P10.