1604
Self-supervised Learning Based Liver Multi-parametric Mapping in a Single Breath-hold1Department of Imaging and Interventional Radiology, The Chinese University of Hong Kong, Shatin, Hong Kong, 2CUHK Lab of AI in Radiology (CLAIR), Shatin, Hong Kong, 3Illuminatio Medical Technology Limited, Hong Kong SAR, China, 4Philips Healthcare, Hong Kong SAR, China, 5Department of Medicine and and Therapeutics, The Chinese University of Hong Kong, Shatin, Hong Kong
Synopsis
Keywords: Quantitative Imaging, Liver
A self-supervised learning based multiparametric mapping method is proposed to map T1ρ and T2 simultaneously, by utilising the relaxation constraint in the learning process. The method was examined on a dataset of 52 patients with non-alcoholic fatter liver disease. Results showed that the proposed method can produce comparable parametric maps to the traditional fitting method, with reduced number of images, and reduced scan time.Introduction
T1ρ and T2 are two important tissue parameters for tissue characterization in the liver and other organs[1]. It is worth exploring simultaneous multi-parametric mapping by using a reduced number of MR contrast images to save the scan time. Deep learning was used to map multiple parametric maps simultaneously in a supervised way [2-4]. Supervised learning requires a large amount of high quality training data, which is expensive and can be challenging to collect. Self-supervised learning has been reported in quantitative MRI (qMRI) by leveraging physics constraint [5,6]. In this work, we propose a novel self-supervised learning framework for multiparametric mapping of T1ρ and T2 that leverages the relaxation constraint between conventional contrast images in the loss function.Data Acquisition and Dataset
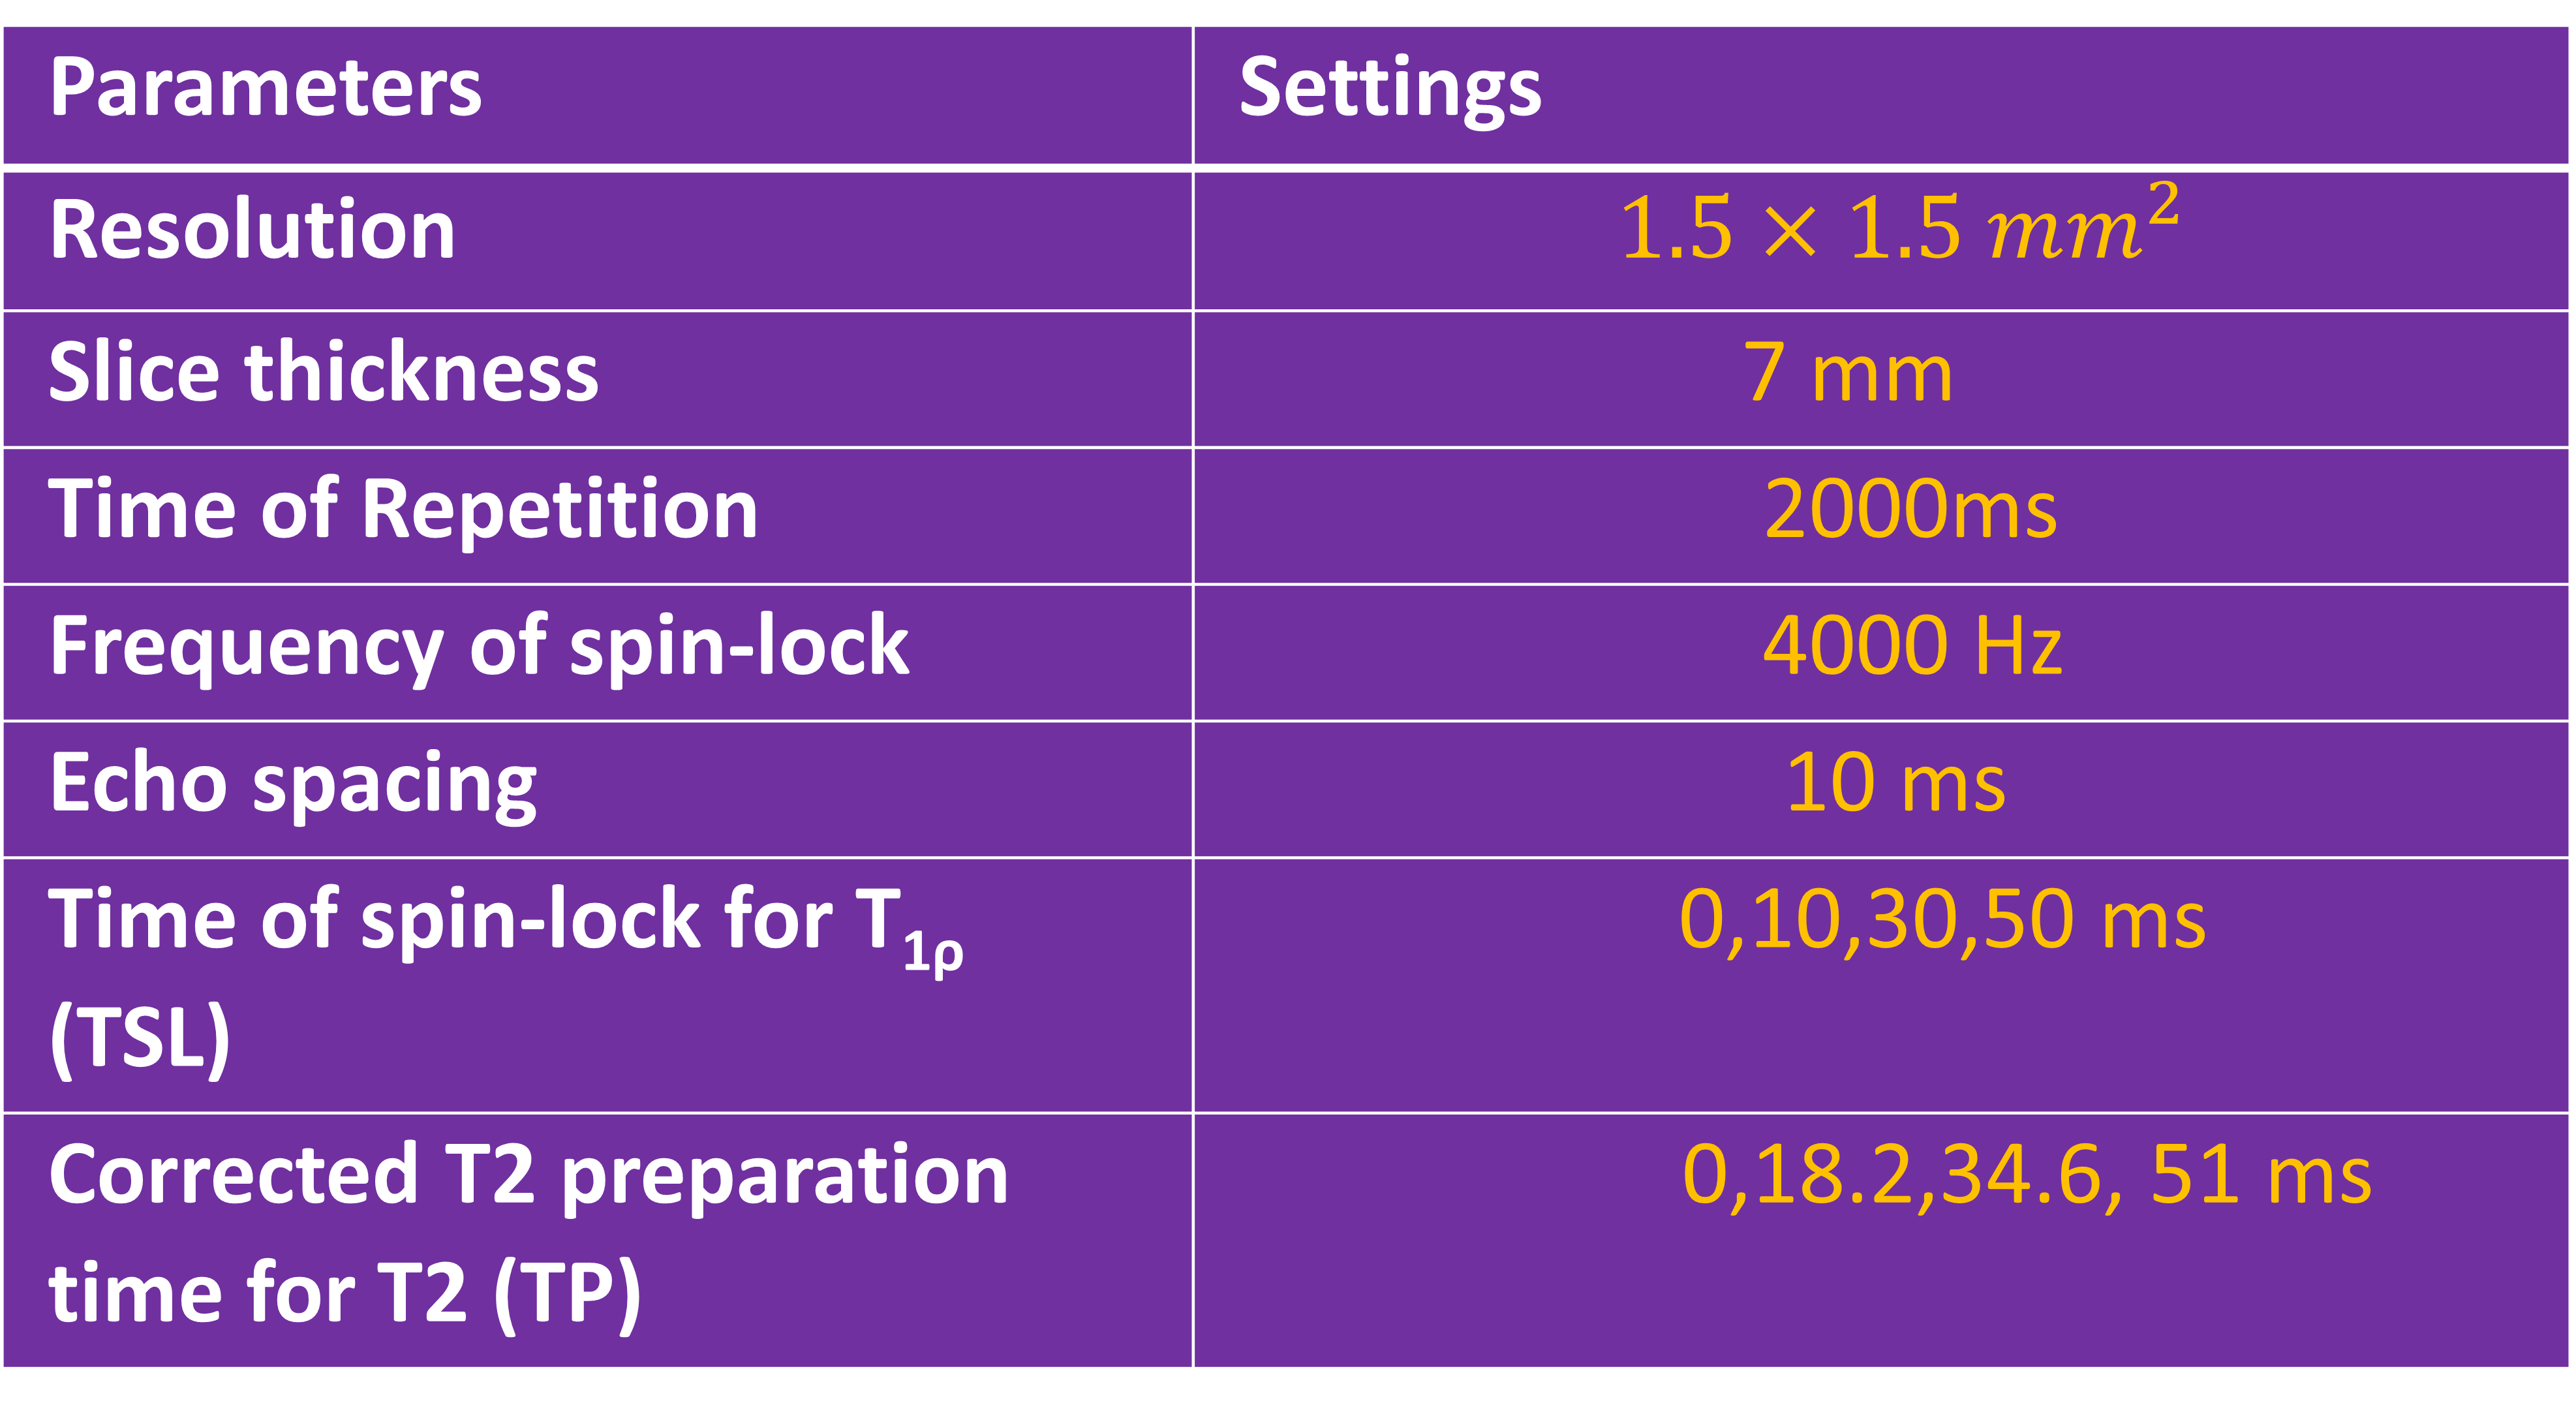
The in vivo studies were conducted with the approval of the institutional review board. All MRI scans were conducted using a 3.0 T MRI scanner (Philips Achieva, Best, Netherlands). A body coil was used as the RF transmitter, and a 32- channel cardiac coil (Invivo Corp, Gainesville, USA) was used as the receiver. A pulse sequence developed to quantify T2 and T1ρ simultaneously within a single breath-hold was used [7]. To reduce the magnetic field inhomogeneity, a pencil-beam volume shimming box was placed on the right lobe of the liver to reduce the B0 field inhomogeneity. The B1 field inhomogeneity was reduced using dual transmit and vendor-provided RF shimming. The scan parameters setting is shown in Table 1. The T1ρ image with time of spin-lock (TSL) = 0 and T2 image with T2 preparation time (TP) = 0 shared the same image (referred as shared image) [8]. The imaging parameters are shown in Table 1.The data of 52 patients with non-alcoholic fatter liver disease were retrospectively fetched and a four-fold cross-validation was carried out for evaluation, with 13 patients in each fold. For each patient, three slices of image were collected and each slice has four dynamic scans of T1ρ weighted image and T2 weighted image respectively.
Algorithm
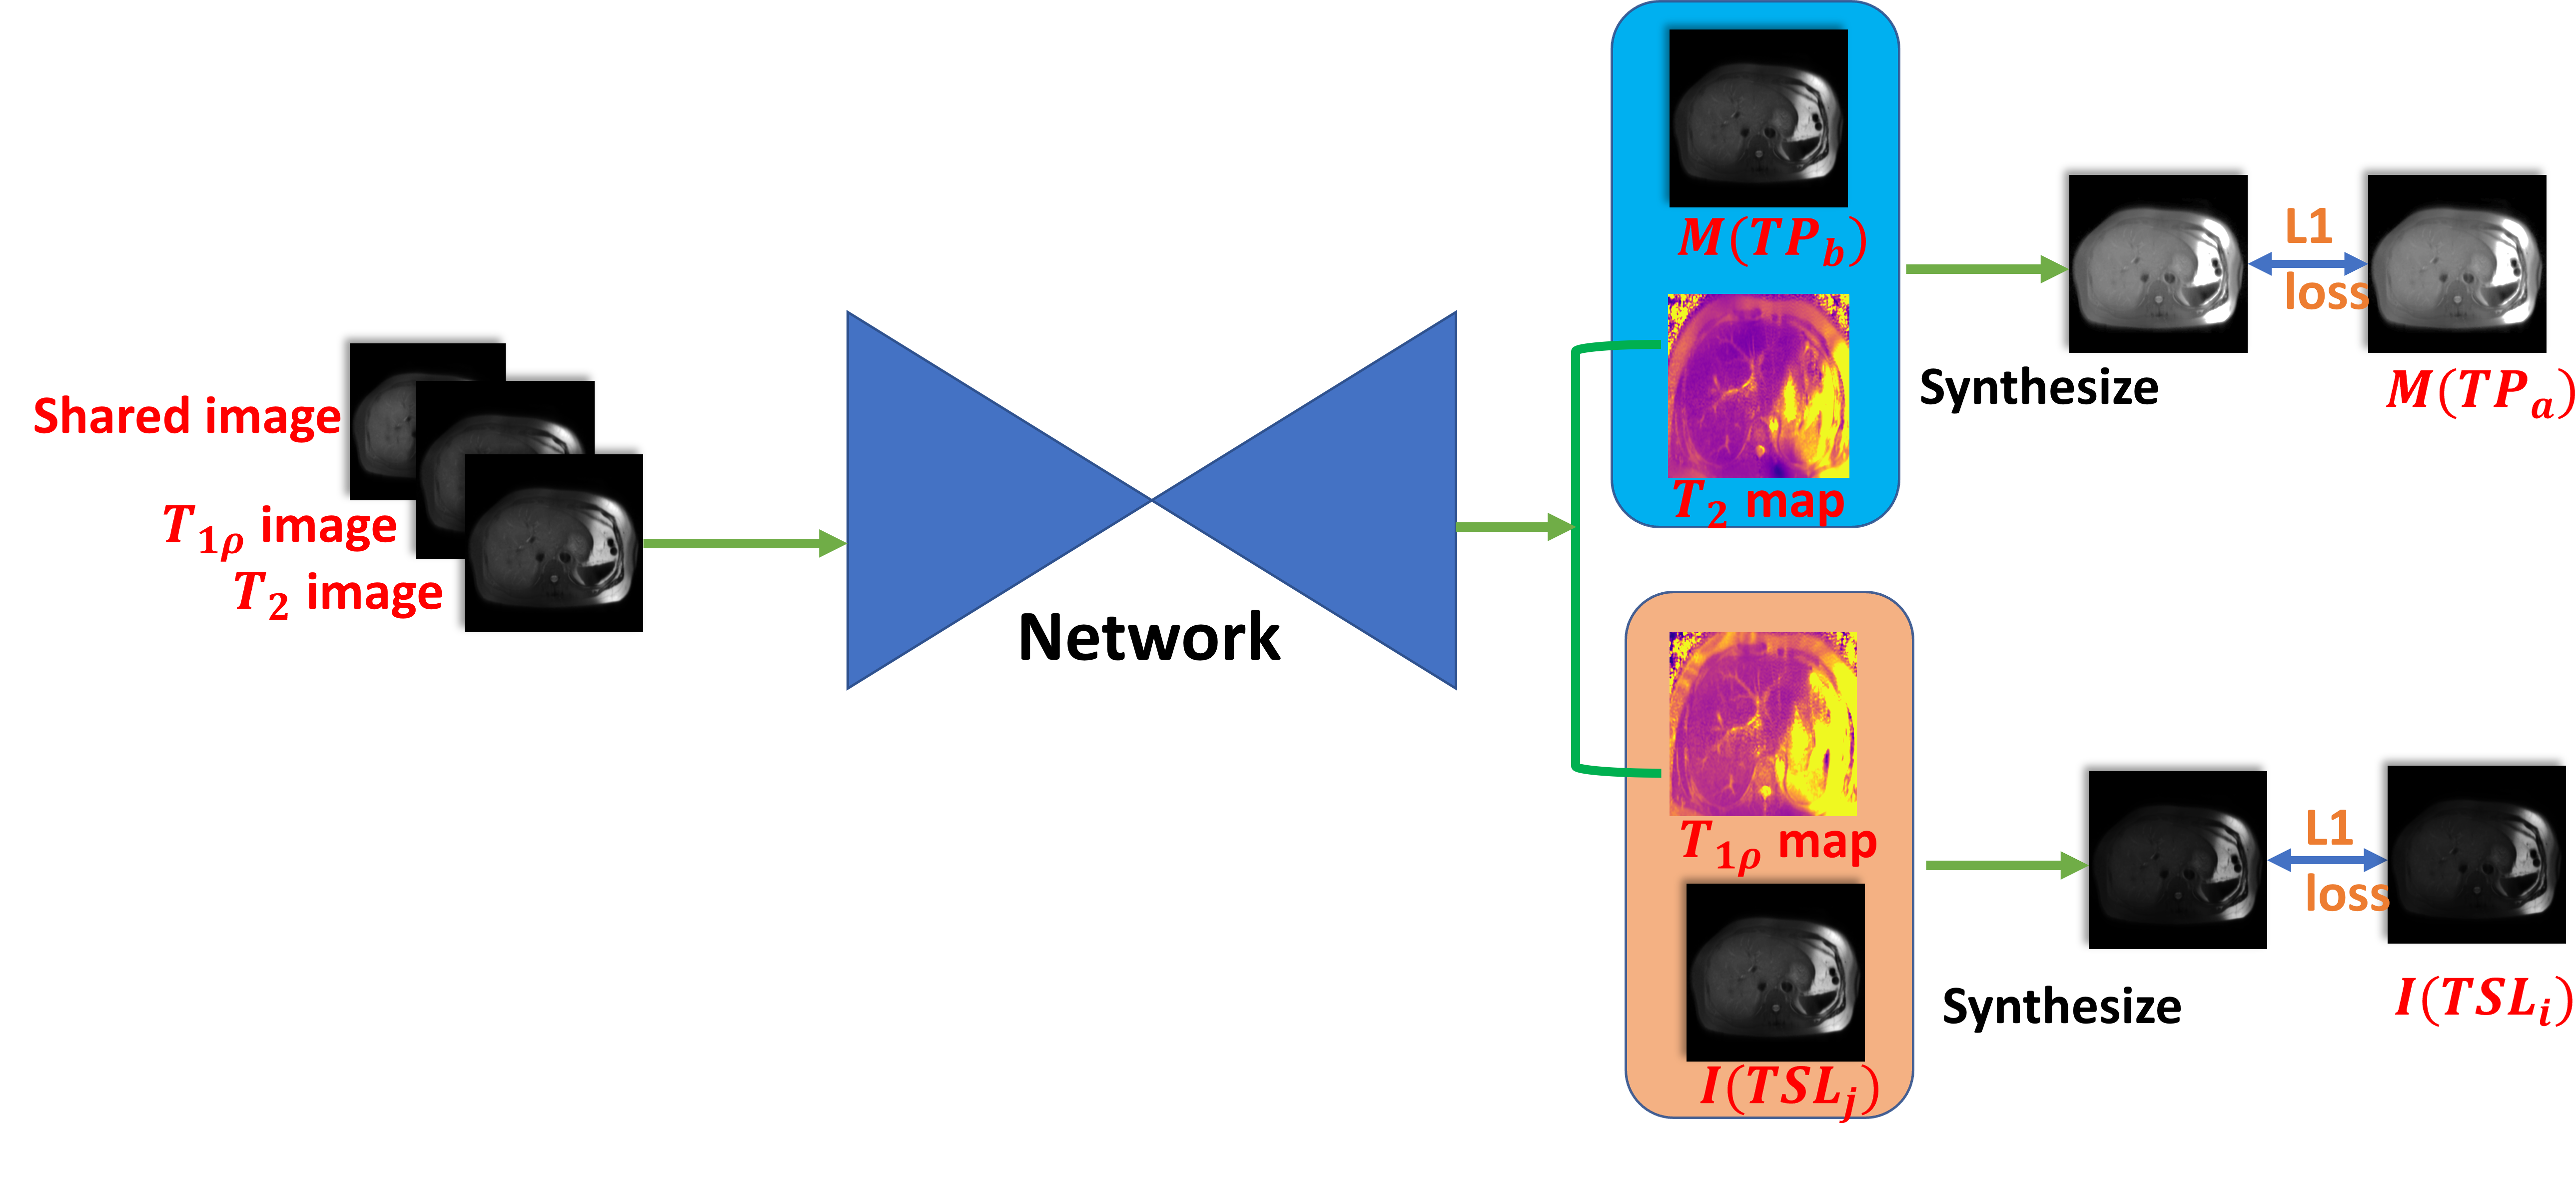
We stacked the shared image, a T1ρ weighted image and a T2 weighted image as the input of a convolutional neural network and gain the output of the parametric map of T1ρ and T2. Given a mono-exponential decay model, we have the following pairs of relaxation constraints of T1ρ image $$$I$$$ and T2 image $$$M$$$:$$$I(TSL_i)=I(TSL_j)exp(\frac{TSL_j-TSL_i}{T_{1\rho}})$$$ (1)
$$$M(TP_a)=M(TP_b)exp(\frac{TP_b-TP_a}{T_{2}})$$$ (2)
where $$$i$$$,$$$ j$$$, $$$a$$$, $$$b$$$ are the index of images with different time of spin-lock (TSL) or T2 preparation time (TP) in the same slice. We can construct the following loss function of a single forward pass for self-supervised learning:
$$$L = |I(TSL_j)exp(\frac{TSL_j-TSL_i}{T_{1\rho}})-I(TSL_i)| + |M(TP_b)exp(\frac{TP_b-TP_a}{T_{2}})-M(TP_a)| $$$ (3)
In practice, all possible pairs of constraint are constructed in the same slice and the loss is back-propagated in mini-batches. The network architecture is a UNet-like architecture that was originally designed for brain tumor segmentation in MRI [9]. The training pipeline is shown in Figure.1.
Model Evaluation
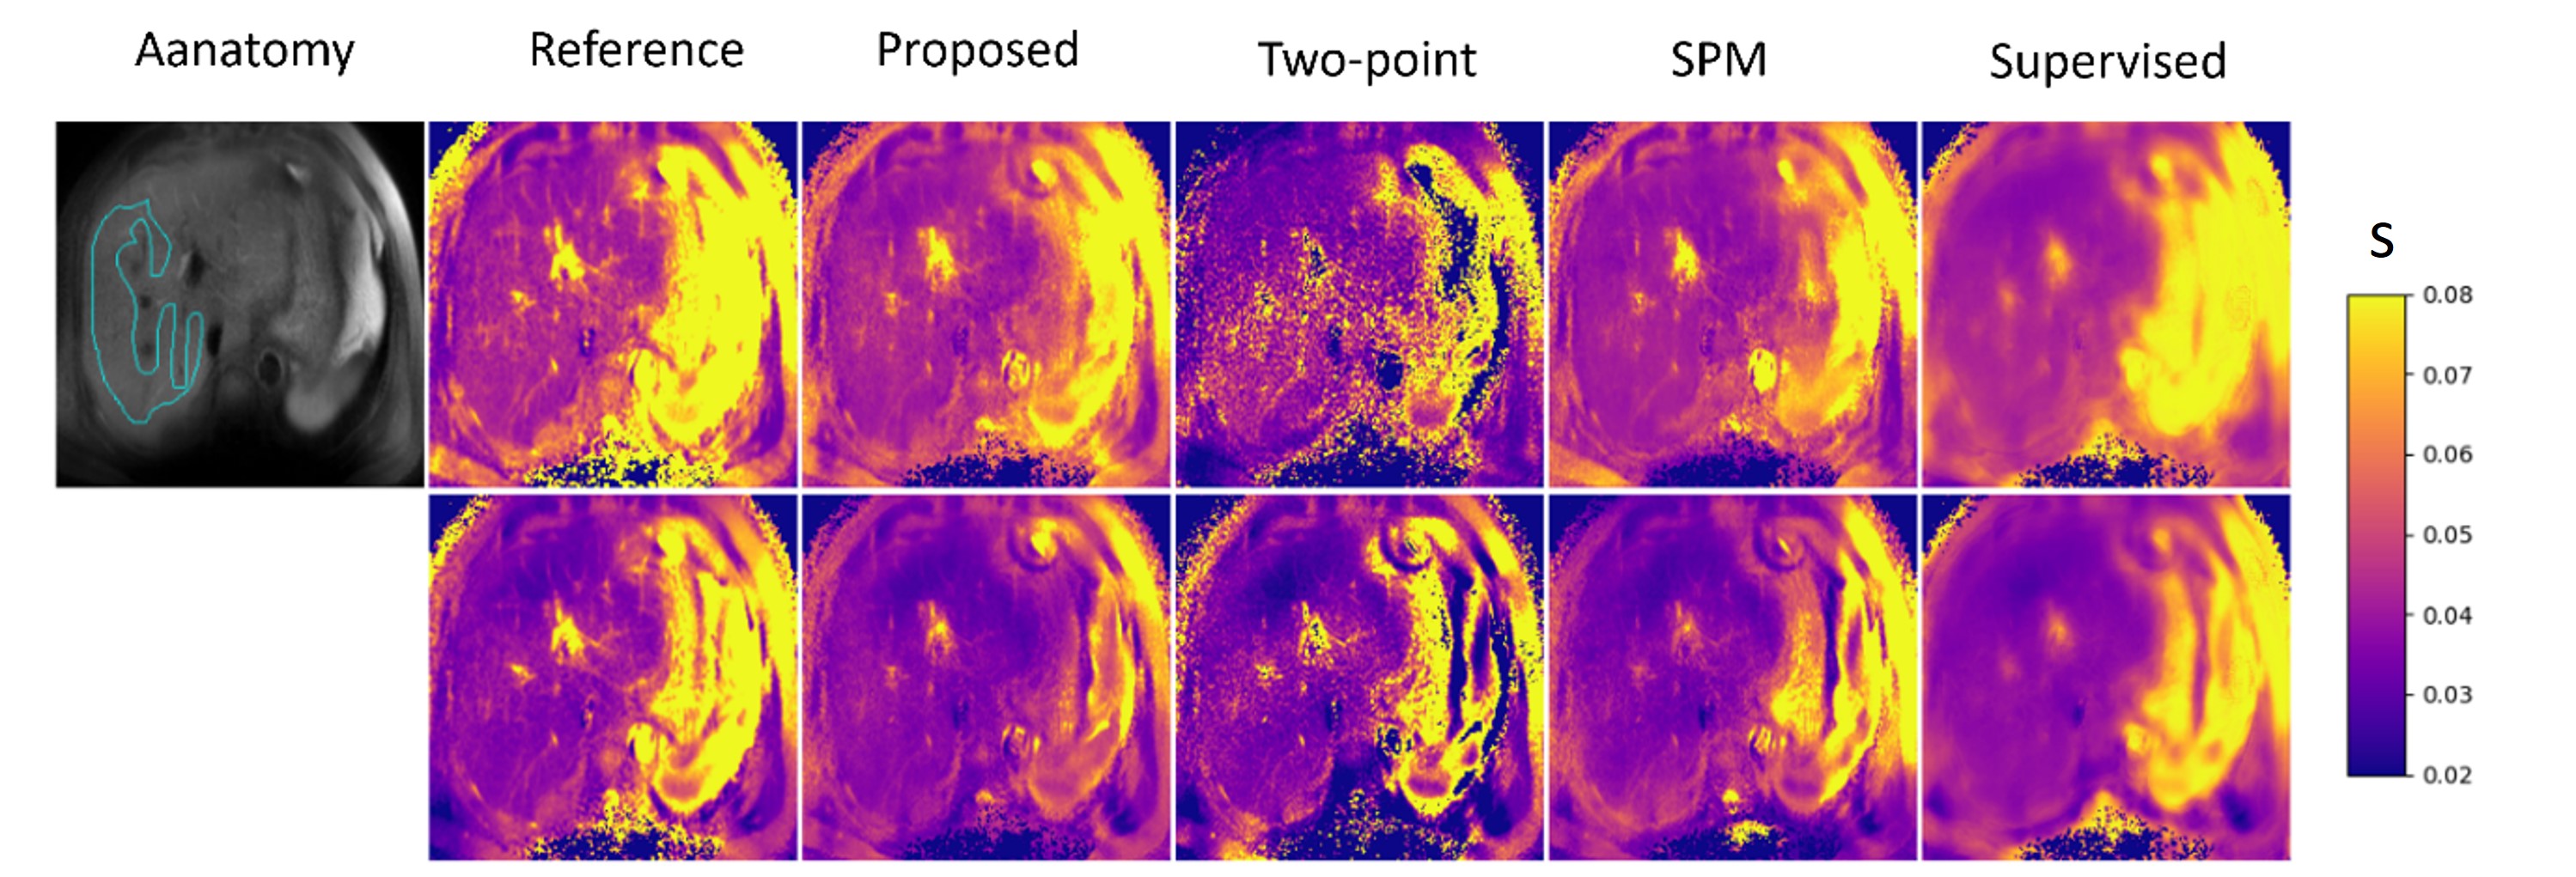
The model is evaluated by comparing the pixel-wise mean absolute error between the inference map and the reference map in the region of interest ( ROI). The reference maps of T1ρ and T2 are fitted from four T1ρ weighted images and four T2 weighted images respectively using the least square method. The ROI is manually drawn on the right-lobe of the liver to cover the liver parenchyma while avoiding large vessels and bile-ducts. Note that the shimming box only covers the right lobe of the liver and theT1ρ quantification is unreliable outside the shimming box due to exaggerated field inhomogeneity.Experiments and Results:
We compare the model with the following baseline.Two-point: Compute the parametric maps by taking the logarithm of the quotient between the shared image and the corresponding T1ρ weighted image or the T2 weighted image.
Single Parametric mapping (SPM): We trained two separate self-supervised networks that map T1ρ and T2 map respectively. Their loss function followed the constraint in Eq.(1) and Eq.(2), respectively.
Supervised learning: We trained a multi-parametric mapping network in a supervised way and the ground-truth for supervision were the reference maps fitted by four images.
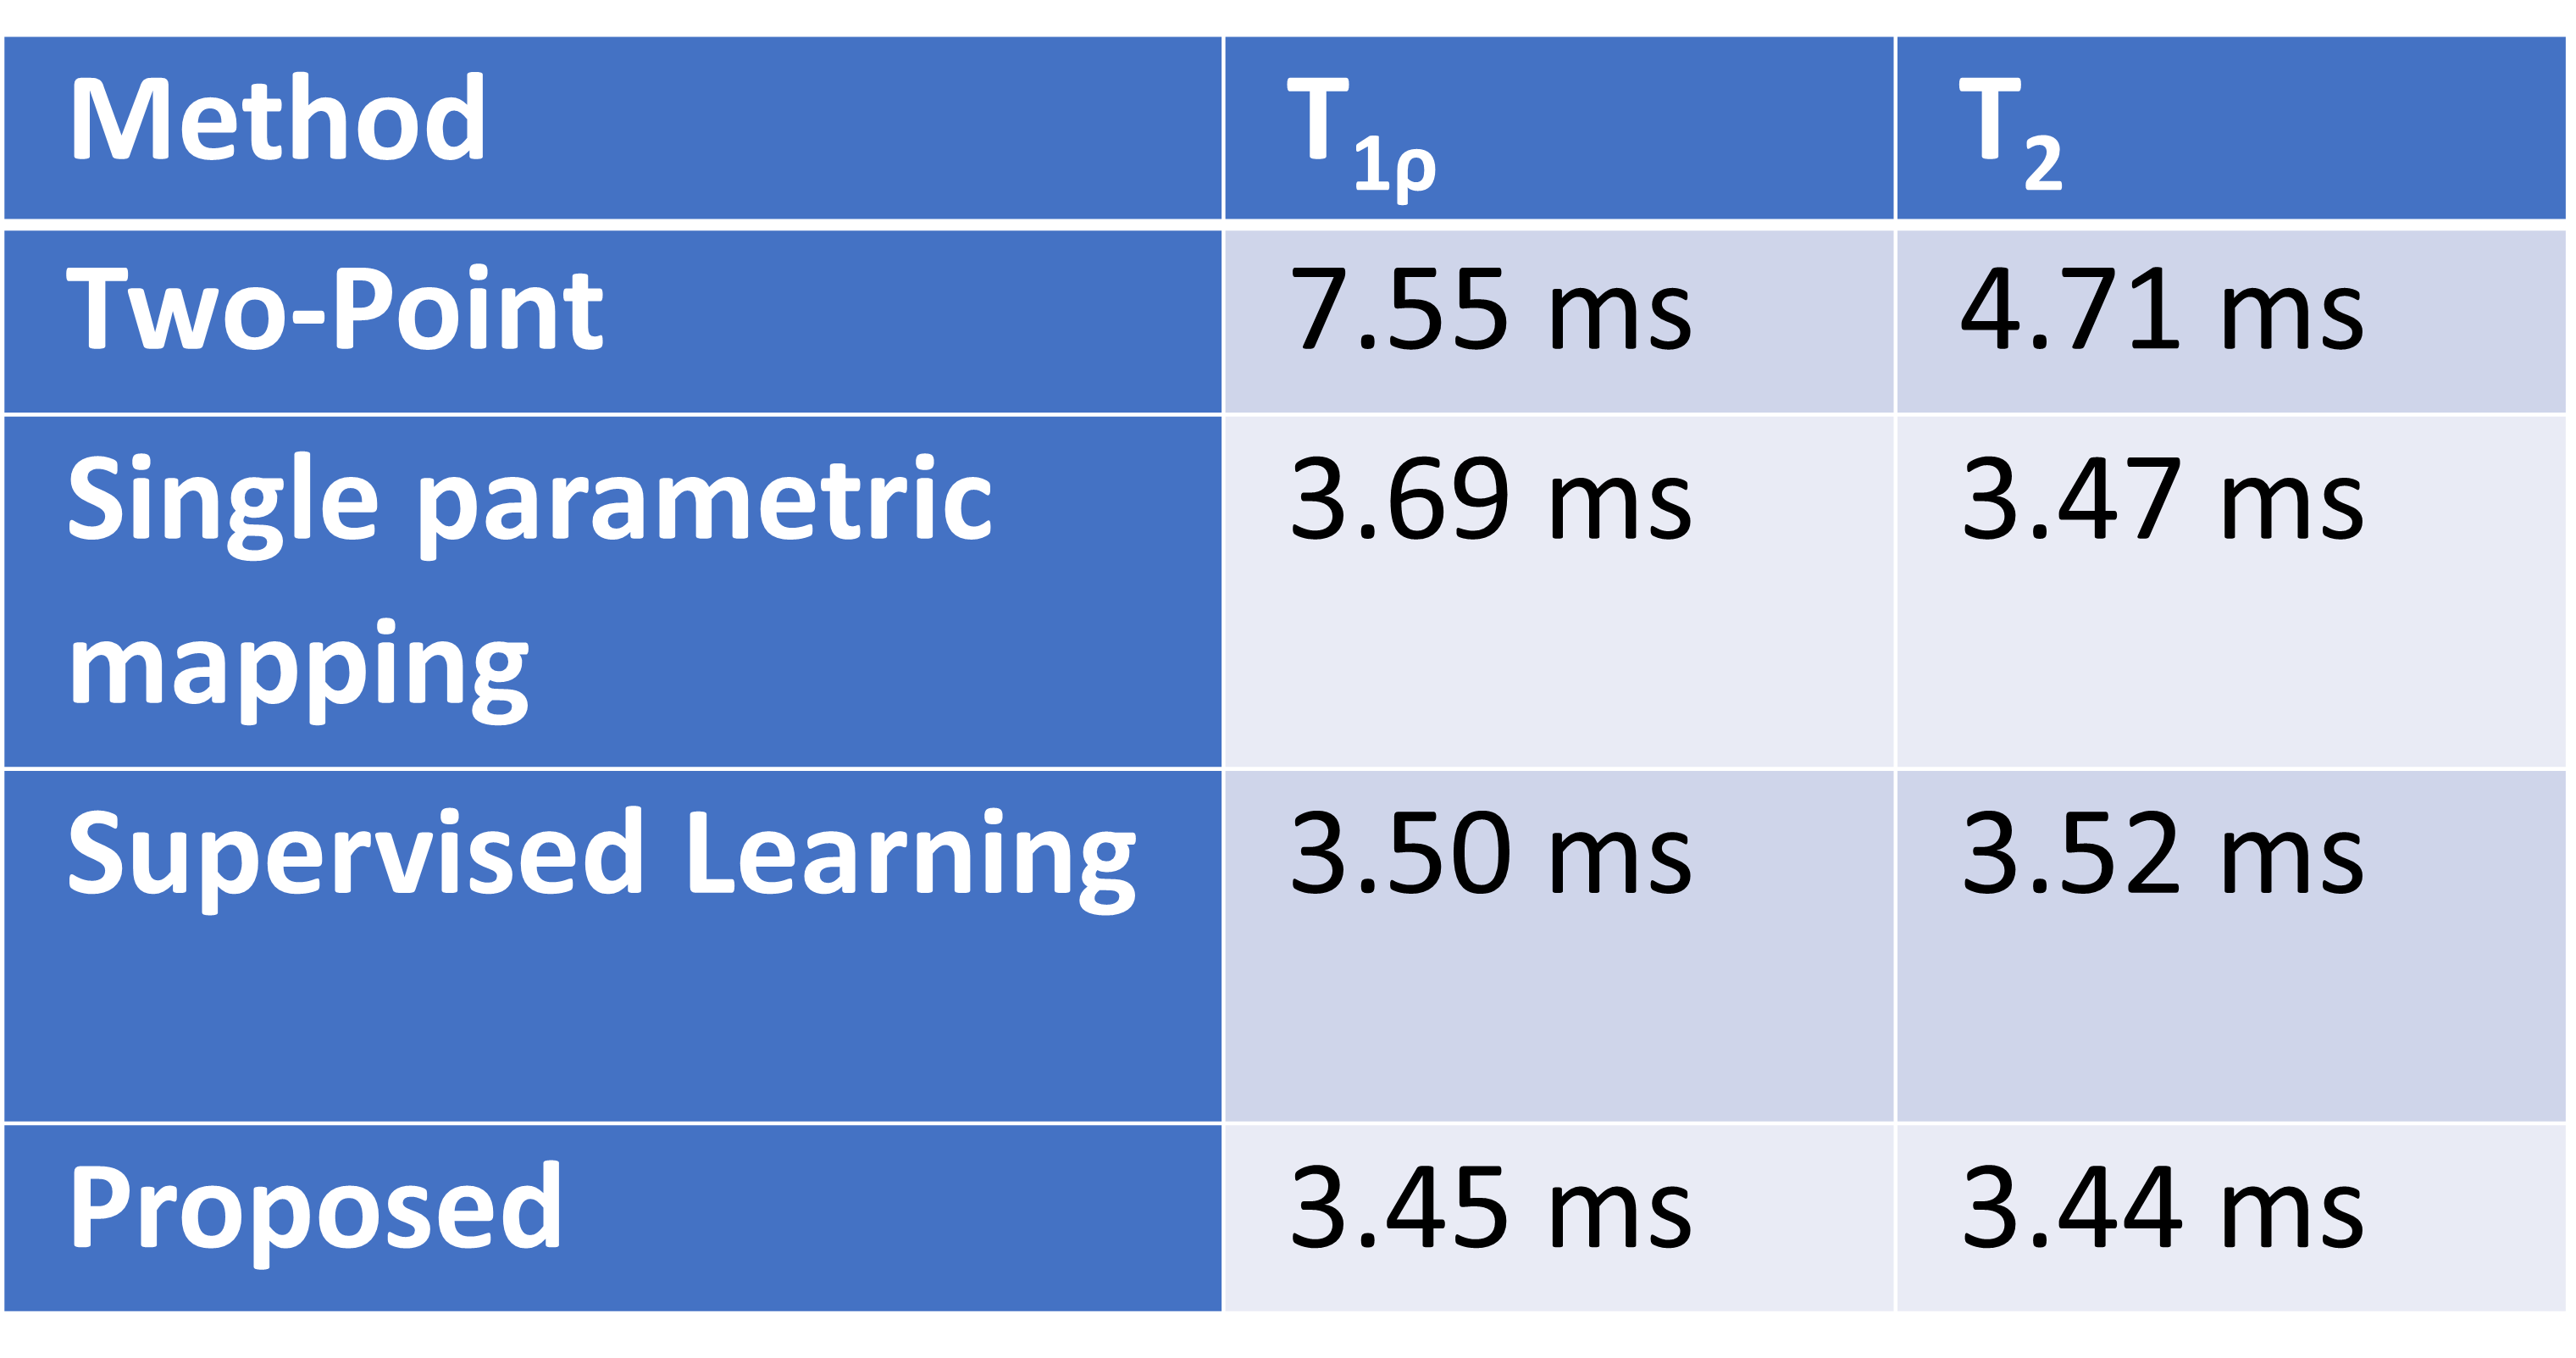
Table.2 shows the ROI-MAE of our proposed method and those baseline methods. The proposed method outperforms the Two-Point method significantly. Note our simultaneous multi-parametric mapping method achieves moderate improved performance compared to SPM and the supervised learning method. Figure.2 shows the representative example of the predicted maps of T1ρ and T2. The parametric maps produced by the proposed method are comparable to the reference maps in the liver ROI.
Discussion
Our deep model with physics constraint can filter out the corrupted noisy information without over-smoothing effect. It is also noticeable that our method has a better performance than the single parametric mapping. One possible explanation is that the network utilizes the contextual information between tissues, and the input of images from different contrast may provide more contextual information.Conclusion
Our proposed self-supervised multi-parametric mapping method can produce parametric maps comparable to the traditional fitting method, with a reduced number of images and thus reduced scan time.Acknowledgements
This study was supported by a grant from the Research Grants Council of the Hong Kong SAR (Project GRF 14201721), a grant from the Innovation and Technology Commission of the Hong Kong SAR (Project No. MRP/046/20X), and a grant from the Hong Kong Health and Medical Research Fund (HMRF) 06170166.References
[1] Serai SD. Basics of magnetic resonance imaging and quantitative parameters T1, T2, T2*, T1rho and diffusion-weighted imaging. Pediatric Radiology. 2021:1-11.
[2] Qiu S, Chen Y, Ma S, Fan Z, Moser FG, Maya MM, et al. Multiparametric mapping in the brain from conventional contrast‐weighted images using deep learning. Magnetic Resonance in Medicine. 2022;87(1):488-95.
[3] Moya-Sáez E, Peña-Nogales Ó, de Luis-García R, Alberola-López C. A deep learning approach for synthetic MRI based on two routine sequences and training with synthetic data. Computer Methods and Programs in Biomedicine. 2021;210:106371.
[4] Li H, Yang M, Kim J, Liu R, Zhang C, Huang P, et al., editors. Ultra-fast simultaneous T1rho and T2 mapping using deep learning. ISMRM Annual Meeting; 2020.
[5] Vasylechko SD, Warfield SK, Afacan O, Kurugol S. Self‐supervised IVIM DWI parameter estimation with a physics based forward model. Magnetic Resonance in Medicine. 2022;87(2):904-14.
[6] Torop M, Kothapalli SV, Sun Y, Liu J, Kahali S, Yablonskiy DA, et al. Deep learning using a biophysical model for robust and accelerated reconstruction of quantitative, artifact‐free and denoised images. Magnetic resonance in medicine. 2020;84(6):2932-42.
[7] Chen W, Wong VW, Chan Q, Wang Y, Chu WC, editors. Simultaneous acquisition of T1rho and T2 map of liver with black blood effect in a single breathhold. ISMRM 25th Annual Meeting Hawaii; 2017.
[8] Li, X., Wyatt, C., Rivoire, J., Han, E., Chen, W., Schooler, J., ... & Majumdar, S. (2014). Simultaneous acquisition of T1ρ and T2 quantification in knee cartilage: repeatability and diurnal variation. Journal of Magnetic Resonance Imaging, 39(5), 1287-1293.
[9] Buda M, Saha A, Mazurowski MA. Association of genomic subtypes of lower-grade gliomas with shape features automatically extracted by a deep learning algorithm. Computers in biology and medicine. 2019;109:218-25.
Figures