1602
Optimized MR Fingerprinting OPTIMUM in vivo in the vicinity of a metallic implant at low field1Center for Adaptable MRI Technology (AMT center), Department of Biomedical Engineering, University of Basel, Allschwil, Switzerland, 2AMT center, Institute of Medical Sciences, school of Medicine, Medical Sciences & Nutrition, University of Aberdeen, Aberdeen, United Kingdom
Synopsis
Keywords: Low-Field MRI, MR Fingerprinting
Magnetic susceptibility changes at interfaces induce artefacts, and hence compromises MRI diagnostic value. Low-Field (LF) MRI is inherently less sensitive to susceptibility artifacts making it suitable for imaging near metallic implants. In addition, the dispersion in T1-contrast is enhanced at LF. To evaluate the potential for new contrast mechanisms, quantitative imaging would be key if acquisition times are compatible with clinical constraints. In that context, model-based multi-parametric OPTIMUM was performed in a healthy volunteer’s forearm carrying a titanium plate from plate-osteosynthesis surgery. Performance of two signal models, one oblivious to intravoxel dephasing and the other accounting for it was compared.Introduction
Considering the global increase in aging population and prevalence of chronic diseases, market researchers expect the medical implants market to double in less that 10 years1, leading to a major rise in patients with implants prevalence. While non-invasive non-ionizing MRI provides high soft tissue contrast and has proven key in many clinical settings, it suffers from susceptibility artifacts and generally fails at air-tissue interfaces or near implants. Since magnetic susceptibility changes scale with the magnetic field strength, lowering the field strength of MRI scanners would make MR images less sensitive or even immune to susceptibility artifacts. Additional benefits of low-field MRI are not only the reduced overall cost and increased accessibility, but also the enhanced T1-contrast available in the very-low to ultra-low field regimes2,3. This opens perspectives in unveiling new endogenous contrasts, only available at low field. We demonstrate the feasibility of model-based multi-parametric OPTIMUM4 to quantify the and relaxation times at 100 mT in a healthy human forearm in vivo in the vicinity of a metallic implant.Methods
Images were acquired in a healthy volunteer carrying a titanium fixation plate as the result of plate-osteosynthesis surgery 12 years prior to this study. The MRI system consisted of a biplanar resistive electromagnet operating at 100 mT. We used an inductively matched, 10 cm long and 12 cm diameter cylindrical loop array RF coil in transceive mode (Attenuation: 28 dB, bandwidth: 32 kHz). We used an optimized, fully-balanced MR Fingerprinting based sequence (OPTIMUM) consisting of 18 pairs of flip angles and repetition times that were continuously looped over while covering k-space4. The matrix size was 90x81x15, of which 41% of the phase-encode locations were sampled according to a mask drawn from a Gaussian distribution, resulting in a total acquisition time of 4.25 min. The reconstructed voxel size was [1.4x1.2x9.4] mm3 and the imaging bandwidth was 15 kHz.The EDITER algorithm5 with two EMI detection coils tuned to the observed frequency was applied to the data. The resulting output was subjected to denoising with BM4D6 on the real and imaginary data for each fingerprint timepoint individually, and then further multiplied by a 2D Gaussian window. Parameter maps were reconstructed by a voxel-wise exhaustive search for the fingerprint maximizing the inner product magnitude from a dictionary simulated from Bloch equations.
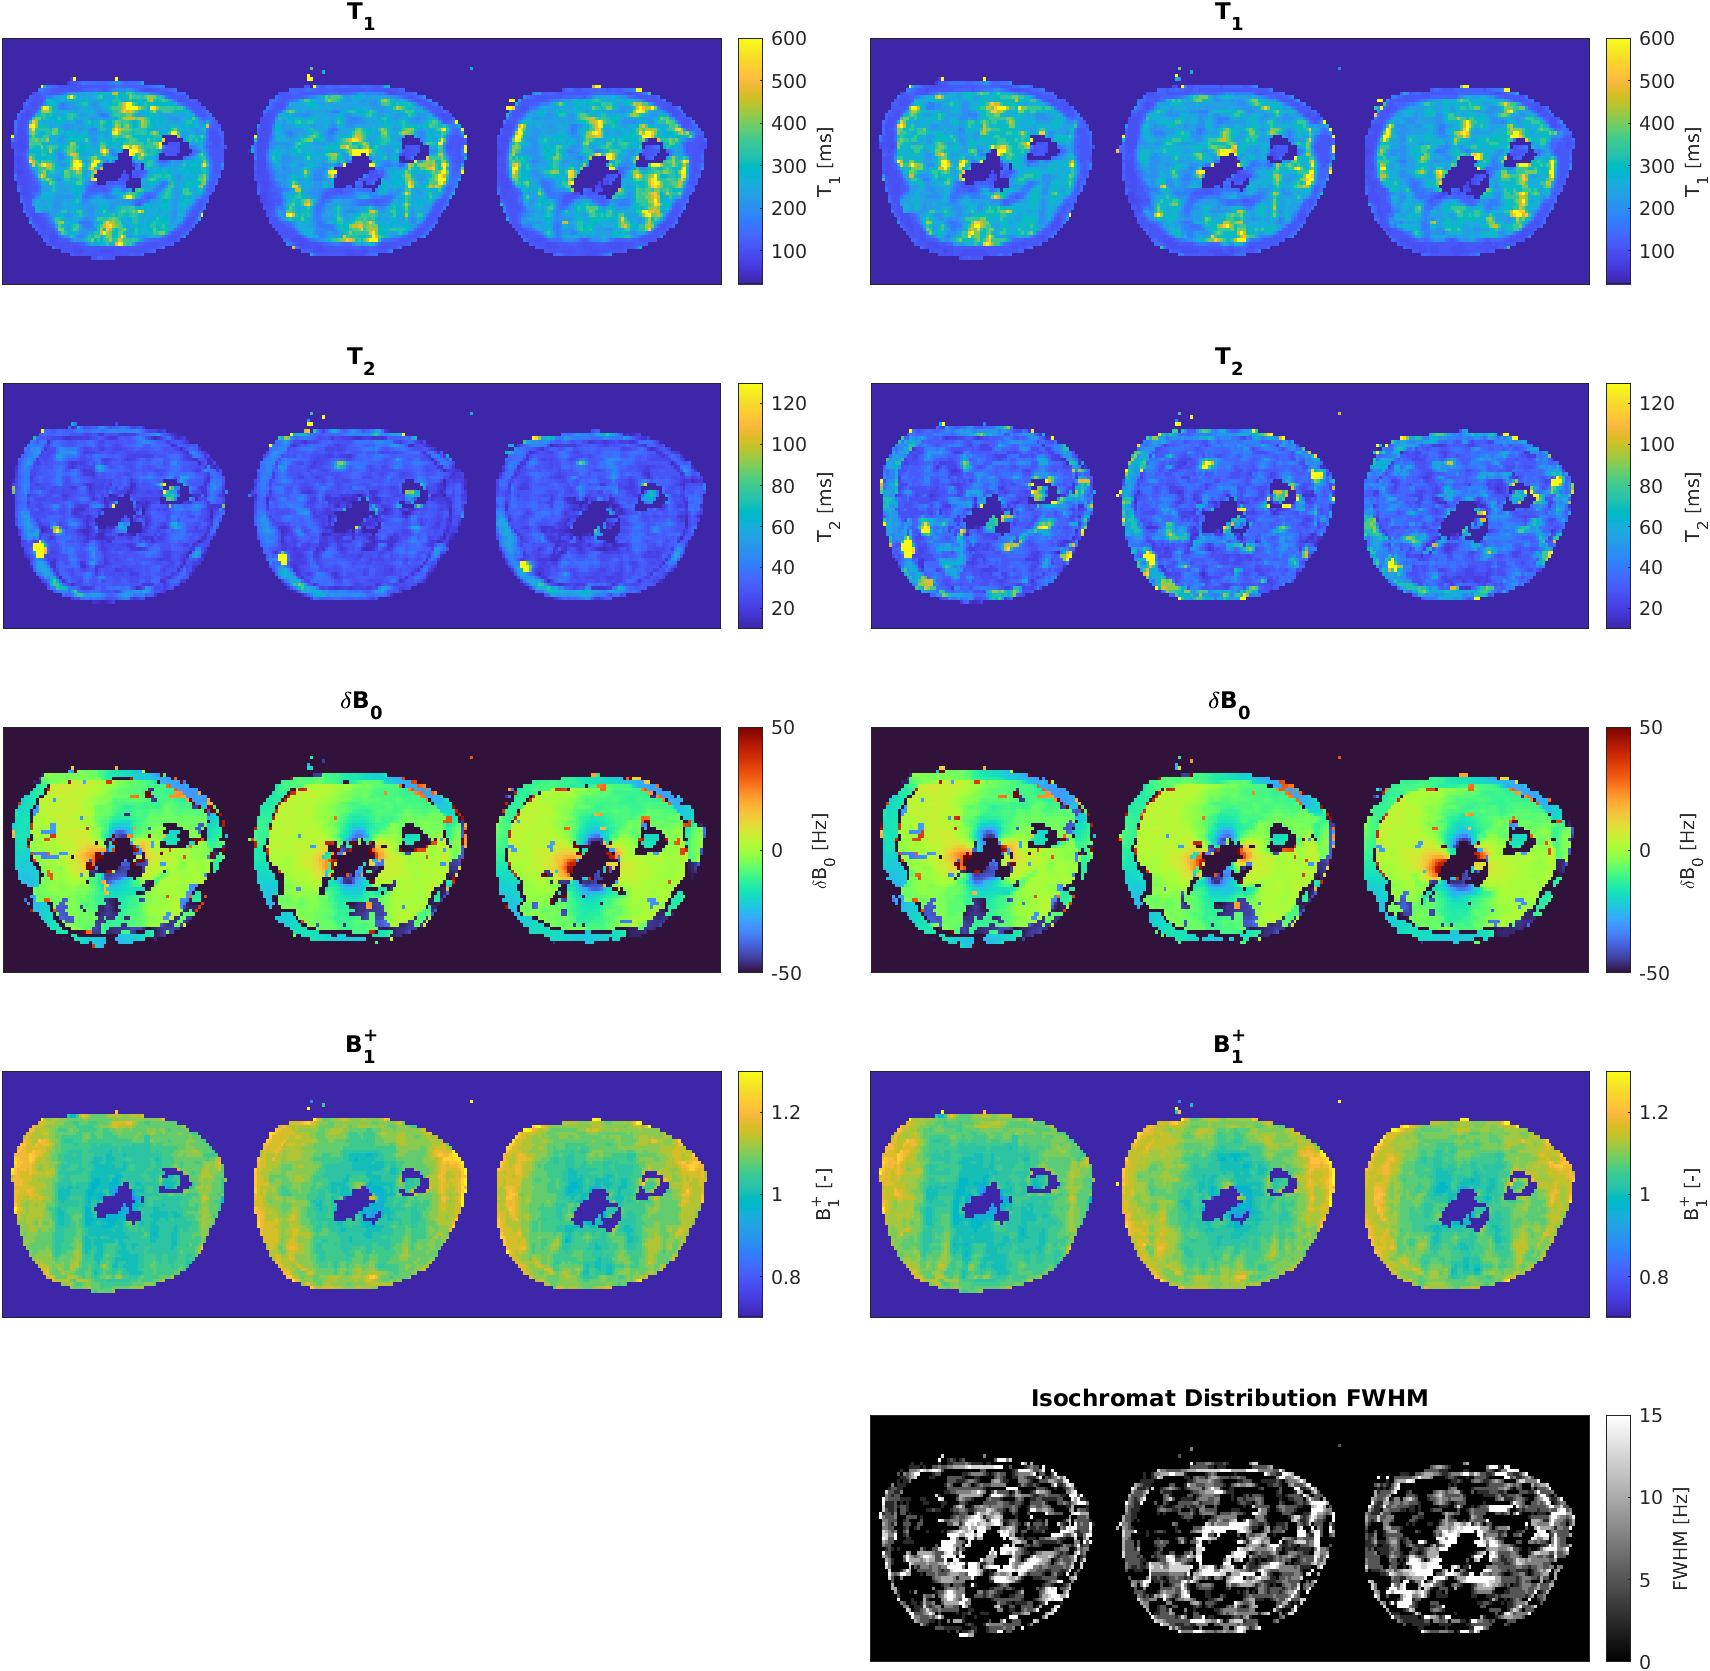
Two dictionaries for two different models were employed: A simple four-parameter model containing T1, T2, 𝜹B0 and B1+-fraction. Alternatively, a more refined model accounting for intravoxel dephasing, which was modeled as the superposition of the signal of Lorentzian-distributed isochromats centered around a given 𝜹B0 value. This resulted in the full-width at half-maximum (FWHM) of this distribution being a fifth parameter in the dictionary7. Parameter maps were thresholded by the L2-norm of the measured fingerprints and by a threshold of 0.5 on the magnitude of the best matching inner product to ignore background voxels.
Results
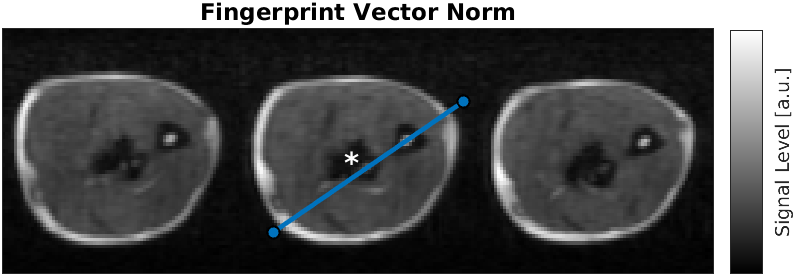
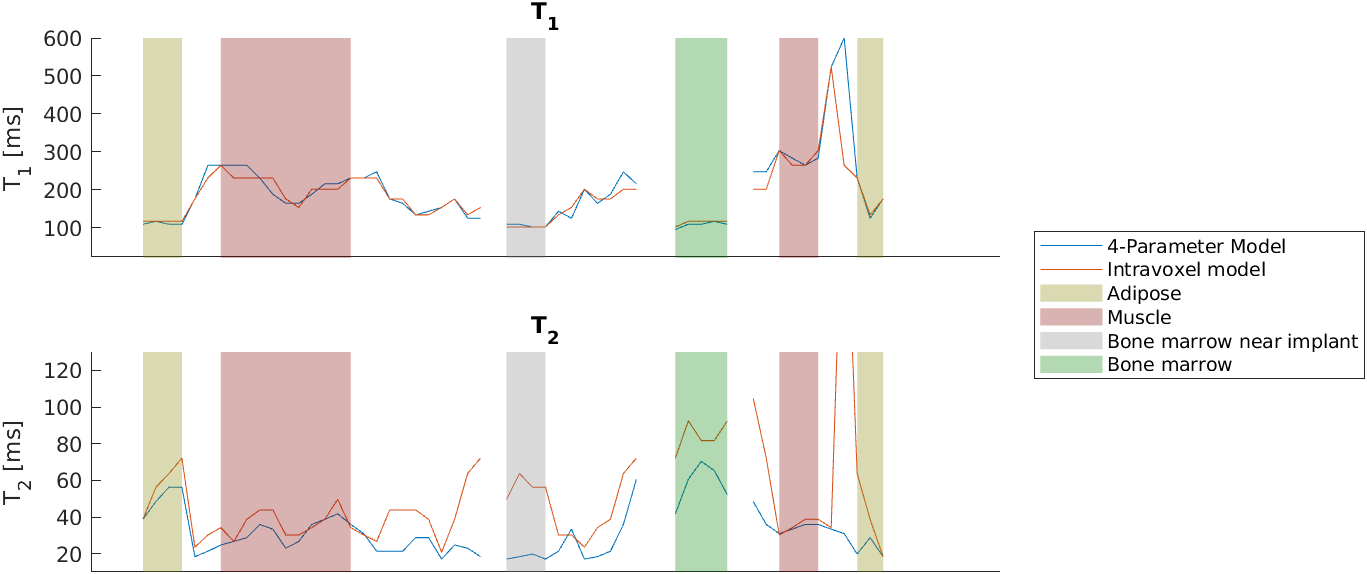
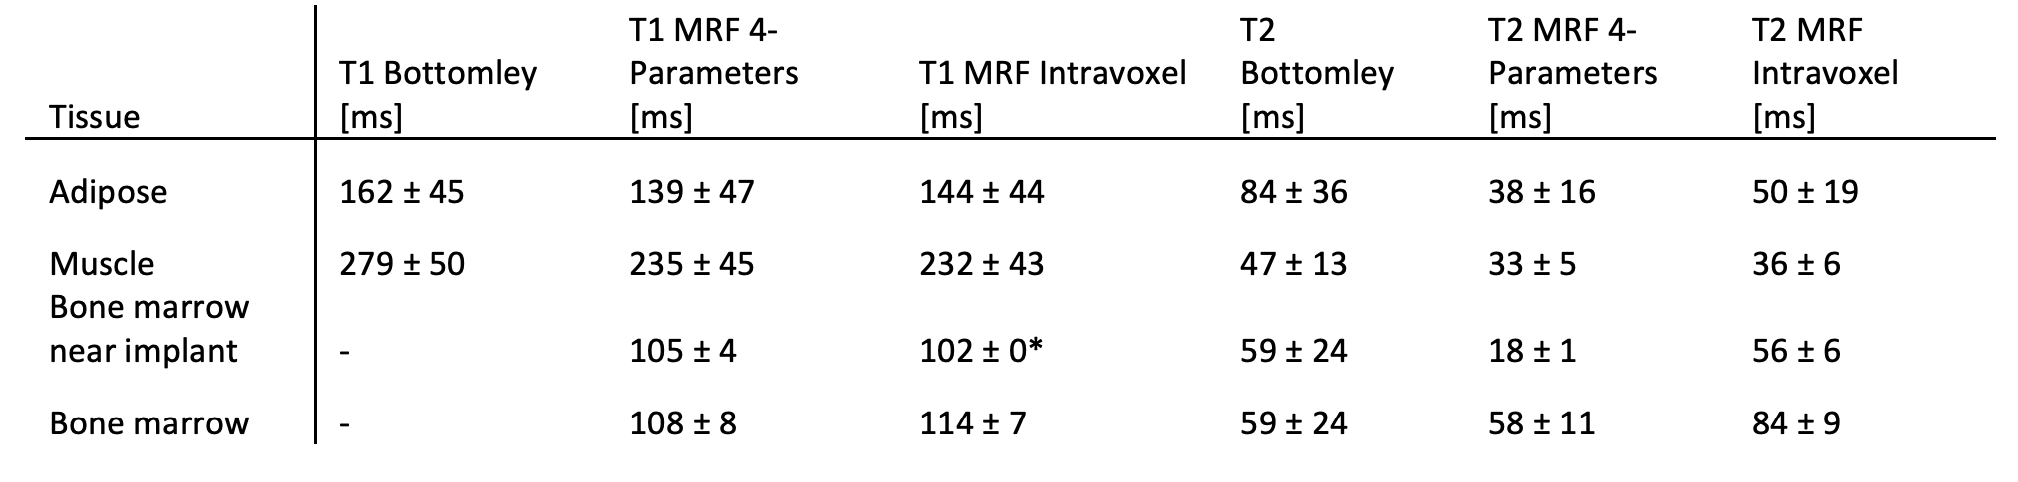
Figure 1 shows a composite image from all fingerprint timepoints. Three axial slices from the proximal section of the imaged forearm were selected. The implant is located in the center of the field of view.Reconstructed parameter maps are presented in Fig. 2 We extracted a linear profile of the central slice (see Fig. 1) that contains all the identifiable tissue types, which are presented in Fig. 3. Mean values of the per-tissue relaxation times extracted from the line profiles are summarized in Table 1 and compared to data from the literature.
Discussion
Our results show the feasibility of performing multi-parametric imaging in the vicinity of metallic implants. The presence of the implant leads to measurable distortion of the magnetic field.Generally, our T2 values obtained with the four-parameter model for muscular and adipose tissue are lower than what was reported from ex vivo samples in the literature. Except for muscle tissue, reconstruction with the model accounting for intravoxel dephasing consistently results in higher T2 values than without considering intravoxel effects. Intravoxel dephasing has been proposed to cause T2 underestimation for balanced MRF sequences9. The difference between the two models is particularly pronounced in the bone marrow adjacent to the implant (e.g. gray shaded area in Fig. 2), where the intravoxel frequency distribution is expected to be wider. Without the intravoxel model, the reconstructed of the bone marrow near the implant is lower by a factor of 3 than away from the implant, while the discrepancy under the intravoxel model is reduced to a factor of 1.5.
Our measured T1 values of muscle tissue are in agreement with existing literature reports8, however we point out our maps are not artifact free, resulting in relatively large standard deviations.
Our T1 values retrieved for adipose tissue is slightly lower than reported in literature. Overall differences are expected, considering that the results from the literature were obtained on ex vivo samples.
Conclusion
We have demonstrated the feasibility of MRF near metallic implants to retrieve relaxation times at low field. Our data suggests that the model accounting for intravoxel dephasing can reduce the T2 underestimation of the OPTIMUM approach.Acknowledgements
This work was supported by the Swiss National Science Foundation grants 186861 and 198905.References
1. Sayali S, Apoorva S, & Onkar S. Medical Implants Market
Size | Industry Forecast by 2027. Allied Market Research
https://www.alliedmarketresearch.com/medical-implants-market. Accessed November 10, 2022.
2. Fischer, H. W., Rinck, P. A., Haverbeke, Y. van & Muller, R. N. Nuclear relaxation of human brain gray and white matter: Analysis of field dependence and implications for MRI. Magn. Reson. Med. 16, 317–334 (1990).
3. Broche, L. M., Ross, P. J., Davies, G. R., MacLeod, M.-J. & Lurie, D. J. A whole-body Fast Field-Cycling scanner for clinical molecular imaging studies. Sci. Rep. 9, 10402 (2019).
4. Sarracanie, M. Fast Quantitative Low-Field Magnetic Resonance Imaging With OPTIMUM—Optimized Magnetic Resonance Fingerprinting Using a Stationary Steady-State Cartesian Approach and Accelerated Acquisition Schedules. Invest. Radiol. (2021).
5. Srinivas, S. A. et al. External Dynamic InTerference Estimation and Removal (EDITER) for low field MRI. Magn. Reson. Med. 87, 614–628 (2022).
6. Maggioni, M., Katkovnik, V., Egiazarian, K. & Foi, A. Nonlocal Transform-Domain Filter for Volumetric Data Denoising and Reconstruction. IEEE Trans. Image Process. 22, 119–133 (2013).
7. Wang, C. Y. et al. Magnetic resonance fingerprinting with quadratic RF phase for measurement of T2* simultaneously with δf, T1, and T2. Magn. Reson. Med. 81, 1849–1862 (2019).
8. Bottomley, P. A., Foster, T. H., Argersinger, R. E. & Pfeifer, L. M. A review of normal tissue hydrogen NMR relaxation times and relaxation mechanisms from 1–100 MHz: Dependence on tissue type, NMR frequency, temperature, species, excision, and age. Med. Phys. 11, 425–448 (1984).
9. Chiu, S.-C. et al. Effects of RF pulse profile and intra-voxel phase dispersion on MR fingerprinting with balanced SSFP readout. Magn. Reson. Imaging 41, 80–86 (2017).
Figures