1594
Relaxation Times of the Musculoskeletal Tissues at 0.55 T
Iman Khodarahmi1, Mary Bruno1, Ryan Brown1, Jan Fritz1, and Mahesh B Keerthivasan2
1NYU Langone School of Medicine, New York, NY, United States, 2Siemens Medical Solutions USA Inc., Malvern, PA, United States
1NYU Langone School of Medicine, New York, NY, United States, 2Siemens Medical Solutions USA Inc., Malvern, PA, United States
Synopsis
Keywords: Joints, MSK
Modern 0.55 T MRI promises to increase worldwide healthcare access through lower costs. Knowledge of the tissue relaxation parameters is essential to achieve the desired image contrast. Here for the first time, we quantify the T1 and T2 relaxation times of the musculoskeletal tissues through a Bloch model-based fitting approach. Our results show that the T1 relaxation time of non-fluid tissues is about 47% of those at 1.5 T. T2 relaxation times are about 70% of that of 1.5 T for synovial fluid, bone marrow and subcutaneous fat, and approximately similar to that of 1.5 T for cartilage and muscle.Introduction
Currently available for clinical use, modern low-field (0.55 T) MRI systems promise to increase worldwide healthcare access through substantially lower costs. Novel hardware technology, advanced pulse sequences, and deep learning-based image reconstruction enable acquisition of diagnostically accurate images despite the inherent lower signal-to-noise ratio (SNR) of the lower field strength 1. To achieve the desired image contrast on these platforms, knowledge of the relaxation parameters along with appropriate selection of repetition time (TR) and echo time (TE) is essential. While field dependence is well established for T1 recovery, T2 is found to be essentially independent of the field strength and dependent mainly on tissue type in the range of low and clinical field strengths 2. A previous study of non-musculoskeletal tissues reported T1 and T2 relaxation times to be 32% shorter and 26% longer, respectively, at 0.55 T than at 1.5 T 3. To our knowledge, however, such values of the musculoskeletal tissues are not available in the literature. The purpose of the current study was to measure relaxation times in musculoskeletal tissues at 0.55 T.Methods
T1 Relaxometry: T1 relaxation parameters were estimated using a three-dimensional (3D) variable flip angle (VFA) spoiled gradient recalled acquisition (SPGR) technique with seven flip angles of 4, 6, 9, 11, 14, 18, and 22°. Other acquisition parameters included TE/TR = 1.6/3.8 ms, voxel size = 0.8 x 0.8 x 3.0 mm3, and NEX = 4. T1 estimates were obtained using a non-linear least squares algorithm to fit the data to the SPGR signal model 4.T2 Relaxometry: T2 relaxation times were estimated using a two-dimensional multi-echo spin echo technique. Two sets of images were obtained one with TR = 1500 ms and 10 equally-spaced TEs of 15-150 ms to resolve low T2 values, and a second with TR = 2500 ms and 20 equally-spaced TEs of 30-600 ms to resolve high T2 values. The voxel size was 0.8 x 0.8 x 5.0 mm3. A dictionary of the signal model was generated by solving the Bloch equation for the sequence parameters and a range of T2 (10ms – 1000ms) and nominal B1 (0.5 – 1.5). T2 estimates were obtained by fitting the experimental data to the Bloch simulation-based dictionary 5.
Phantom Validation: Quantification accuracy was evaluated using a set of agarose gel phantoms with T1 and T2 in the typical range observed in vivo. An additional tube of water was included to serve as a surrogate for synovial fluid. Reference T1 values were obtained using an inversion recovery single echo (IR-SE) sequence with inversion times (TI) = 100 – 4000 ms, = 250 ms. Reference T2 estimates were obtained using a single echo spin echo with TE = 10 – 200ms = 20ms. A second set of acquisitions with TEs = 100 - 1000 ms = 100 ms were used to estimate long T2 species. Further, a reproducibility study was performed by scanning the same set of phantoms in a two-week interval.
Subjects: Six healthy volunteers (women/men: 3/3, right/left: 3/3, age: 29–55 years) were imaged at a 0.55 T system (commercial 1.5 T system detuned to operate at 0.55 T, Siemens Healthcare GmbH) with a maximum gradient strength of 25 mT/m and a maximum slew rate of 40 T/m/s. A ten-channel receive-only phased array flexible coil was used for signal reception (QED, Mayfield Village, OH). The local institutional review board first approved all MRI examinations. Axial or sagittal image sets containing synovial fluid, bone marrow, subcutaneous fat, cartilage, and muscle were acquired.
Results and Discussion
Table 1 summarizes the results from the phantom experiments. Note that the relative error is less than 11% for all T1 and T2 values except for the long relaxation time water tube. The range of TEs and flip angles considered in the proposed protocol results in an underestimation of the long relaxation times. Further, the T1 estimates were not corrected for B1 effects resulting in increased estimation error. Figure 1 shows Bland-Altman plots comparing the estimates obtained from two separate measurements. The T1 and T2 estimates have coefficients of reproducibility of 4.72 and 5.47 respectively. The corresponding coefficient of variation was 0.14% and 1.52% indicating very high agreement between measurements.Table 2 summarizes the relaxation parameters of different musculoskeletal tissues. Excluding synovial fluid in which the measured relaxation times could not be estimated accurately, the T1 relaxation time for other tissues is about 47% of those of 1.5 T 6. On the other hand, T2 relaxation times were about 70% of that of 1.5 T for synovial fluid, bone marrow and subcutaneous fat, and comparable to that of 1.5 T for cartilage and muscle. Figure 2 shows representative T1 and T2 maps for a volunteer along with the corresponding morphological T2-weighted image. The parameter maps demonstrate good relative contrast with respect to the synovial fluid in spite of the underestimation of the fluid relaxation times.
Conclusion
Relaxation parameters of the musculoskeletal tissues were obtained in healthy volunteers using a Bloch model-based fitting approach. Such values can be used to design sequence parameters for any desired image contrast.Acknowledgements
No acknowledgement found.References
- Khodarahmi I, Keerthivasan MB, Brinkmann I, et al. Modern Low-Field MRI of the Musculoskeletal System: Practice Considerations, Opportunities, and Challenges. Invest Radiol, 2022.
- Bottomley PA, Foster TH, Argersinger RE, Pfeifer LM. A review of normal tissue hydrogen NMR relaxation times and relaxation mechanisms from 1-100 MHz: dependence on tissue type, NMR frequency, temperature, species, excision, and age. Med Phys. 1984;11(4):425-48.
- Campbell-Washburn AE, Ramasawmy R, Restivo MC, et al. Opportunities in Interventional and Diagnostic Imaging by Using High-Performance Low-Field-Strength MRI. Radiology. 2019;293(2):384-93.
- Ramos-Llorden G, Vegas-Sanchez-Ferrero G, Bjork M, et al. NOVIFAST: A Fast Algorithm for Accurate and Precise VFA MRI Mapping. IEEE Trans Med Imaging. 2018;37(11):2414-2427.
- Ben-Eliezer N, Sodickson DK, and Block KT. Rapid and accurate T2 mapping from multi-spin-echo data using Bloch-simulation-based reconstruction. Magn Reson Med. 2015;73(2):809-17.
- Gold GE, Han E, Stainsby J, et al. Musculoskeletal MRI at 3.0 T: relaxation times and image contrast. AJR Am J Roentgenol. 2004;183(2):343-51.
Figures
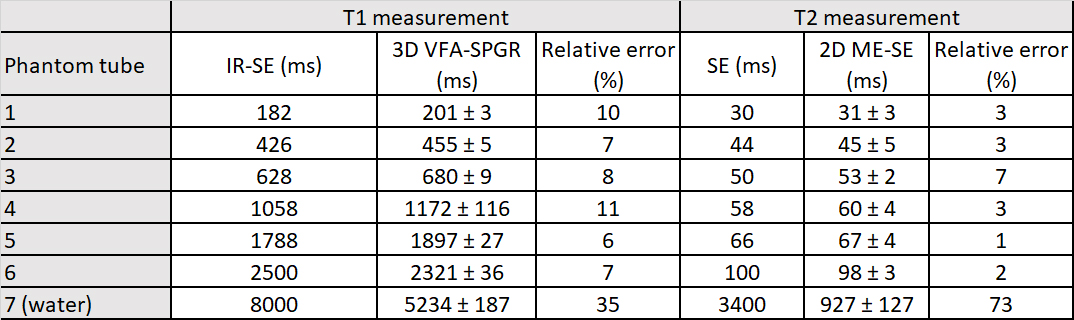
Table 1. Phantom validation of the T1 and T2 relaxometry
techniques.
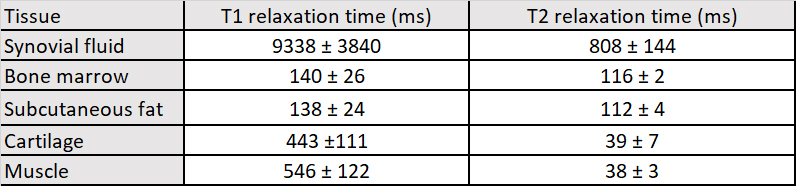
Table 2. In-vivo relaxation times of musculoskeletal tissues
at 0.55 T.
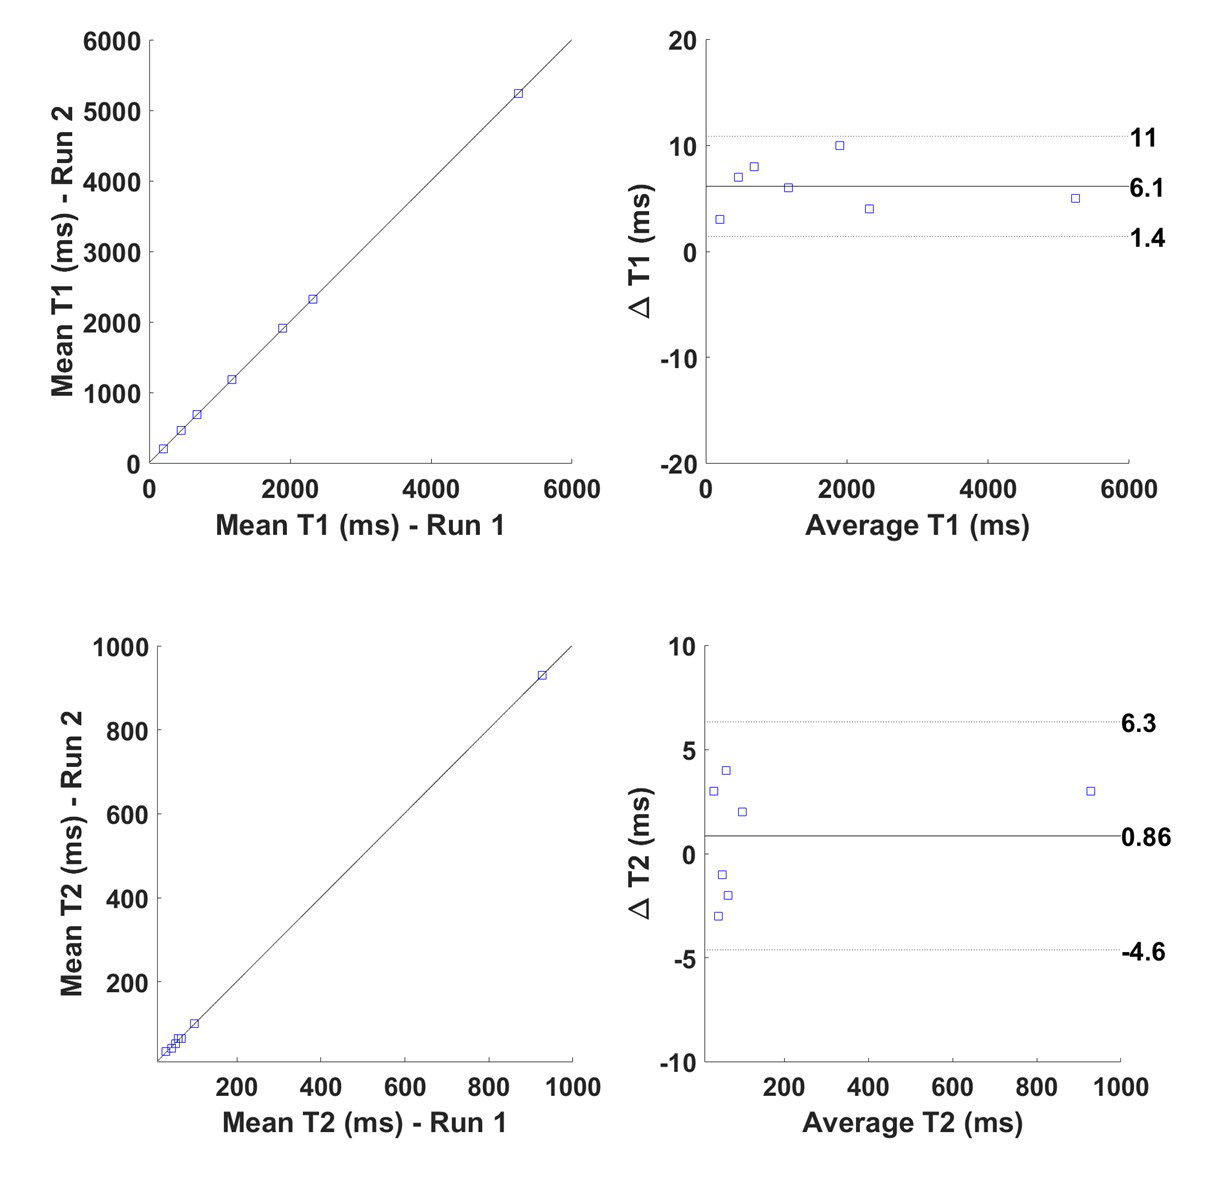
Figure 1. Bland-Altman plots comparing the T1 and T2 estimates
obtained from two separate measurements.
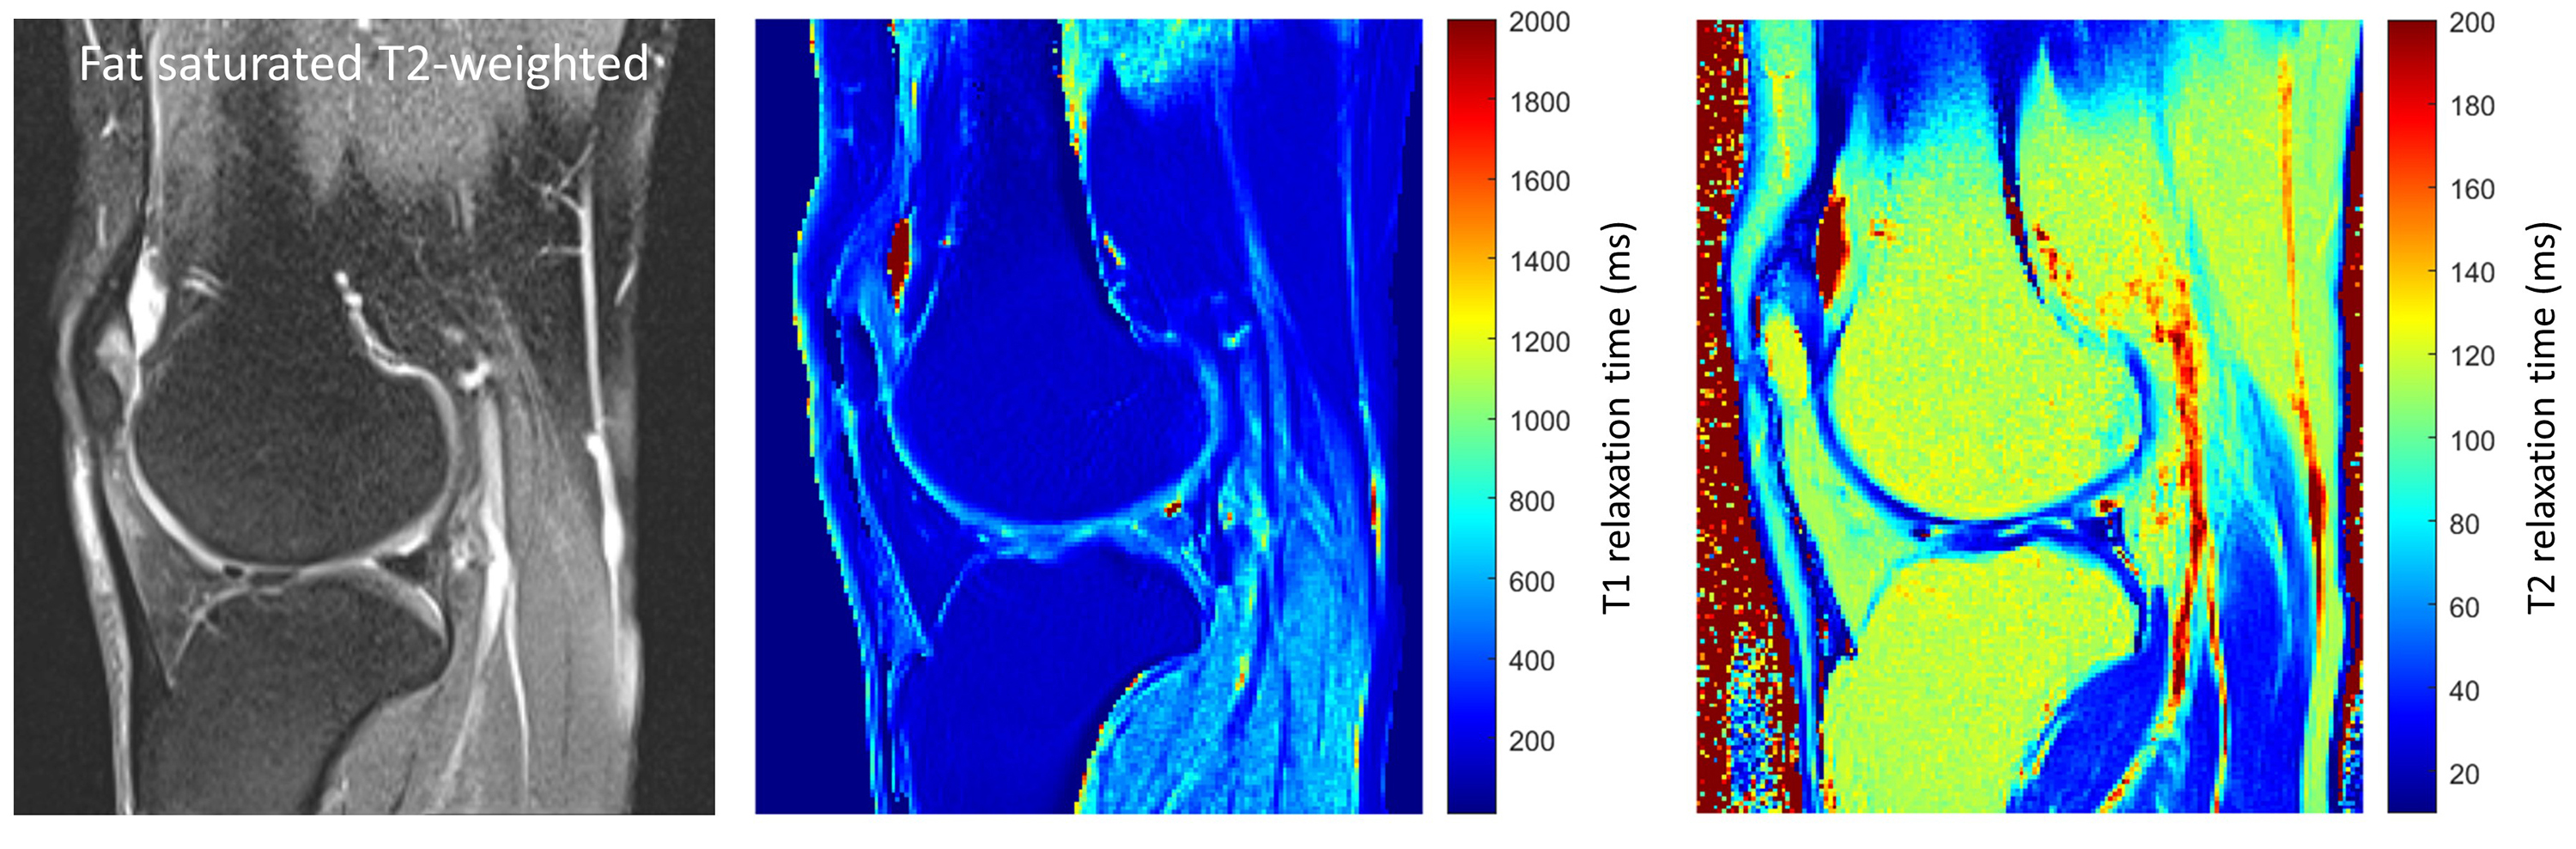
Figure 2. Representative morphological fat-saturated
T2-weighted image and corresponding T1 and T2 maps of a healthy volunteer.
DOI: https://doi.org/10.58530/2023/1594