1591
Magnetic Resonance Elastography at 0.055 Tesla: A Preliminary Study1Laboratory of Biomedical Imaging and Signal Processing, the University of Hong Kong, Hong Kong, China, 2Department of Electrical and Electronic Engineering, the University of Hong Kong, Hong Kong, China
Synopsis
Keywords: Low-Field MRI, Elastography
Recent development of ultra-low-field (ULF) MRI presents opportunities for low-cost and portable imaging in point-of-care scenarios or/and low- and mid-income countries. Magnetic resonance elastography (MRE) is an essential part of MR abdominal imaging especially for chronic liver diseases. In this study, we explore the MRE at 0.055 Tesla. We demonstrate the feasibility of MRE based on phantom experiments at 0.055 Tesla.Introduction
Magnetic resonance elastography (MRE) allows noninvasive quantification of tissue mechanical properties [1]. It can provide valuable information in aiding the diagnosis of chronic liver diseases [2], prostate cancer screening [3], et al. However, due to the required long echo time (TE) for motion encoding gradients (MEG), MRE suffers from severe susceptibility introduced signal loss where iron overload, metal implants and air-tissue interface exit [4]. Ultra-low-field (ULF) MRI has much less susceptibility artifacts than high field, and also presents tremendous opportunities for low-cost and portable MRE in point-of-care scenarios or/and low- and mid-income countries [5-11]. MRE has been successfully demonstrated at 0.1 Tesla [4], and we further push it to a lower field of 0.055 Tesla in this study.Method
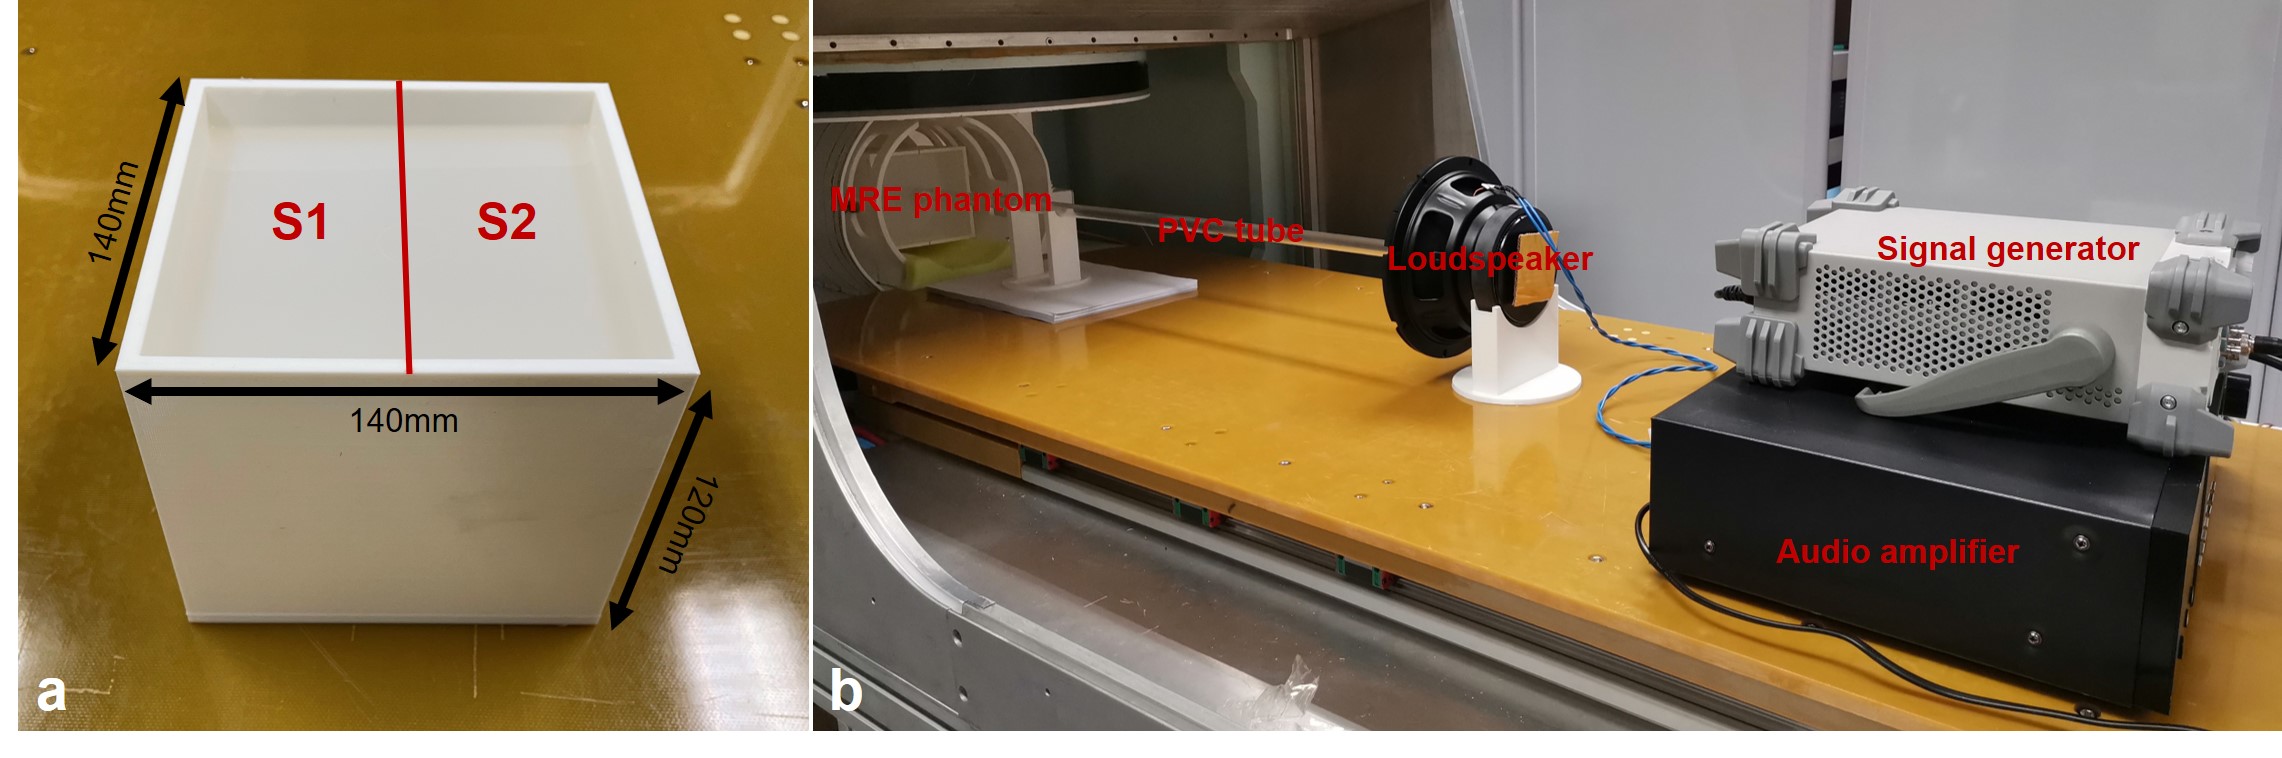
Phantom experimentsAll phantom experiments were conducted on a permanent magnet based 0.055 Tesla MRI scanner with a head coil [5]. The scanner was compact and free from any magnetic and RF shielding. The MRE phantom consisted of 2 types of silicone rubber S1 and S2 with different stiffnesses and the same volume of 130×65×110mm3 (Fig. 1a). This phantom was stored in a 3D-printed square box with size of 140×140×120mm3 and wall thickness of 5mm (Fig. 1a). The custom vibration system consisted of signal generator, audio amplifier, loudspeaker and PVC hard tube (Fig. 1b). The sinusoidal signal was generated, and the corresponding sinusoidal vibration was conveyed by the PVC tube to the surface of the MRE phantom.
3D GRE sequences were implemented with MEG applied along slice direction. The sequence parameters were: MEG frequency = 200Hz, MEG amplitude = 12mT/m, flip angle = 35°, TE = 11ms, BW = 10kHz, acquisition resolution = 4×4×4mm3, matrix size = 40×40×32, slab thickness = 128mm, NEX = 1. The vibration was applied along slice direction at the center of the contact plane. The radius of circle contact surface was 10mm. Two vibration frequencies of 50Hz and 100Hz were used. The corresponding TRs were 40ms and 50ms, resulting in the scan time of 51s and 64s.
Five pairs of fully sampled data with default (MEG+) and inverted (MEG-) polarity MEG was acquired with five different sinusoidal signal phases (0°, 72°, 144°, 216° and 288°). One pair of reference data was also acquired with opposite MEGs (REF+ and REF-) and no vibration.
Data processing
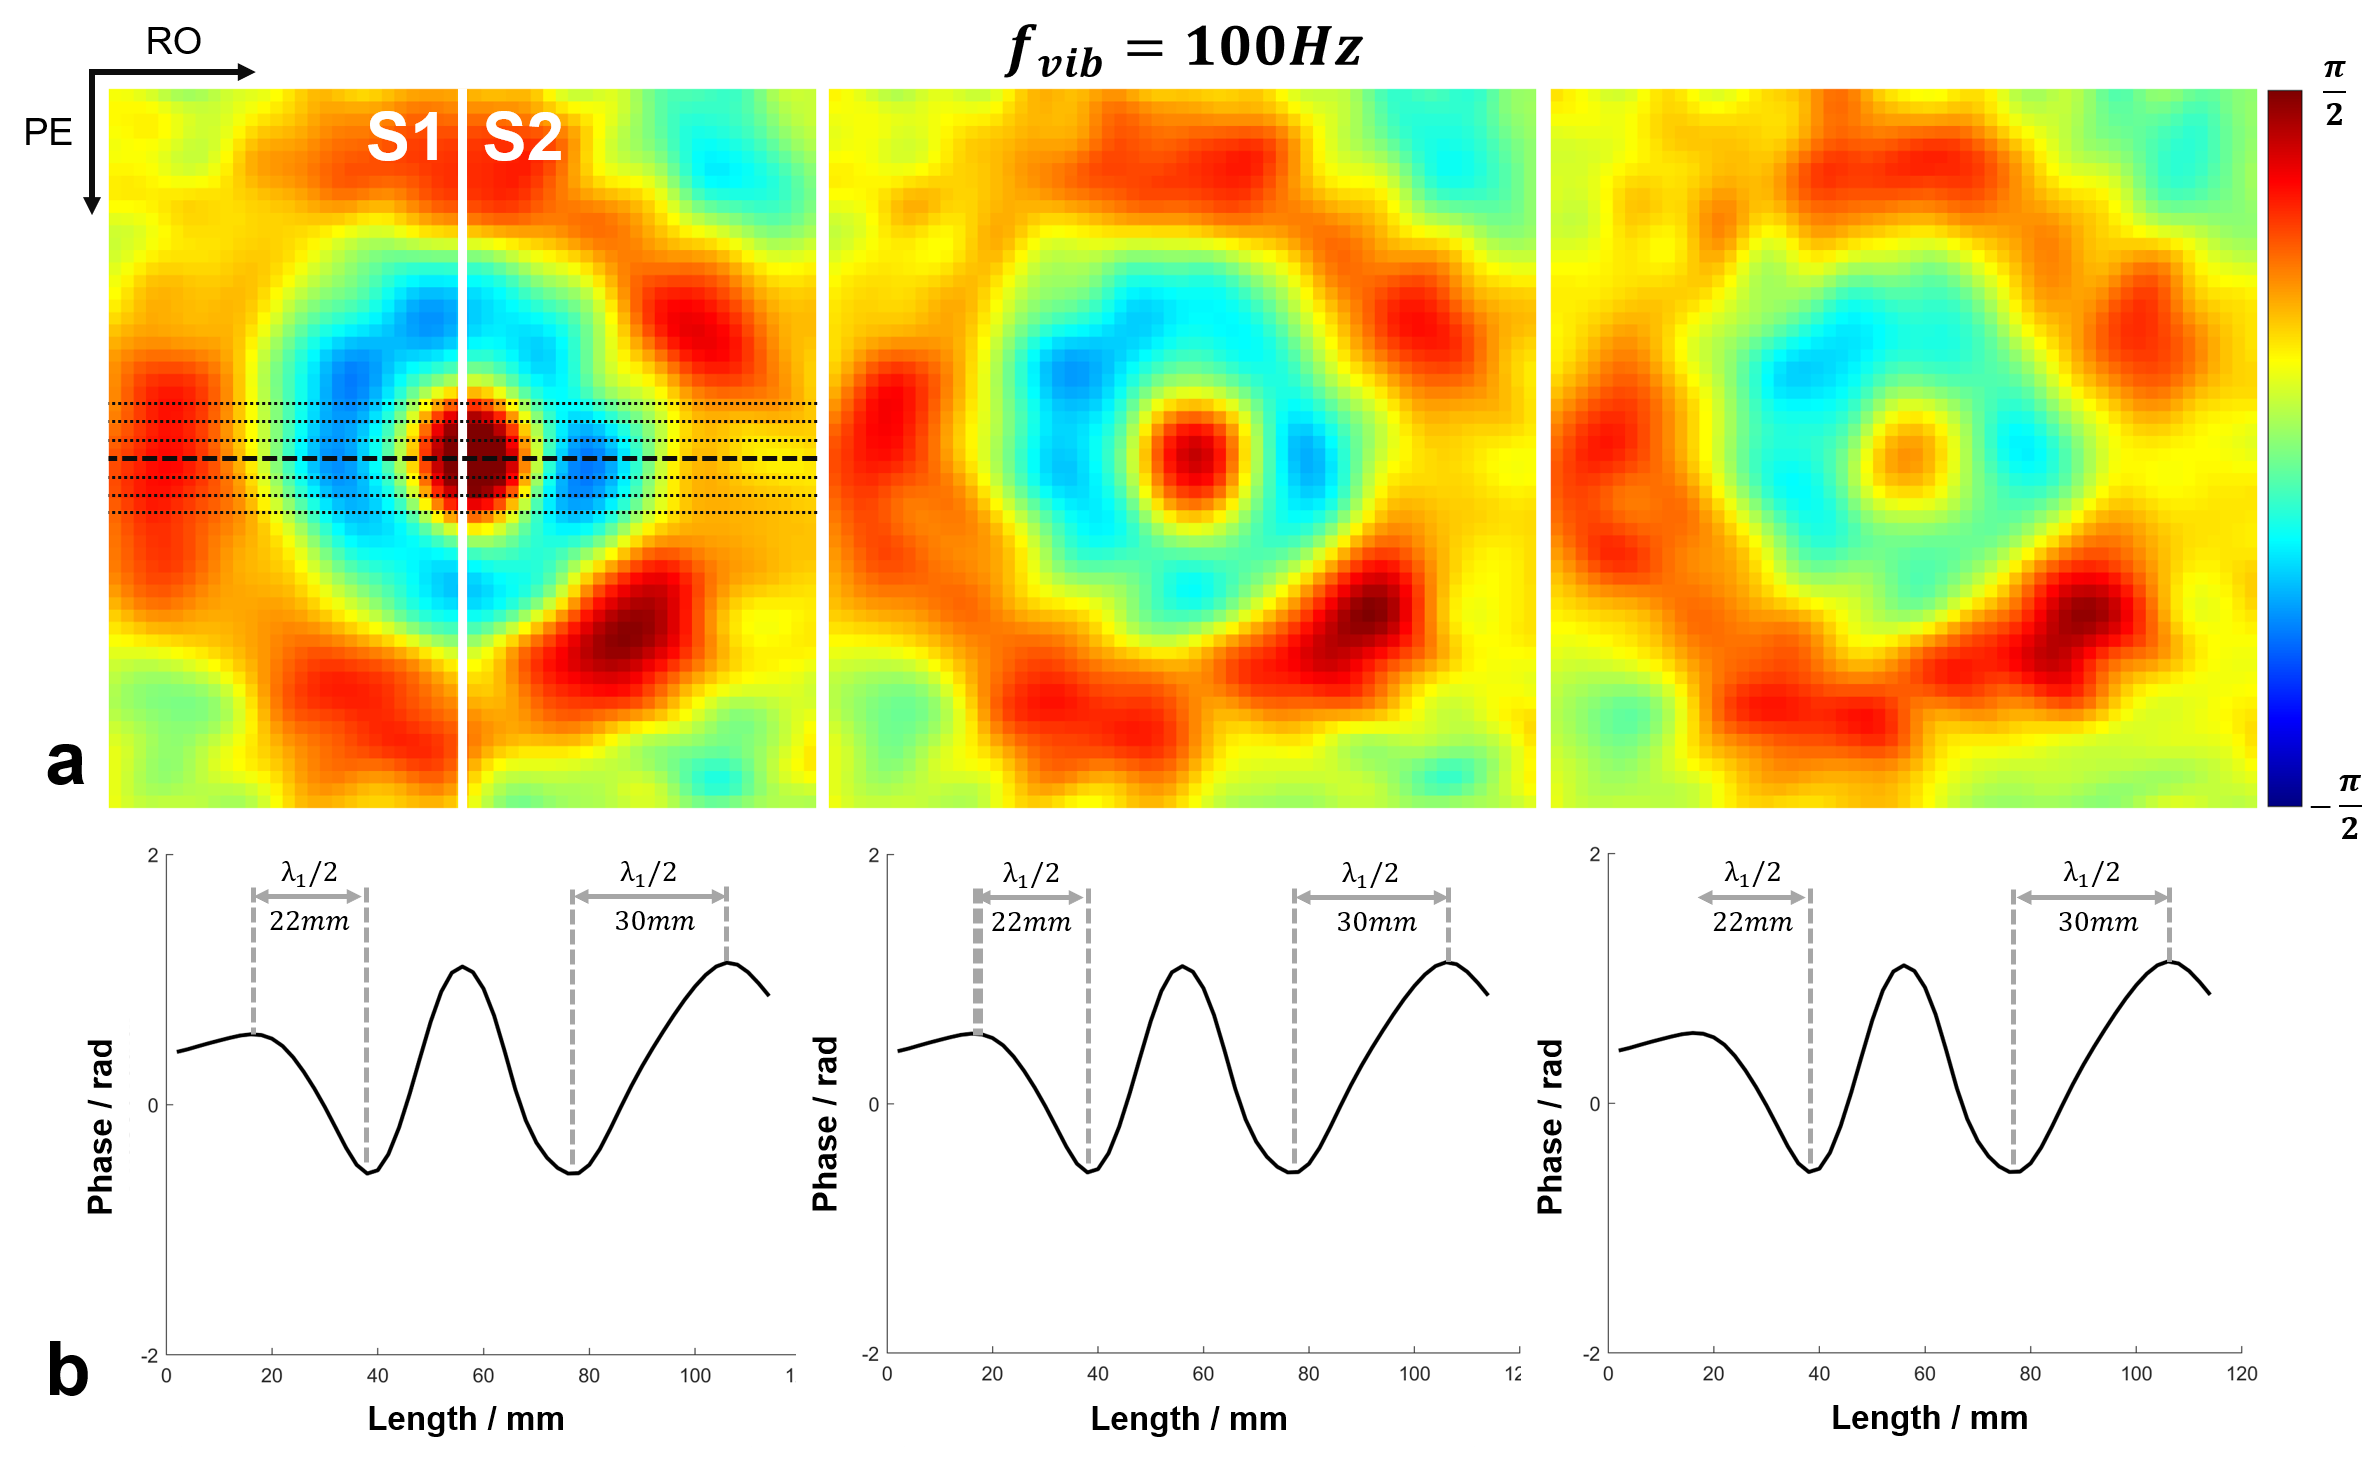
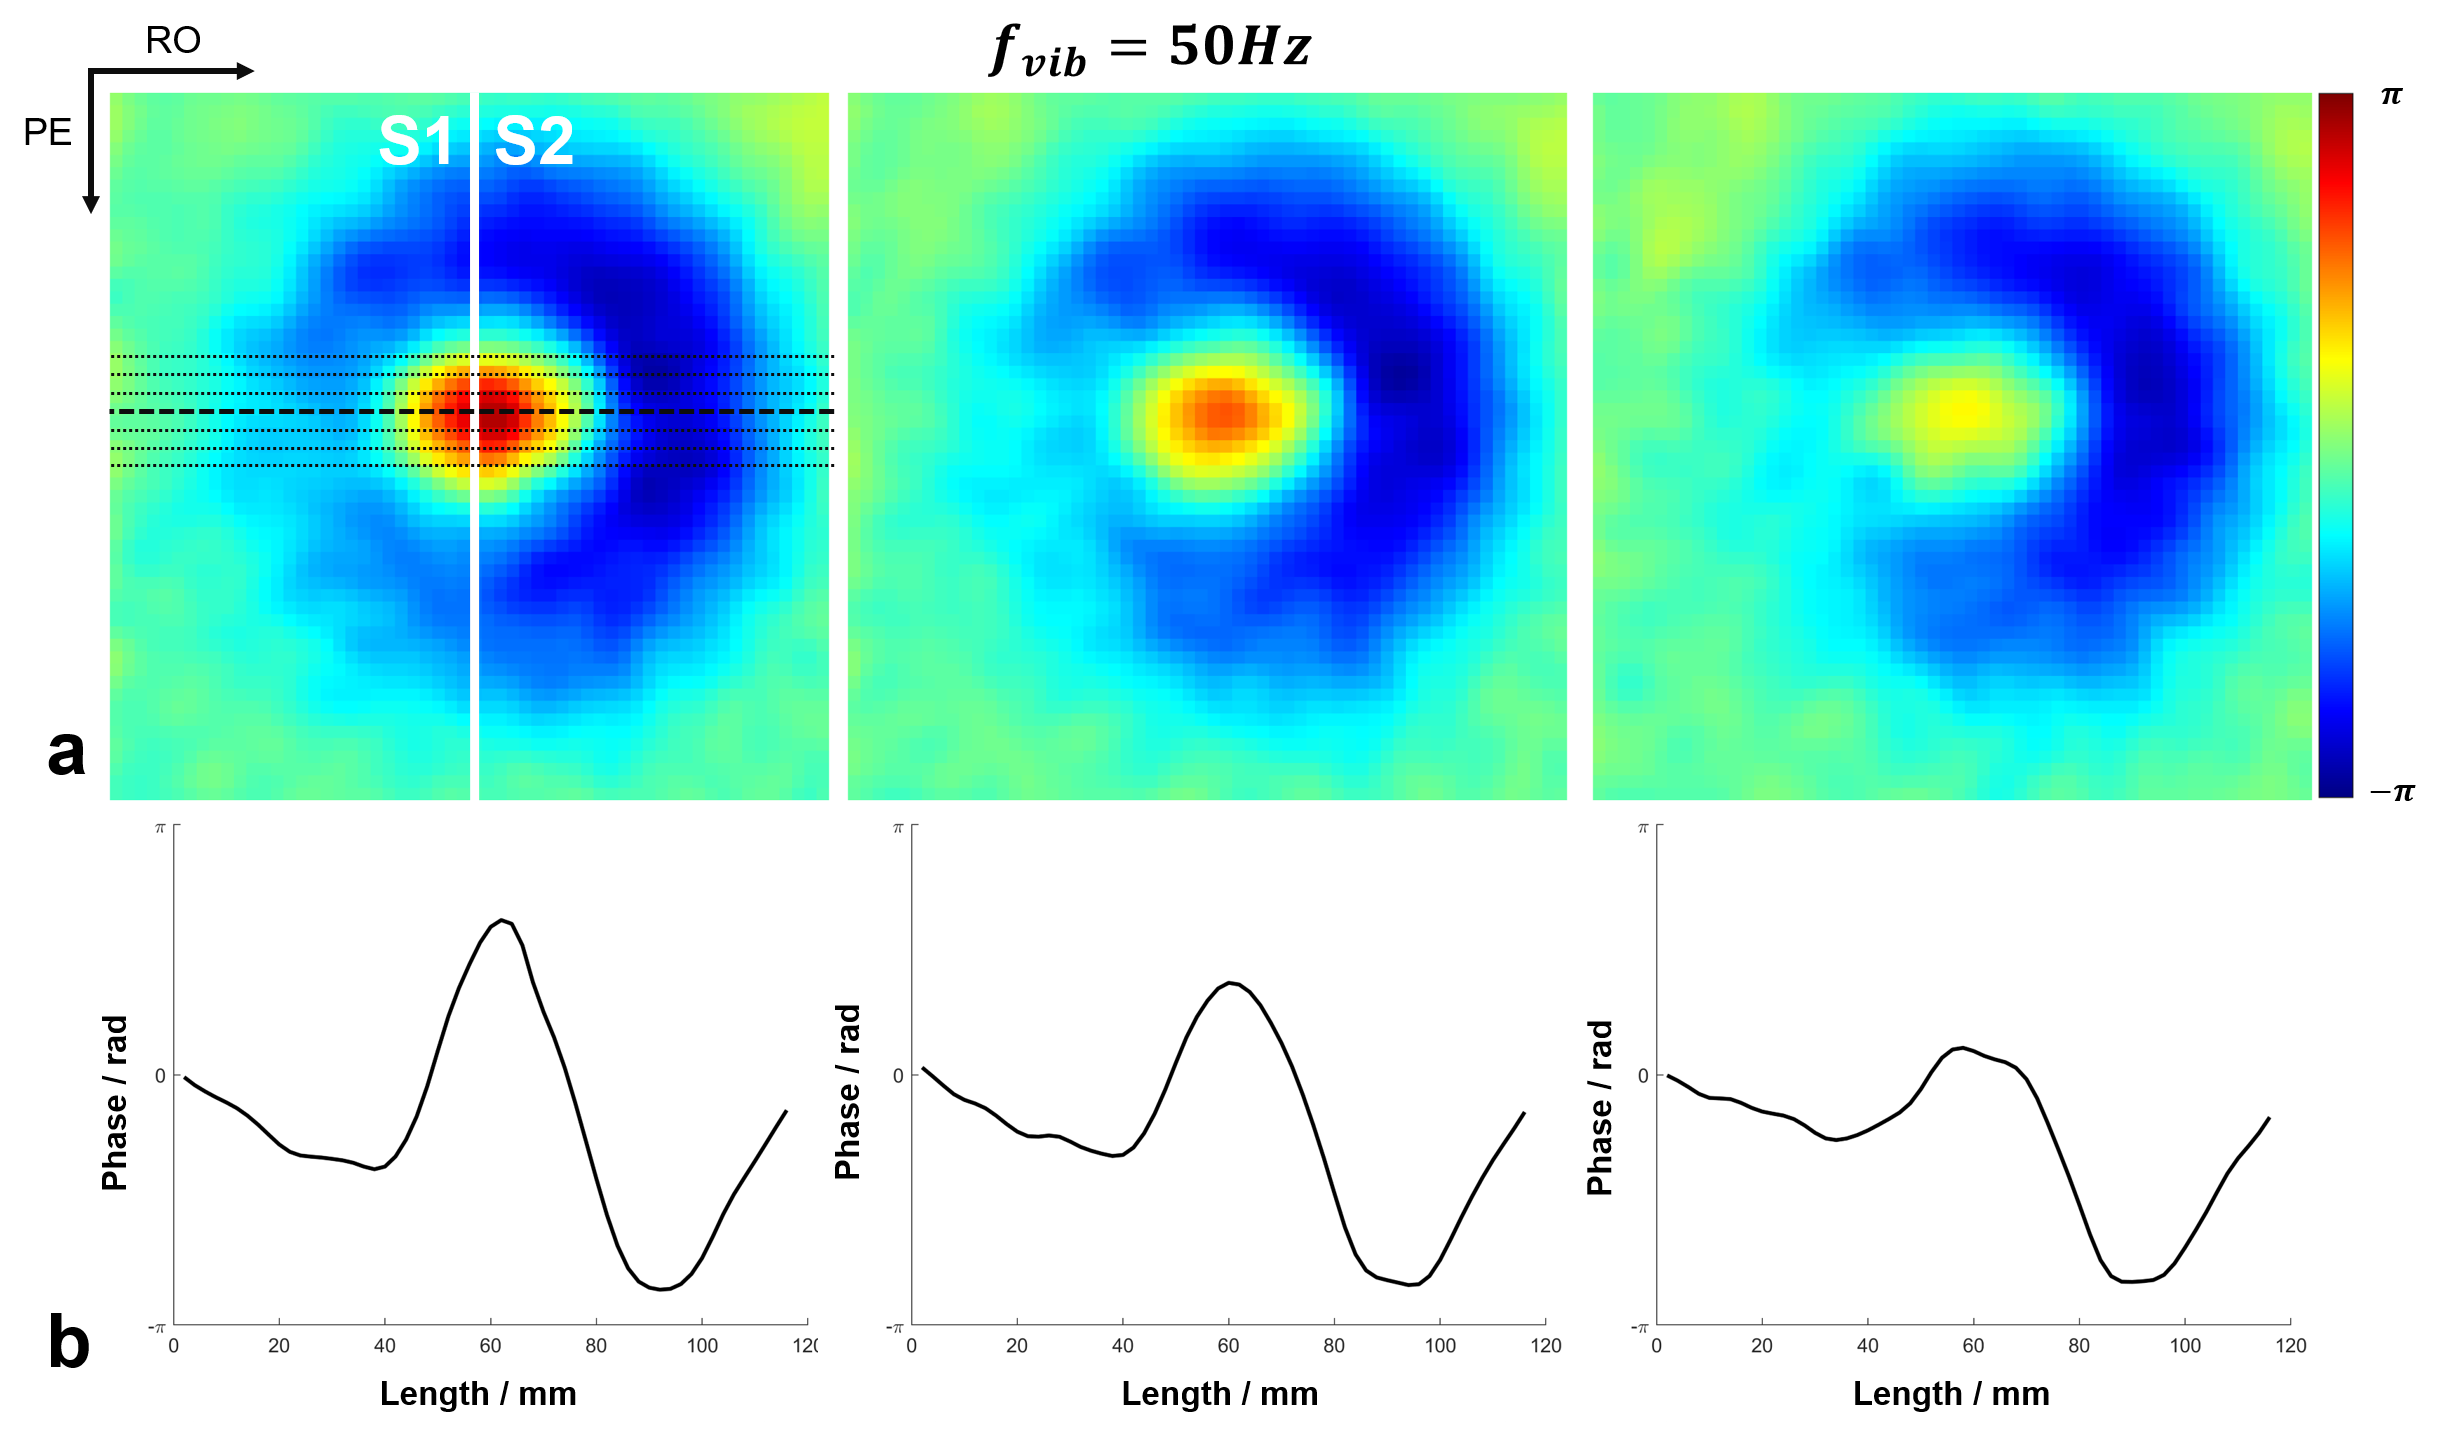
All the acquired k-space data were first processed for electromagnetic interference (EMI) signal removal by utilizing the EMI sensing coil signals [6]. The EMI removed k-space data were filtered with 3D Hamming window, and then 2× zero-padded before imaging reconstruction, resulting in a display resolution of 2×2×2mm3. Each pair of MEG+ and MEG-, as well as REF+ and REF-, was first complex-conjugate multiplication to obtain MEG and REF data. Afterwards, the motion encoded phase was obtained by subtracting REF phase from MEG phase, and then 3D phase unwrapping was conducted to the motion encoded phase. Regions-of-interest (ROIs) were generated based on the reference data, to exclude the noisy background. Three adjacent slices of 12mm, 16mm and 20mm beneath the vibration surface were extracted (Fig. 2a&3a, from left to right). Then, wave profiles were extracted from the middle seven lines along readout direction. Finally, the shear stiffness µ was calculated as: µ=ρ·λ2·fvib2 , where ρ was silicone density of 1000kg/m3, λ was the wavelength and fvib was the vibration frequency [4].
Results
The phase variations induced by wave propagation on different slices were shown in Fig. 2a. With a vibration frequency of 100 Hz, the estimated wavelengths of different silicone rubbers were 44mm and 60mm (Fig. 2b), resulting in the shear stiffness of 19.4kPa and 36kPa, respectively. Also, the estimated wave lengths held consistent across three adjacent slices. With lower vibration frequency of 50Hz, the half wavelength of shear wave was not able to be accurately measured within the field-of-view (FOV) (Fig. 3b), while the prolongated wavelengths could be visualized in the wave maps (Fig. 3a).Discussion and Conclusions
MRE is a key protocol in MR abdominal scans, especially for chronic liver disease. In this preliminary study, we demonstrate the feasibility of MRE based on phantom experiments at 0.055 Tesla. Wave propagation can be clearly visualized in the wave maps despite low SNR, while further in vivo demonstration is required, especially for the liver MRE at ULF.Acknowledgements
This work was supported in part by Hong Kong Research Grant Council (R7003-19F, HKU17112120, HKU17127121 and HKU17127022 to E.X.W., and HKU17103819, HKU17104020 and HKU17127021 to A.T.L.L.), Lam Woo Foundation, and Guangdong Key Technologies for AD Diagnostic and Treatment of Brain (2018B030336001) to E.X.W..References
[1] Muthupillai, R., D. J. Lomas, P. J. Rossman, James F. Greenleaf, Armando Manduca, and Richard Lorne Ehman. Magnetic resonance elastography by direct visualization of propagating acoustic strain waves. Science 1995;269(5232):1854-1857.
[2] Huwart L, Sempoux C, Salameh N, Jamart J, Annet L, Sinkus R, Peeters F, ter Beek LC, Horsmans Y, Van Beers BE. Liver fibrosis: noninvasive assessment with MR elastography versus aspartate aminotransferaseto-platelet ratio index. Radiology 2007; 245:458–466.
[3] Nir G, Sahebjavaher RS, Kozlowski P, Chang SD, Sinkus R, Goldenberg SL, Salcudean S. Model-based registration of ex vivo and in vivo MRI of the prostate using elastography. IEEE Trans. Med. Imaging 2013; 32:1349–1361.
[4] Yushchenko, Maksym, Mathieu Sarracanie, and Najat Salameh. Fast acquisition of propagating waves in humans with low-field MRI: Toward accessible MR elastography. Science Advances 2022; 8(36):eabo5739.
[5] Liu Y, Leong ATL, Zhao Y, Xiao L, Mak HKF, Tsang ACO, Lau GKK, Leung GKK, Wu EX. A low-cost and shielding-free ultra-low-field brain MRI scanner. Nat Commun 2021;12(1):7238.
[6] Yuen MM, Prabhat AM, Mazurek MH, Chavva IR, Crawford A, Cahn BA, Beekman R, Kim JA, Gobeske KT, Petersen NH, Falcone GJ, Gilmore EJ, Hwang DY, Jasne AS, Amin H, Sharma R, Matouk C, Ward A, Schindler J, Sansing L, de Havenon A, Aydin A, Wira C, Sze G, Rosen MS, Kimberly WT, Sheth KN. Portable, low-field magnetic resonance imaging enables highly accessible and dynamic bedside evaluation of ischemic stroke. Sci Adv 2022;8(16):eabm3952.
[7] He Y, He W, Tan L, Chen F, Meng F, Feng H, Xu Z. Use of 2.1 MHz MRI scanner for brain imaging and its preliminary results in stroke. J Magn Reson 2020;319:106829.
[8] O'Reilly T, Teeuwisse WM, de Gans D, Koolstra K, Webb AG. In vivo 3D brain and extremity MRI at 50 mT using a permanent magnet Halbach array. Magn Reson Med 2021;85(1):495-505.
[9] Mazurek MH, Cahn BA, Yuen MM, Prabhat AM, Chavva IR, Shah JT, Crawford AL, Welch EB, Rothberg J, Sacolick L, Poole M, Wira C, Matouk CC, Ward A, Timario N, Leasure A, Beekman R, Peng TJ, Witsch J, Antonios JP, Falcone GJ, Gobeske KT, Petersen N, Schindler J, Sansing L, Gilmore EJ, Hwang DY, Kim JA, Malhotra A, Sze G, Rosen MS, Kimberly WT, Sheth KN. Portable, bedside, low-field magnetic resonance imaging for evaluation of intracerebral hemorrhage. Nat Commun 2021;12(1):5119.
[10] Sheth KN, Mazurek MH, Yuen MM, Cahn BA, Shah JT, Ward A, Kim JA, Gilmore EJ, Falcone GJ, Petersen N, Gobeske KT, Kaddouh F, Hwang DY, Schindler J, Sansing L, Matouk C, Rothberg J, Sze G, Siner J, Rosen MS, Spudich S, Kimberly WT. Assessment of Brain Injury Using Portable, Low-Field Magnetic Resonance Imaging at the Bedside of Critically Ill Patients. JAMA Neurol 2020;78(1):41-47.
[11] Cooley CZ, McDaniel PC, Stockmann JP, Srinivas SA, Cauley SF, Śliwiak M, Sappo CR, Vaughn CF, Guerin B, Rosen MS, Lev MH, Wald LL. A portable scanner for magnetic resonance imaging of the brain. Nat Biomed Eng 2021;5(3):229-239.
Figures