1588
On the estimation of age-related volumetric brain changes using ultra-low-field MR images
Peter Hsu1, Daniel K. Sodickson1,2, Hersh Chandarana1, Justin Fogarty1, Patricia Johnson1,2, and Jelle Veraart1,2
1Center for Biomedical Imaging, Department of Radiology, New York University Grossman School of Medicine, New York, NY, United States, 2Center for Advanced Imaging Innovation and Research (CAI2R), Department of Radiology, New York University Grossman School of Medicine, New York, NY, United States
1Center for Biomedical Imaging, Department of Radiology, New York University Grossman School of Medicine, New York, NY, United States, 2Center for Advanced Imaging Innovation and Research (CAI2R), Department of Radiology, New York University Grossman School of Medicine, New York, NY, United States
Synopsis
Keywords: Low-Field MRI, Brain, ultra-low-field MRI, point-of-care MRI
The high cost of clinical MRI has severely limited its accessibility in many regions. Ultra-low-field (ULF) MRI systems have been developed to address this issue, providing diagnostic imaging at a significantly lower cost. However, computational tools that are used for clinical scans are often not applicable to ULF images which suffer from both SNR and resolution loss. Here, we compare two approaches for improving the resolution of ULF images and two techniques for extracting volumetric information from each approach. We show that given effective post-processing, ULF images can capture expected age-related volumetric changes in the brain.Introduction
The expense of and various contraindications for MRI has limited its accessibility, especially in rural areas or low- and middle-income countries. Recently developed ultra-low-field (ULF) MRI systems of <100mT [4][11] promise to provide diagnostic imaging with fewer constraints. Unfortunately, ULF scans have significantly lower SNR and spatial resolution per unit time than traditional clinical scans, and their contrast profiles also differ from those of traditional images, reducing the effectiveness of established computational tools such as brain segmentation.Automated brain segmentation and volumetric MRI analysis have shown diagnostic value for various diseases [3], including Alzheimer’s Disease [9]. In this study, we assess the feasibility of automated atrophy rate quantification of brain structures through adulthood, using ULF MRI images only. We evaluated two strategies to improve spatial resolution prior to brain segmentation: (1) AI-based prediction of a synthetic MP-RAGE image using SynthSR [10] and (2) reconstruction of a high-resolution isotropic image from a series of low-resolution anisotropic images acquired in orthogonal orientations [6].
Methods
Data:Ultra-low-field scans from 27 subjects (11 female) were acquired with a Hyperfine Swoop scanner (64mT). Subjects were cognitively normal with ages between 23 and 72 years. Images were acquired using 3D FSE with T1-weighted (T1w) and T2-weighted (T2w) contrast in axial, coronal, and sagittal directions. T1 acquisition parameters: TE=6ms, TR=1500ms, and TI=300ms with an echo train length of 24 and scan time of 5:36min. T2 acquisition parameters: TE=209ms and TR=2000ms with an echo train length of 80 and scan time of 5:46min. The in-plane spatial resolution was 1.6x1.6mm2 and 1.5x1.5mm2 for the T1w and T2w images, respectively, while the slice thickness was 5mm. Only a subset of the study subjects received clinical scans at 3T (N=16). For the remaining subjects, age- and sex- matched 3T scans from cognitively normal subjects were collected from public repositories [14][12].
Resolution Enhancements (Figure 1):
- Synthetic MP-RAGE: Axially acquired T1w and T2w ULF MR images were provided as input to SynthSR [10] which generated a synthetic MP-RAGE image with 1x1x1mm3 volume. SynthSR uses a pre-trained multichannel 3D U-Net to synthesize an MP-RAGE image based on the ULF MRI input through contrast synthesis and super-resolution.
- Tomobrain: A composite high-resolution image was reconstructed by aligning and regridding the orthogonally acquired images into a common high resolution image space (1.5x1.5x1.5mm3) [6], here coined Tomobrain.
Brain Segmentation (Figure 1):
- FreeSurfer: Synthetic MP-RAGE images were segmented using FreeSurfer [8]. The resulting volumes of gray matter (GM), white matter (WM), hippocampus (HC), and lateral ventricles (LV) were normalized by the intracranial volume. Tomobrain images are incompatible with FreeSurfer segmentation due to their contrast and low resolution.
- Atlas-based segmentation: Tomobrain (T1w and T2w) and synthetic MP-RAGE images underwent atlas-based segmentation to extract similar volumetric information. The MNI brain template was registered independently to the study data using affine and symmetric normalization (Syn) registration with ANTs [1]. The resulting transformations were then applied to the brain segmentation labels [7].
Statistics: Annualized atrophy rates of normalized cortical GM, WM, HC, and LV were estimated using linear regression.
Results
In Figure 2, we show the age-related trends for the different brain regions that were computed from the synthetic MP-RAGE images using FreeSurfer. The age-related trends that were computed using atlas-based segmentation are shown in Figure 3. Statistical significance of the trends was evaluated using linear regression. In Figure 4, we show the 95% confidence intervals for estimated annualized atrophy rate, derived from the slope of the linear fit for both methods, as well as from clinical 3T data.Discussion and Conclusion
Our results demonstrate that ULF MRI is sensitive to the subtle age-related volumetric changes in the healthy brain. However, such volumetric analyses are challenged by the low spatial resolution and field-dependent GM/WM contrast changes. We observe that AI-based prediction of a synthetic clinical MP-RAGE image from low-resolution T1w and T2w ULF MR contrasts provides a promising avenue for volumetric analyses, mainly because it is compatible with the widely used FreeSurfer tool. We observe consistency in capturing volumetric changes compared with the matched clinical images (Figure 4).The Tomobrain technique increases the spatial resolution of ULF MRI in a data-driven manner. Unfortunately, these images are currently less suited for volumetric analysis as such analysis is bound to atlas-based brain segmentation. In a direct comparison, we conclude that the registration-driven approach is outperformed by FreeSurfer. The atlas-based brain segmentation has been shown to be sensitive to volumetric changes (GM/WM/CSF) in early development using ULF MRI [5], but such volumetric changes are more prominent in that application.
Although ULF and clinical MRI show the atrophy trends that have been demonstrated in large cohort studies, we hypothesize that our lack of sensitivity in, for example the HC, can be attributed to our relatively low sample size (see [2]). Moving forward, additional data will be acquired to improve the statistical power of our analysis and the reproducibility and precision of both segmentation techniques. We further hypothesize that the performance of an AI-based synthesis model can be improved by using Tomobrain images as input, thereby combining the strengths of both methods.
Acknowledgements
Grant support: NIH P41EB017183References
[1] Avants, B. et al. (2009). Insight j, 2(365), pp.1-35.[2] Barnes, J. et al. (2009). Neurobiology of Aging, 30(11), 1711–1723.
[3] Bermel, R. & Bakshi, R. (2006). The Lancet Neurology, 5(2), 158–170.
[4] Chetcuti, K. et al. (2022). American Journal of Neuroradiology, 43(5), 670–674.
[5] Deoni, S. et al. (2021). NeuroImage, 238, 118273.
[6] Deoni, S. et al. (2022). Magnetic Resonance in Medicine, 88(3), 1273–1281.
[7] Desikan, R. et al. (2006). NeuroImage, 31(3), 968–980.
[8] Fischl, B. (2012). NeuroImage, 62(2), 774–781.
[9] Fox, N. & Schott, J. (2004). The Lancet, 363(9406), 392–394.
[10] Iglesias, J. et al. (2021). NeuroImage, 237, 118206.
[11] Mazurek, M. et al. (2021). Nature Communications, 12(1), Article 1.
[12] Mueller, S. et al. (2005). Neuroimaging Clinics of North America, 15(4), 869–xii.
[14] Nugent, A. et al. (2022). OpenNeuro. [Dataset]
Figures

Figure 1: Ultra-low-field images are acquired in axial, coronal, and
sagittal directions with T1 and T2 weighting. Axial T1 and T2 images are input
to the SynthSR deep learning algorithm which synthesizes a 1mm isotropic MP-RAGE
image (light green and dark green). Axial, coronal, and sagittal images are
merged to form 1.5mm isotropic Tomobrain T1 (blue) and T2 (red) images. ROI
labels are computed with FreeSurfer or affine and nonlinear registration to
each subject brain.
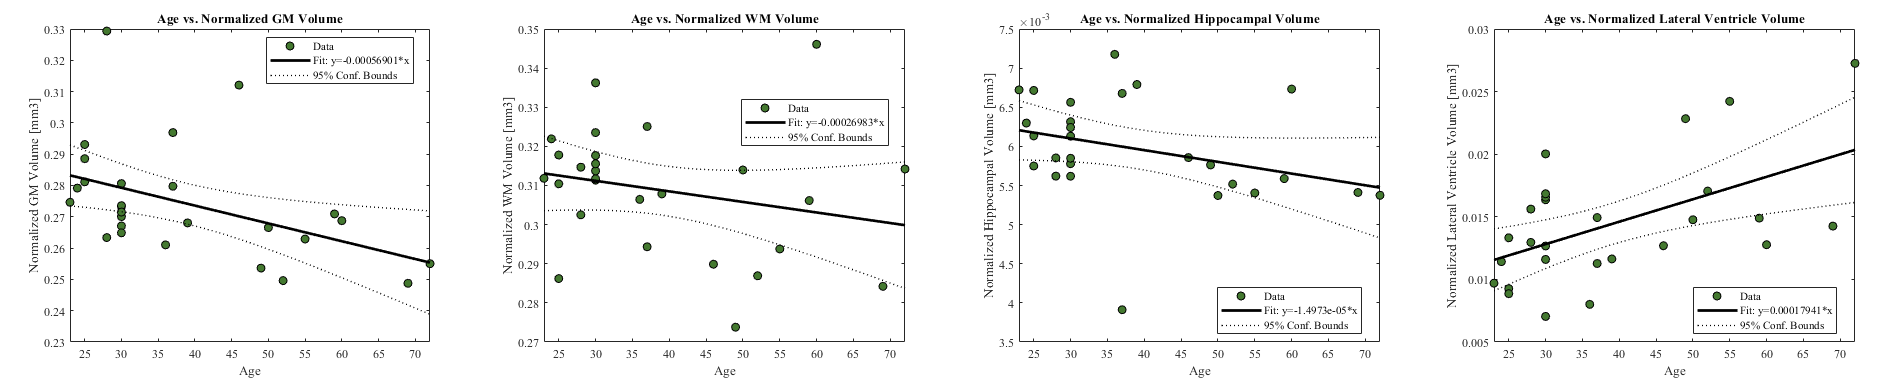
Figure 2: Segmentation using FreeSurfer: scatter plot of age and normalized brain region volume for SynthSR synthetic MP-RAGE images including a trendline and 95% confidence intervals. Volumetric estimates are made using ROI labels computed with FreeSurfer. Measurements for gray matter (p<0.05) and lateral ventricle volume (p<0.01) reach statistical significance.
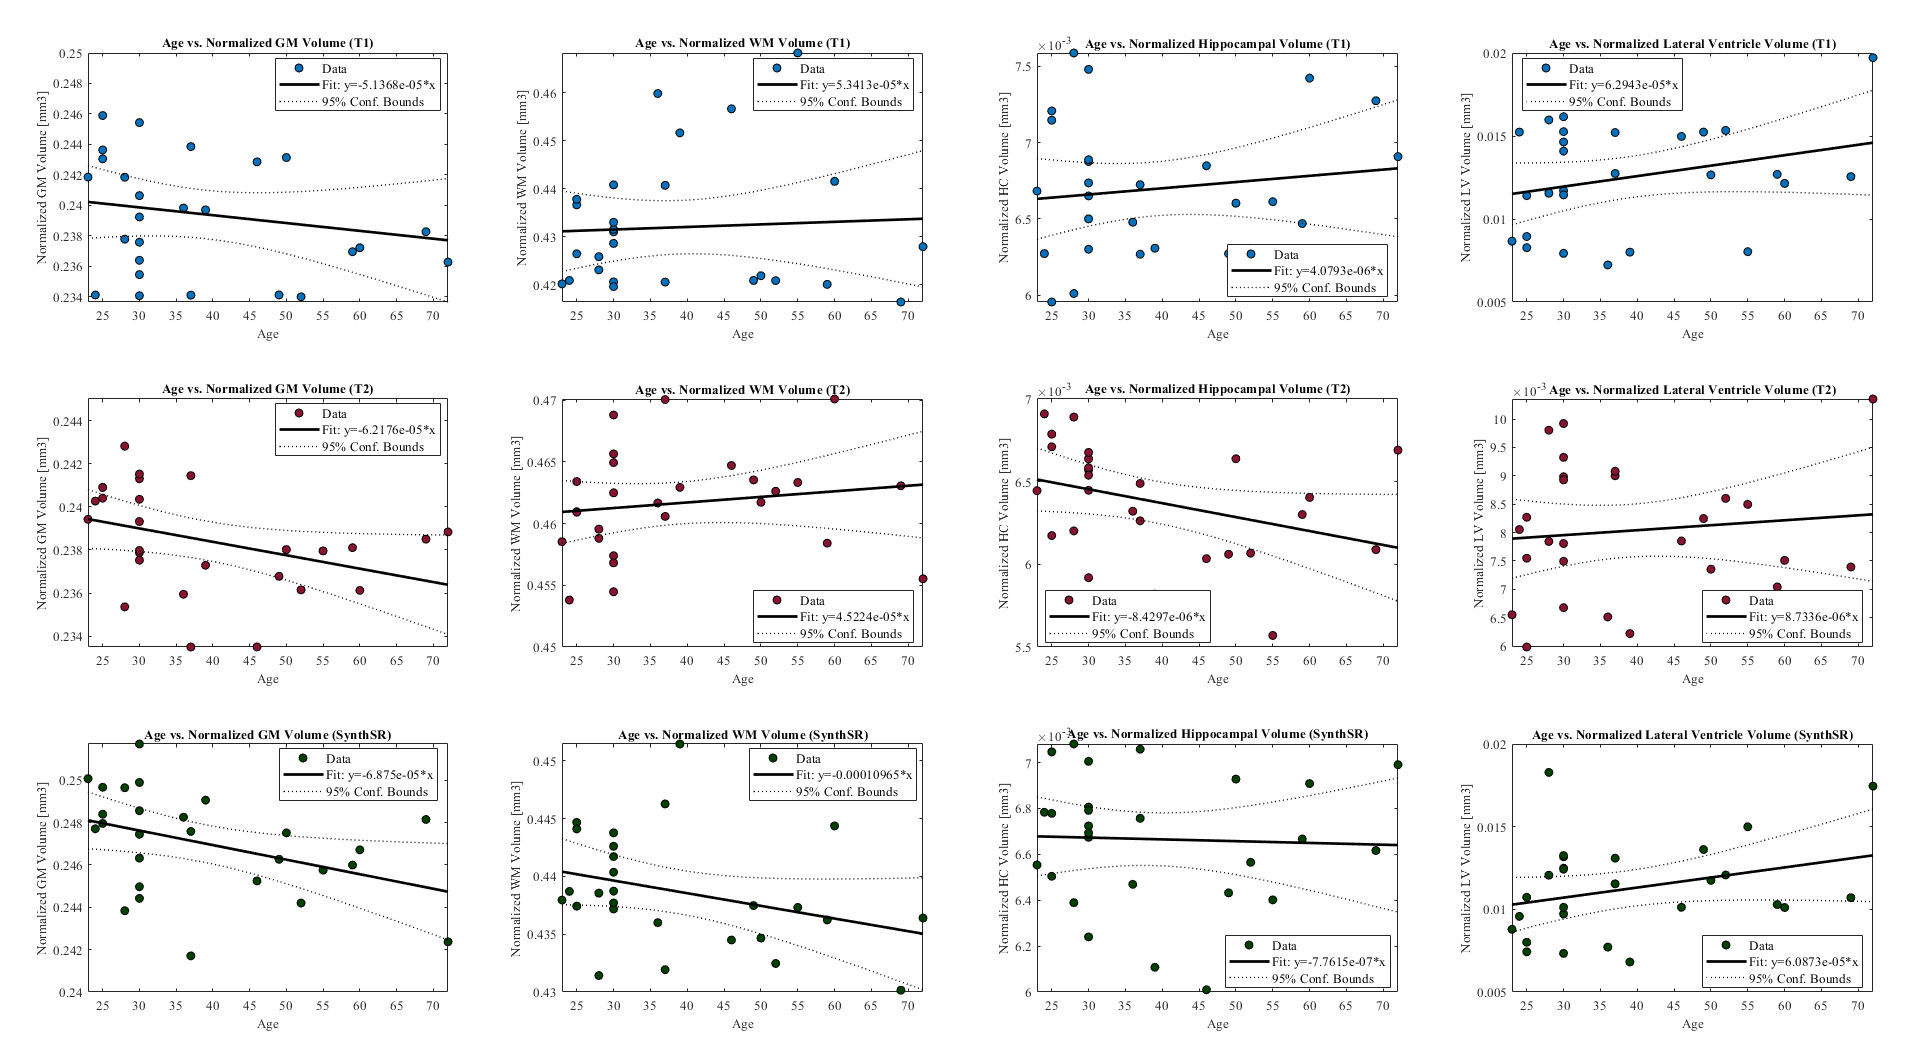
Figure 3: Atlas-based registration: scatter plot of age and normalized brain region volume for T1 Tomobrain (blue), T2 Tomobrain (red), and SynthSR (dark green) with trendline and 95% confidence intervals. Volumetric estimates are made using ROI labels computed through affine and nonlinear registration techniques. The measurement of gray matter for SynthSR reached statistical significance (p<0.05).
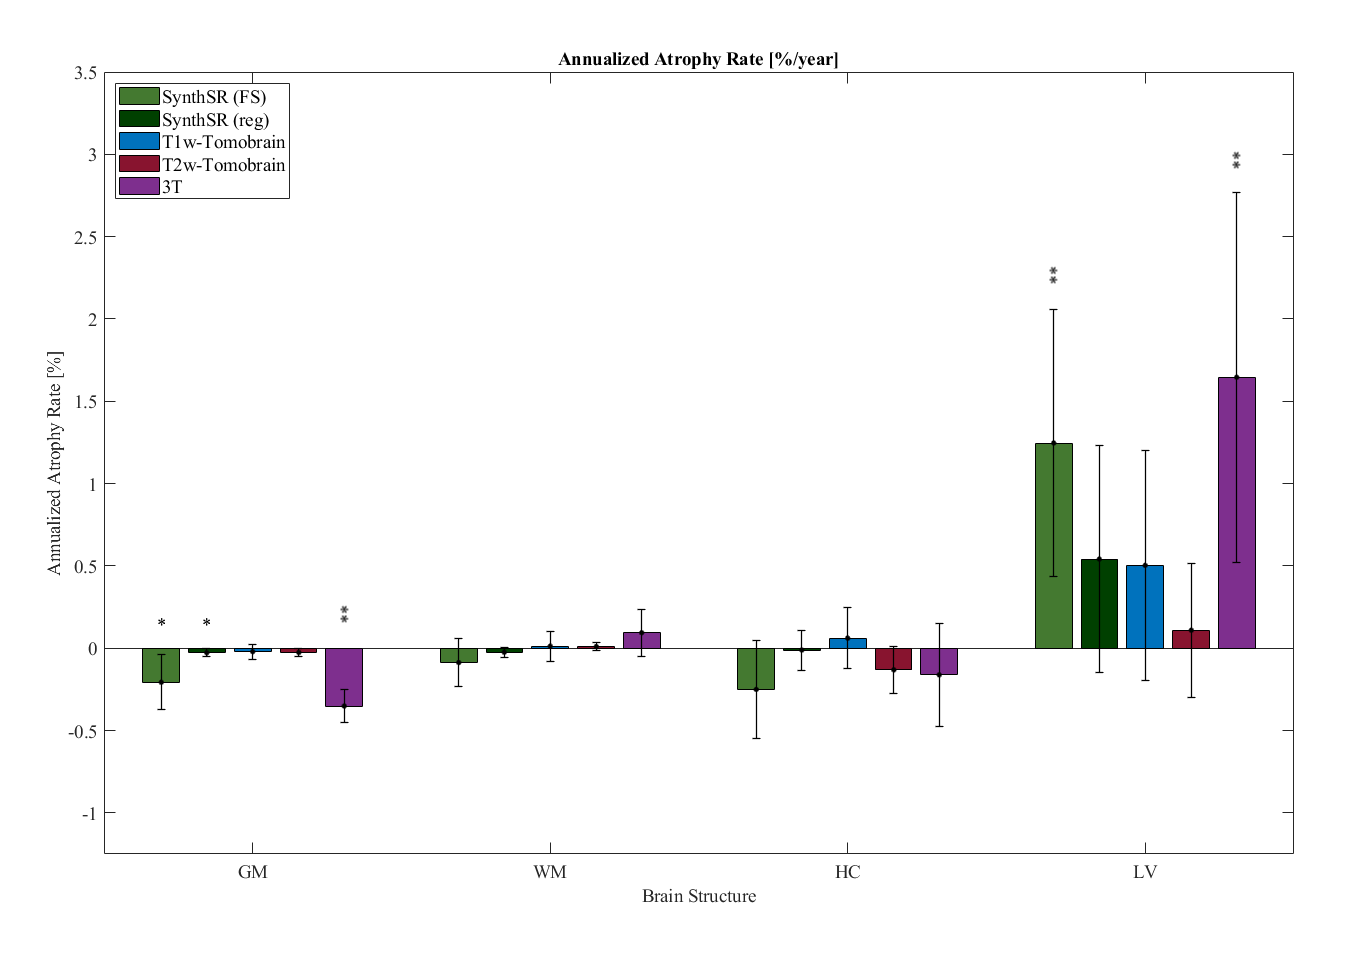
Figure 4: Histogram with 95% confidence intervals of annualized atrophy rate [%/year] for gray matter (GM), white matter (WM), hippocampus (HC), and lateral ventricles (LV) based on predictions from a linear model. Significant findings are denoted with ‘*’ for p<0.05 and ‘**’ for p<0.01.
DOI: https://doi.org/10.58530/2023/1588