1586
Magnetization Transfer Imaging using non-balanced SSFP at Ultra-Low Field1Physics and Astronomy, University of British Columbia, Vancouver, BC, Canada, 2Hyperfine Inc, Guilford, CT, United States, 3Radiology, University of British Columbia, Vancouver, BC, Canada, 4Neuroimaging, King's College London, London, United Kingdom, 5MNCH D&T, Bill and Melinda Gates Foundation, Seattle, WA, United States, 6Medicine, University of British Columbia, Vancouver, BC, Canada, 7Medical Radiation Physics, Lund University, Lund, Sweden
Synopsis
Keywords: Low-Field MRI, Magnetization transfer
We have demonstrated a method for introducing Magnetization Transfer (MT) weighting in a non-balanced SSFP sequence (PSIF) at 64mT by changing the total power of the on-resonance RF excitation pulse. The presence of the MT effect was validated through simulations, experiments in phantoms of water, cream, and hair conditioner, as well as in-vivo. Changes to the signal amplitude in the conditioner from the flip angle and pulse width of the RF pulse illustrated the presence of MT saturation. An example protocol with MT weighting was applied in-vivo to generate magnetisation transfer ratio maps.Introduction
Ultra-low field portable MRI has the potential to increase the accessibility of MRI, reducing costs and siting constraints. One potential application of ultra-low field MRI is longitudinal assessment of myelination as a biomarker for brain development, or disease progression.Magnetisation transfer (MT) imaging has been shown to be a useful, semi-quantitative biomarker for myelination in a wide range of applications1-4. The most common approach involves using a frequency selective off-resonance saturation pulse followed by a rapid readout5. This approach has limitations at ultra low field due to B0 inhomogeneity. On-resonance saturation of the bound pool through the RF excitation pulse6 in a steady state sequence, such as steady state free precession (SSFP)7, overcomes these constraints. This approach is challenging at high field due to SAR limitations, making it particularly promising for use at low field. In this study we develop and validate MT imaging on a portable, ultra-low field (64mT) MRI system, using non-balanced SSFP (PSIF) with on-resonance saturation6,8 through simulations and experiments in phantoms and in-vivo.
Methods
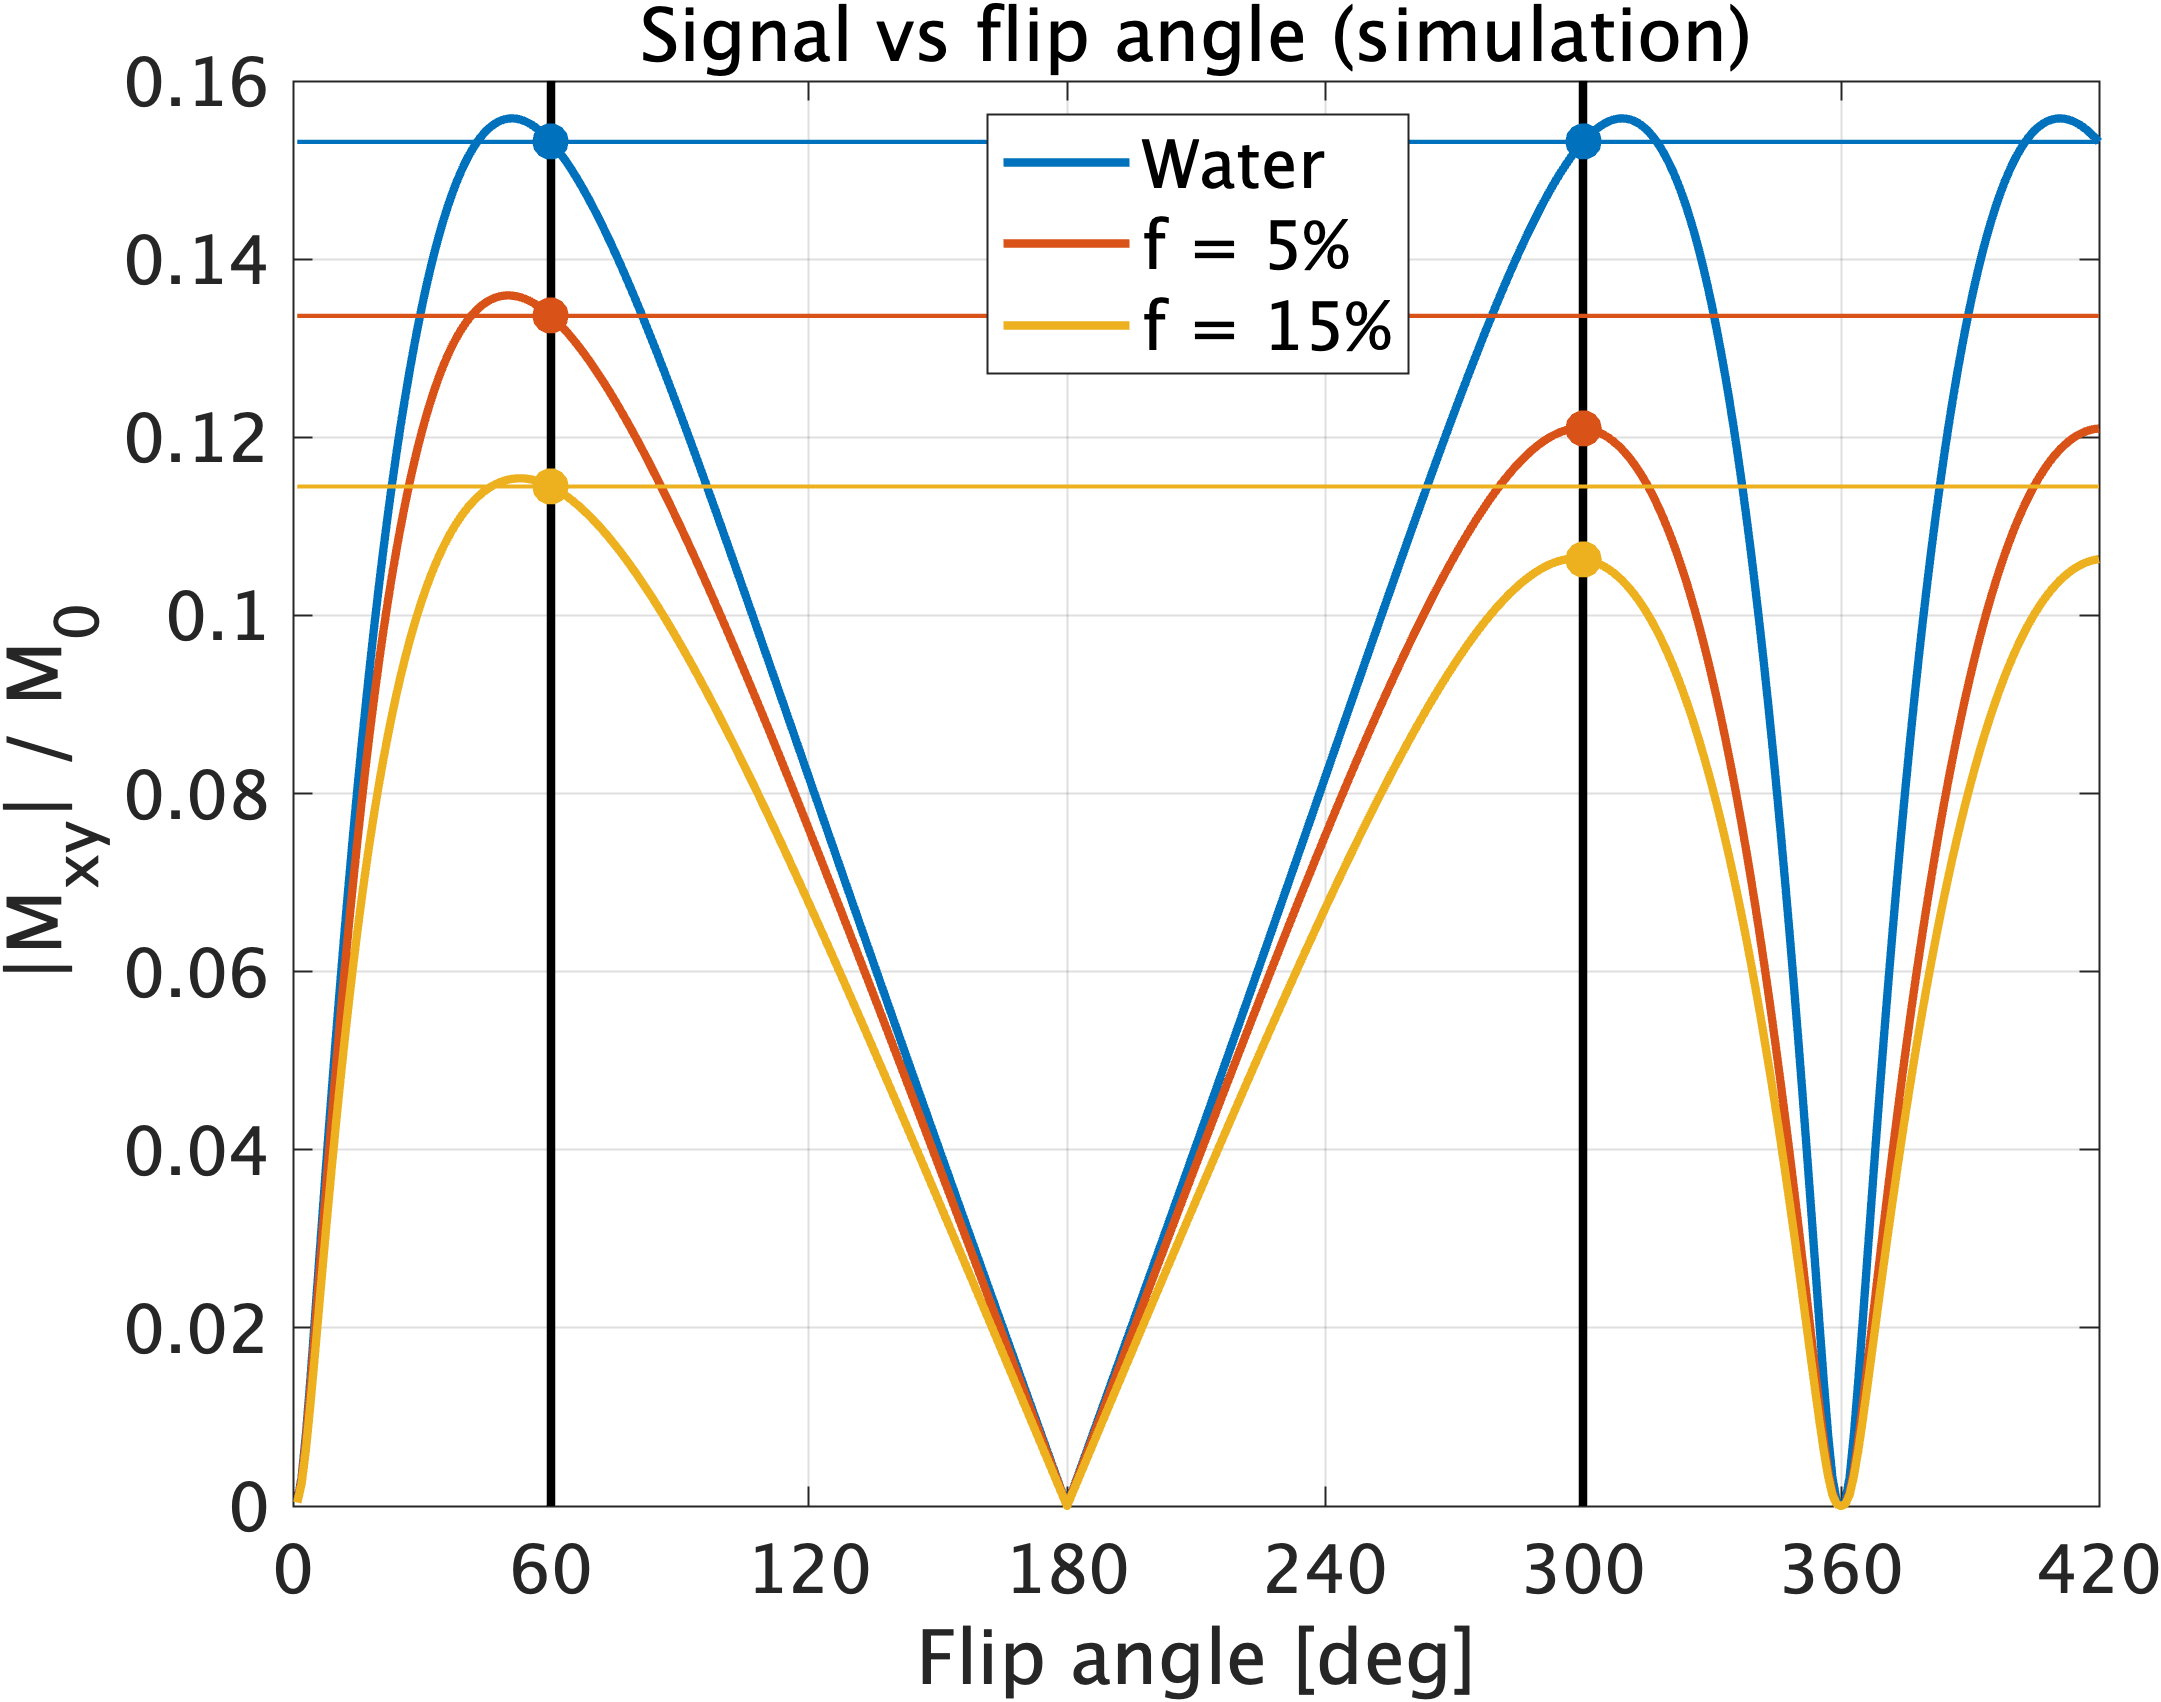
To calculate the MT Ratio (MTR) from a pair of images, the differential contrast should ideally be solely due to MT saturation. To this end, we used a PSIF sequence, for which the signal equation is symmetric about 𝛼=180° in single pool systems, so identical image contrast should be achieved with 𝛼=X° and 𝛼=360°-X°. For MT systems, an asymmetry is introduced due to the higher energy of larger 𝛼 resulting in larger bound-pool saturation. An EPG-X simulation9 was performed to demonstrate the principle of this approach (Figure 1).To validate the PSIF MT approach, a set of phantom and in-vivo experiments were conducted on a 64mT Hyperfine Swoop system (hardware version 1.7, software rc8.5.0). Six vials were filled with either water, cream (18 or 48% fat), or hair conditioner (TRESemme® (Unilever PLC, London)) and placed in a transmit/receive RF coil.
Resulting PSIF images were denoised using a Gaussian noise model10, and MTR was calculated as MTR=(MToff-MTon)/MToff5.
Experiment 1 - MT saturation with varying pulse width
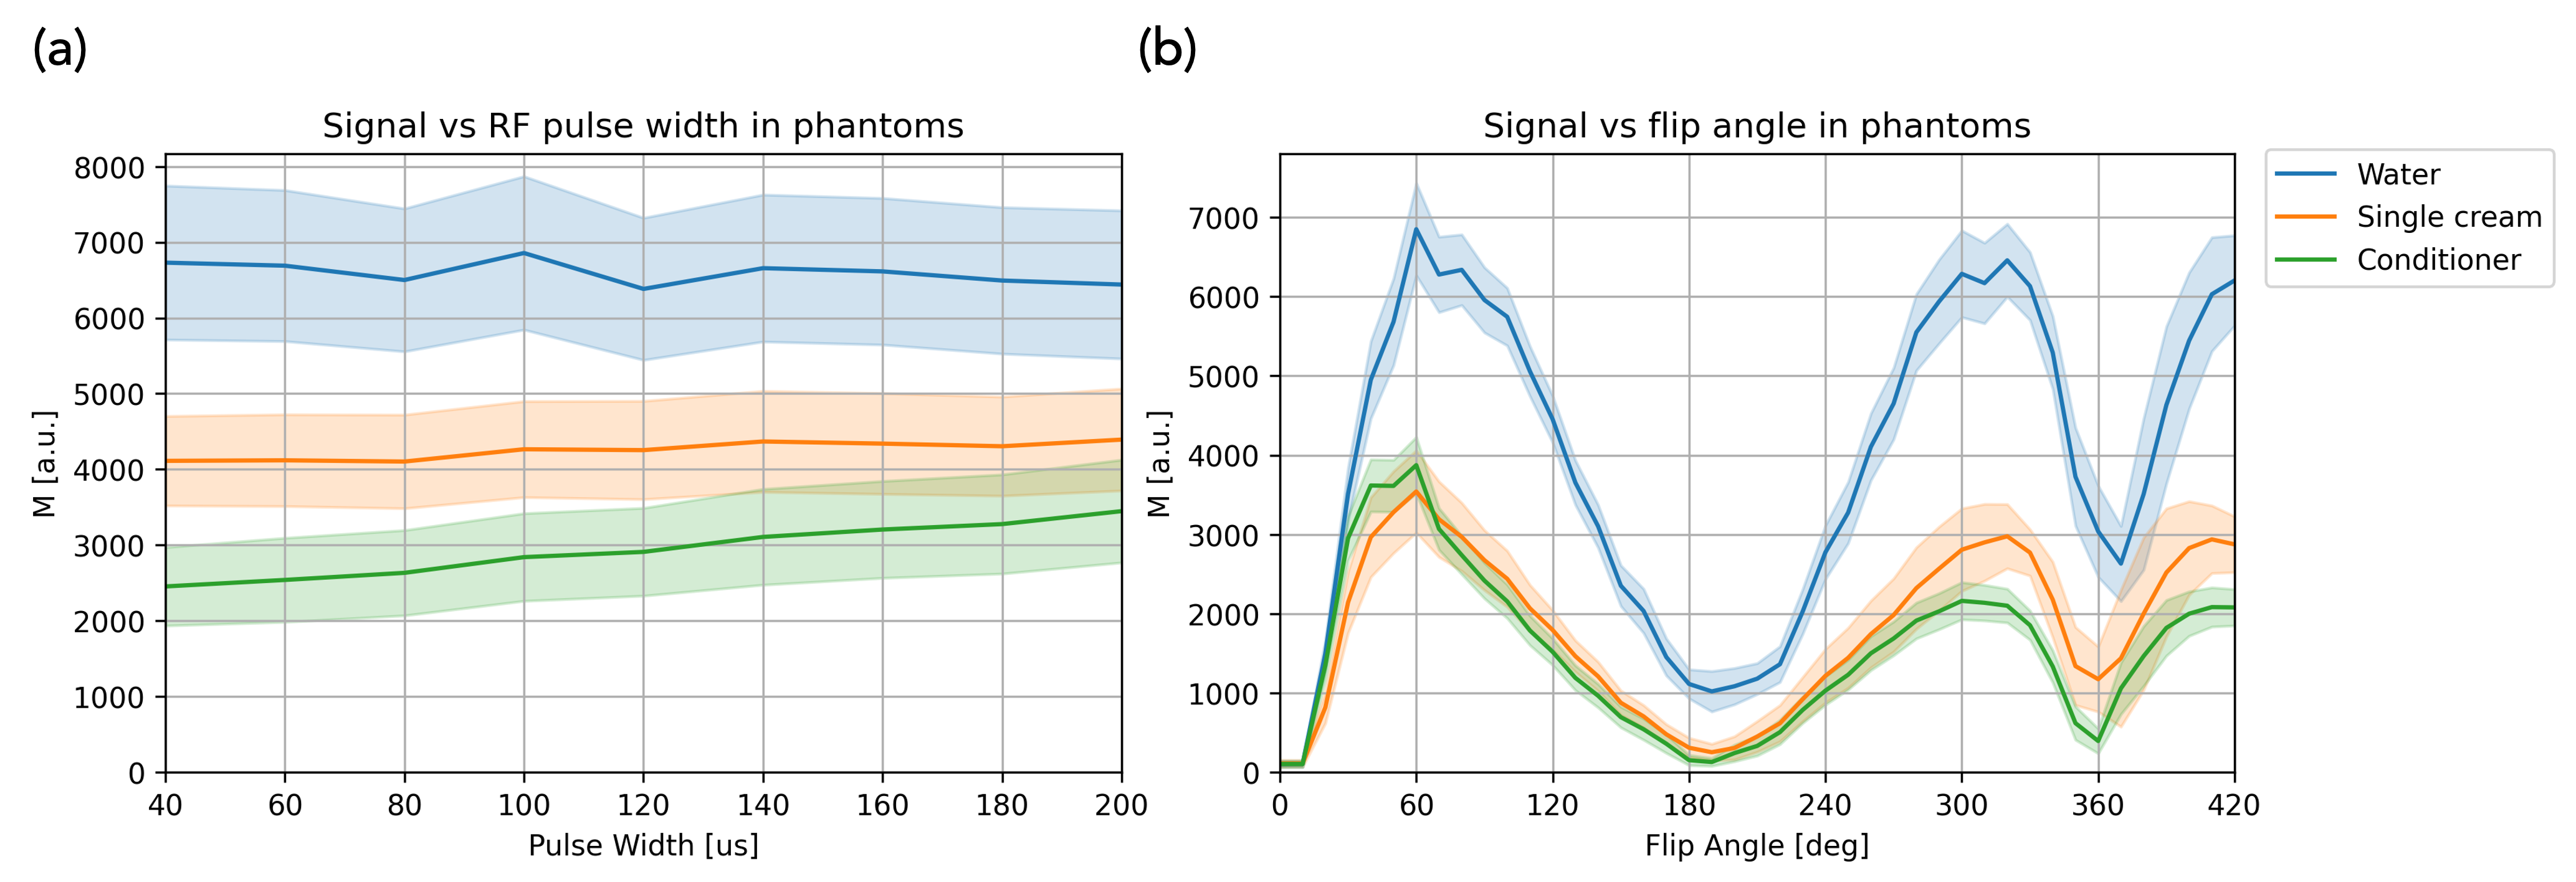
To investigate MT saturation for a given flip angle 𝛼, the phantom was imaged with varying RF pulse widths 𝜏RF from 40μs (B1rms=6.49μT) to 200μs (B1rms=2.89μT) in steps of 20μs (𝛼=60°, resolution=2x2x10mm, TR=9.06ms).
Experiment 2 - Signal vs Flip Angle
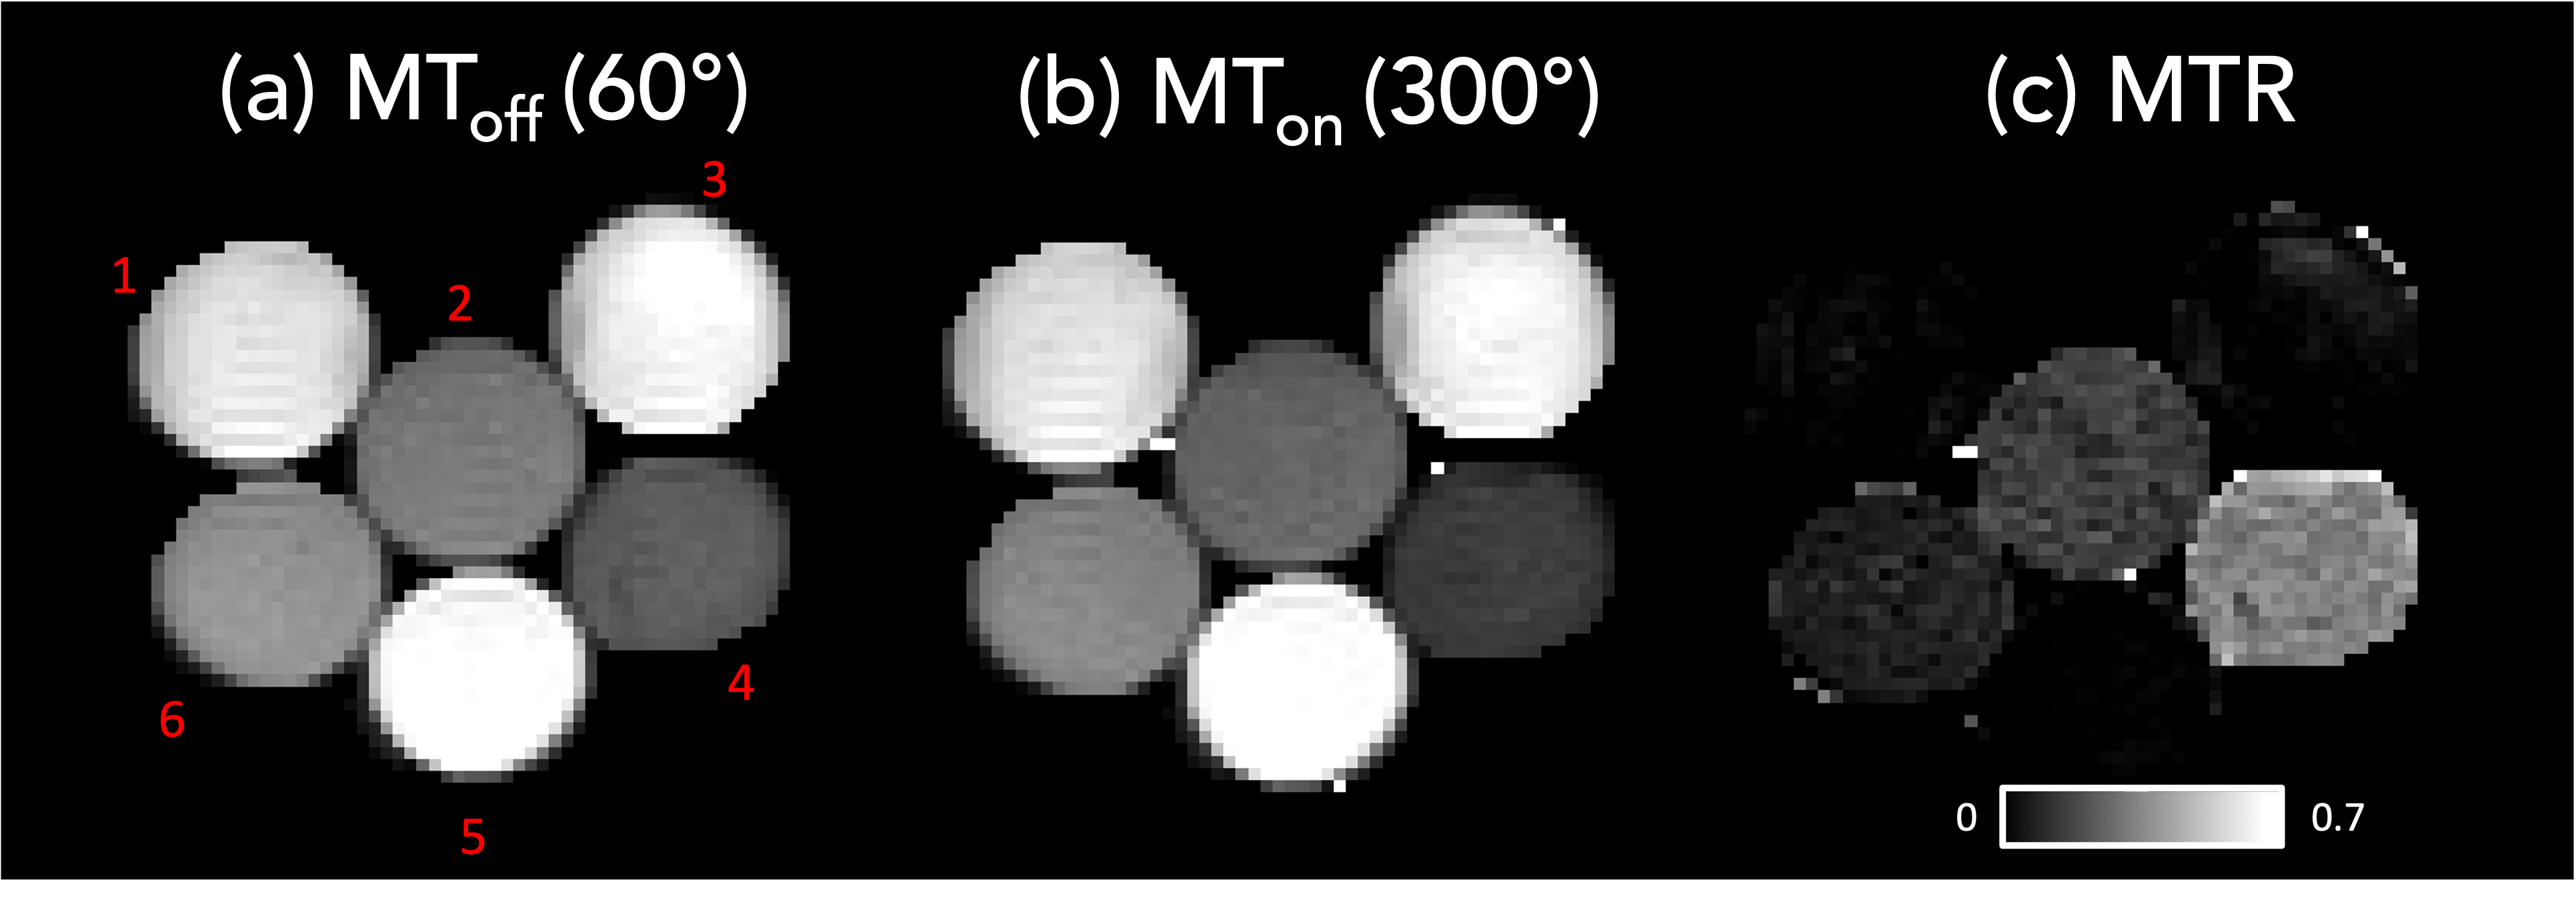
The variation of signal with 𝛼 was assessed in the same phantom. 𝛼 was varied from 1° (B1rms=0.04μT) to 420° (B1rms=20.36μT) in steps of 10° with 𝜏RF=200μs and other parameters from Experiment 1. An MTR map was calculated from a pair of images with differential MT-saturation, acquired at 60° (B1rms=3.36μT) and 300° (B1rms=16.82μT) with TR/𝜏RF=9.06ms/150μs.
Experiment 3 - In-vivo
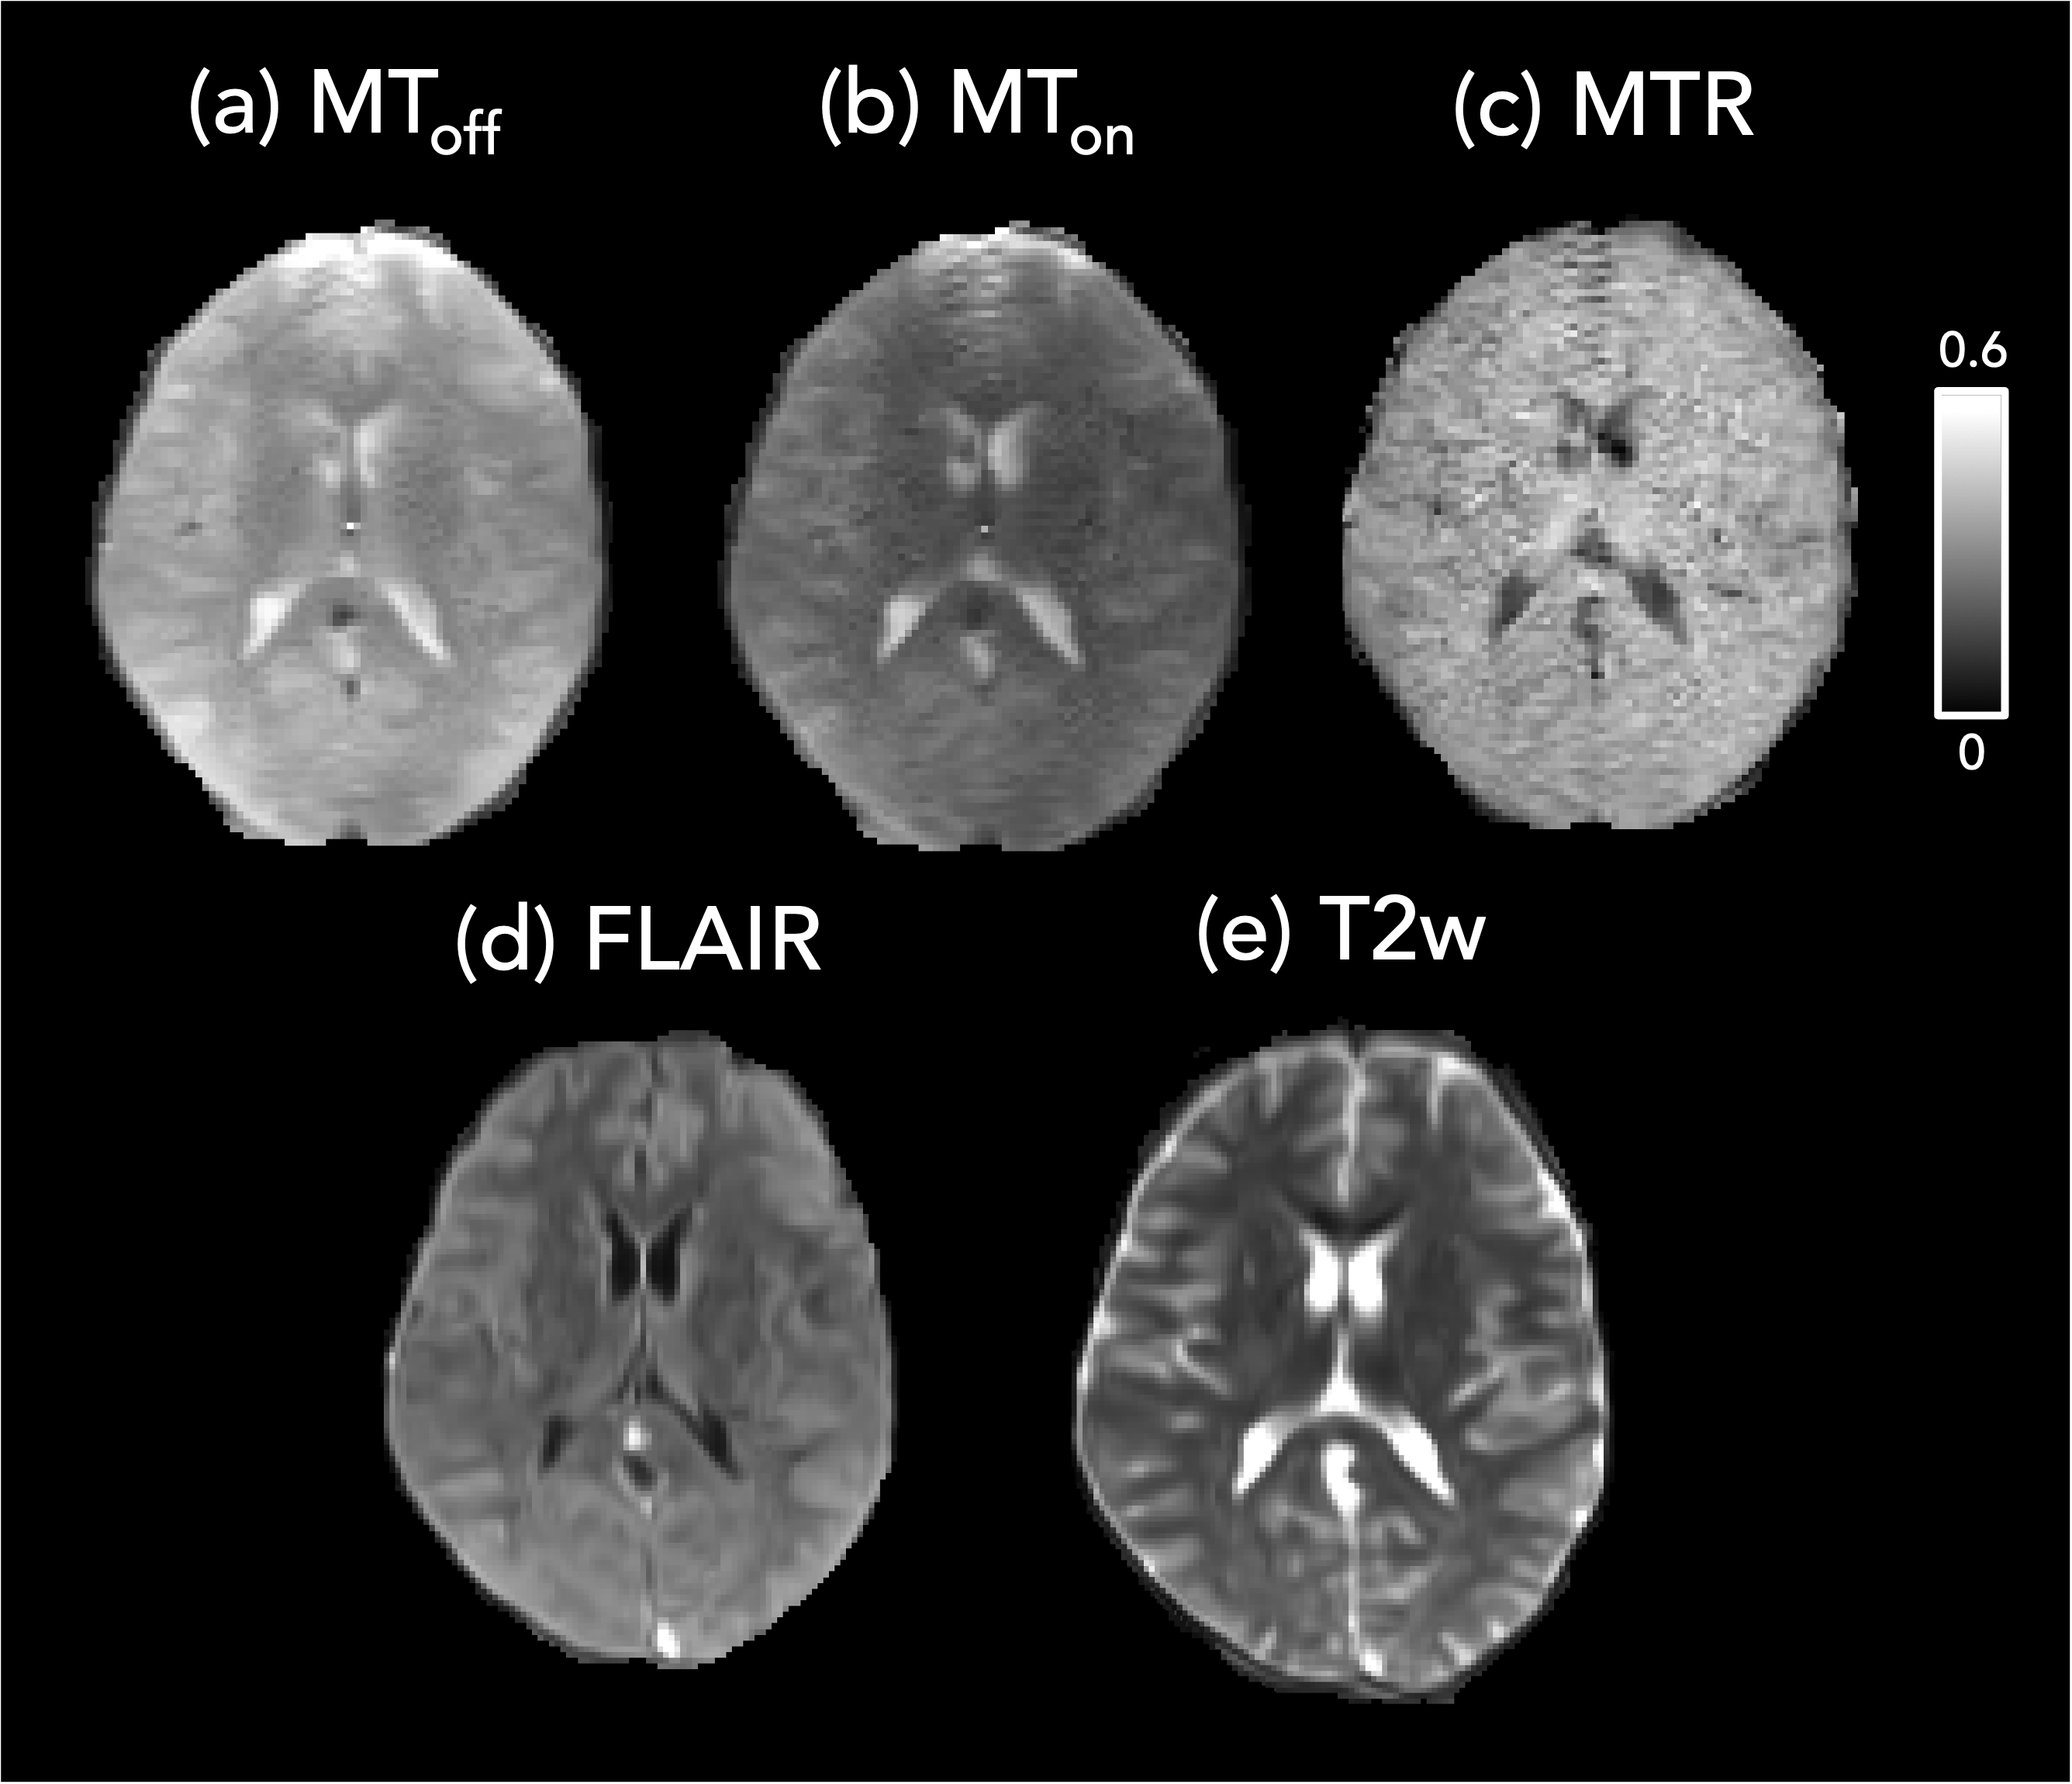
Based on outcomes from experiments 1 and 2, an in-vivo experiment was conducted in a healthy volunteer with 𝛼MToff/𝛼MTon=60°/300°, resolution=2x2x5mm, TR/𝜏RF=9.01ms/150μs, 8 averages, total duration=6:48min. A faster acquisition was performed with resolution=3x3x5mm, TR/𝜏RF=7.55ms/150μs, duration=4min. Anatomical images (T2w, T2-FLAIR) were acquired using the default protocols on the scanner.
Results
Experiment 1 showed that when 𝜏RF was increased while keeping TR and 𝛼 constant, the signals from the conditioner and cream increased, but the water signal remained constant (Figure 2a), demonstrating reduced MT saturation in substances containing high concentrations of fatty alcohols11 (expected to exhibit an MT effect).The results from Experiment 2 (Figure 2b) align qualitatively with the simulation (Figure 1)9. The signal curves are symmetric about 𝛼=180° for water as expected, but for the conditioner and cream the signal is reduced for the second peak. This MT effect is visualised in Figure 3, where the water vials show low MTR while the conditioner and cream show higher MTR.
Together, these experiments show that changing RF power affected the signal from conditioner but not water, suggesting that the effect is due to difference in MT saturation. Based on these results, a pairing of image parameters could be found to maximise the difference between higher and lower MT weighting to calculate MTR.
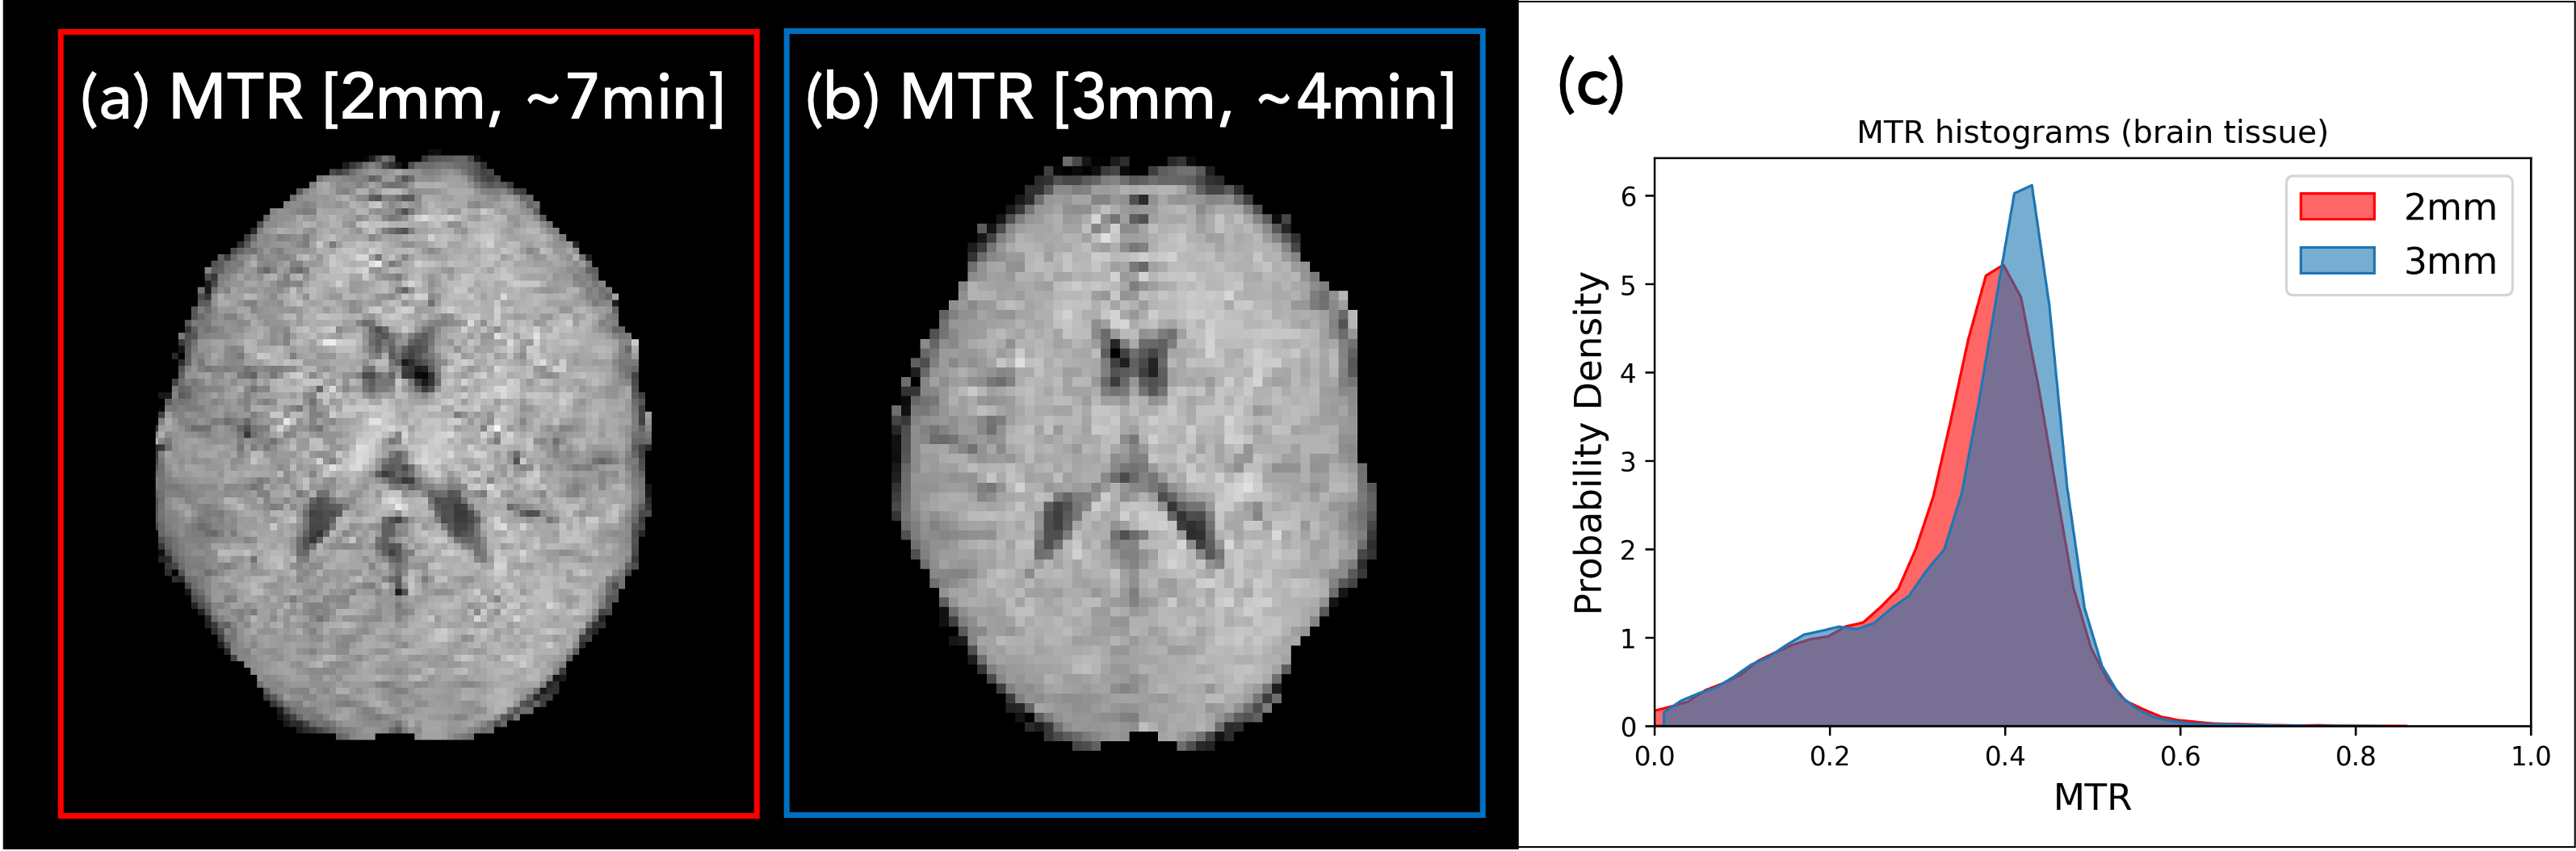
The in-vivo MT acquisition (Experiment 3) demonstrates reduced signal intensity in the MTon image relative to the MToff, especially in white matter (Figure 4). The pairing of 𝛼MToff/𝛼MTon=60°/300° showed slightly higher MTRs than previously reported at 1.5T6. Figure 5 shows a comparison of the two MTR acquisitions (2 and 3mm) together with whole brain histograms.
Discussion and Conclusion
In this work, we have demonstrated MT weighting in a PSIF sequence by changing the on-resonance RF excitation pulse. This work validates that the observed signal changes were due to MT saturation. The effect is visible in both phantoms and in-vivo, and can be mapped in as little as 4 minutes.The MT effect could be further maximised using a balanced SSFP sequence. This may provide better SNR and higher MTR values, but requires more development to avoid off-resonance banding artefacts. It should be noted that MTR is a semi-quantitative technique that is highly dependent on acquisition parameters (e.g. Fig 5, where MTRs increased with shorter TR). Quantitative MT could be considered at the expense of increased acquisition time.
This work demonstrates the ability to visualise an MT effect at ultra-low fields, moving towards in-vivo assessment of myelin for brain development and demyelinating diseases in populations for whom MRI is otherwise inaccessible.
Acknowledgements
We thank Hyperfine Inc for their involvement and support. FP, RPAGT and MEP are employed by Hyperfine Inc. EL, SW and SHK received funding from the Bill & Melinda Gates Foundation. This research is additionally funded by Natural Sciences and Engineering Research Council of Canada (AVD, SHK- Grant RGPIN-2018-03904) and Michael Smith Healthcare BC (SK).References
1. Zheng Y, Lee JC, Rudick R, Fisher E. Long-Term Magnetization Transfer Ratio Evolution in Multiple Sclerosis White Matter Lesions. J Neuroimaging. 2018 Mar 1;28(2):191–8.
2. Xydis V, Astrakas L, Zikou A, Pantou K, Andronikou S, Argyropoulou MI. Magnetization transfer ratio in the brain of preterm subjects: age-related changes during the first 2 years of life. Eur Radiol. 2006 Jan;16(1):215–20.
3. Ridha BH, Tozer DJ, Symms MR, Stockton KC, Lewis EB, Siddique MM, et al. Quantitative magnetization transfer imaging in Alzheimer disease. Radiology. 2007 Sep;244(3):832–7.
4. Seiler S, Pirpamer L, Hofer E, Duering M, Jouvent E, Fazekas F, et al. Magnetization transfer ratio relates to cognitive impairment in normal elderly. Front Aging Neurosci. 2014;6(SEP):263.
5. Henkelman RM, Stanisz GJ, Graham SJ. Magnetization transfer in MRI: A review. NMR Biomed. 2001;14(2):57–64.
6. Bieri O, Mamisch TC, Trattnig S, Scheffler K. Steady state free precession magnetization transfer imaging. Magn Reson Med. 2008 Nov 1;60(5):1261–6.
7. Bieri O, Scheffler K. Optimized balanced steady-state free precession magnetization transfer imaging. Magn Reson Med. 2007 Sep 1;58(3):511–8.
8. Gloor M, Scheffler K, Bieri O. Nonbalanced SSFP-based quantitative magnetization transfer imaging. Magn Reson Med. 2010 Jul 1;64(1):149–56.
9. Malik SJ, Teixeira RPAG, Hajnal JV. Extended phase graph formalism for systems with magnetization transfer and exchange. Magn Reson Med. 2018 Aug 1;80(2):767–79.
10. Manjón J v., Coupé P, Martí-Bonmatí L, Collins DL, Robles M. Adaptive non-local means denoising of MR images with spatially varying noise levels. J Magn Reson Imaging. 2010 Jan;31(1):192–203.
11. S. D. Swanson, D. I. Malyarenko, P. Schmiedlin-Ren, J. Adler, K. Helvie, L. Reingold, M. M. Al-Hawary, E. Zimmerman. Lamellar Liquid Crystal Phantoms for MT- Calibration and Quality Control in Clinical Studies. ISMRM 2012.
Figures