1582
Differentiation of intracranial solitary fbrous tumor from transitional meningioma using apparent difusion coefcient histogram analysis
Xianwang Liu1,2,3, Tao Han1,2,3, Hong Liu1,2,3, and Junlin Zhou1,2,3
1Department of Radiology, Lanzhou University Second Hospital, lanzhou, China, 2Gansu International Scientific and Technological Cooperation Base of Medical Imaging Artificial Intelligence, lanzhou, China, 3Key Laboratory of Medical Imaging of Gansu Province, lanzhou, China
1Department of Radiology, Lanzhou University Second Hospital, lanzhou, China, 2Gansu International Scientific and Technological Cooperation Base of Medical Imaging Artificial Intelligence, lanzhou, China, 3Key Laboratory of Medical Imaging of Gansu Province, lanzhou, China
Synopsis
Keywords: Tumors, Quantitative Imaging, Solitary fibrous tumor, Transitional meningioma, Magnetic resonance imaging, Apparent diffusion coefficient, Histogram analysis
This study investigates the value of whole volume apparent diffusion coefficient (ADC) histogram analysis in distinguishing intracranial solitary fibrous tumor (SFT) and transitional meningioma (TM). The method was to compare the differences between ADC histogram parameters in them and explore the relationships between these parameters and Ki-67 expression. Our research demonstrates that SFT with higher variance, lower AP1, and AP10. Significant correlations were observed between these parameters and Ki-67 expression. The best diagnostic performance was obtained by variance. Therefore, we consider that the whole volumetric ADC histogram analysis is a feasible tool for non-invasive distinguishing between SFT and TM.Introduction
Intracranial solitary fibrous tumor (SFT) is a rare type of neoplasm of meningeal mesenchymal cell origin [1-2]. Transitional meningioma (TM) originates from meningeal arachnoid cells and is one of the most common subtypes of meningioma [3-4]. Pathologically, TM presents as a transitional morphological characteristic between endothelial meningioma and fibrous meningioma [4-5]. In clinical practice, similar clinical features and conventional imaging characteristics make it challenging to accurately distinguish SFT from TM before operation. However, there are significant differences between the two tumors in terms of biological behavior, treatment options, and prognosis [1,4]. Compared to TM, SFT exhibits a more aggressive biological behavior and is prone to recurrence and distant metastases [6]. Surgical resection combined with radiotherapy or chemotherapy is the recommended treatment modality [7]. In addition, the risk of intraoperative bleeding will be significantly increased due to an abundant blood supply of SFT [8]. Therefore, accurate preoperative differentiation between SFT and TM is of great importance for clinical treatment decision-making.The whole volume ADC histogram analysis can provide more abundant information on tumor characteristics, which has been proven to be an effective method for a comprehensive assessment of tumor heterogeneity [9-10]. Recently, several studies have shown that ADC histogram analysis has great application potential in the diagnosis, differentiation, and prognostic assessment of meningeal tumors [2, 10-11]. Up to now, no published studies using ADC histogram analysis to distinguish between SFT and TM. Therefore, this study aimed to investigate the value of whole volume ADC histogram analysis in preoperatively distinguishing SFT and TM. In addition, we further assess the relationships between significant ADC histogram parameters and Ki-67 expression.
Methods
Preoperative diffusion-weighted imaging datasets of 24 SFT and 28 TM patients were used to extract whole volume ADC histogram parameters (including variance, skewness, kurtosis, as well as mean, 1st (AP1), 10th (AP10), 50th (AP50), 90th (AP90), and 99th (AP99) percentiles of ADC) using MaZda software by two experienced neuroradiologists (with 25 and 7 years of brain MRI experience, respectively) in a blinded way (Fig.1 and 2). The independent t-test or Mann–Whitney U test was used to compare the differences in ADC histogram parameters between SFT and TM. Receiver operating characteristic curves were generated to identify the performance of significant ADC histogram parameters. Spearman’s correlation coefficients were calculated to explore the correlations between these parameters and the Ki-67 expression.Results
SFT showed significantly higher variance, lower AP1, and AP10 (all P < 0.05), compared to TM (Table1). The best diagnostic performance was obtained by variance with an AUC of 0.848 (Fig. 3, Table 2). However, there was no significant difference in skewness, kurtosis, mean, or other percentiles of ADC between the two groups (all P > 0.05). Significant correlations were also observed between variance (r = 0.519), AP1 (r = -0.425), AP10 (r = -0.372), and the Ki-67 proliferation index ( all P < 0.05).Discussion
Variance reflects the variation of tumor image grayscale and the discrete degree of lesion characteristics, which is an important biological indicator for assessing tumor heterogeneity. A higher variance value represents more data deviating from the mean value in the lesion, indicating that the density in the tumor tissue is not uniform, with higher heterogeneity, and the cell proliferation activity in the tumor tissue will be also significantly increased [9,12-14]. In this study, SFT showed a higher variance, and a significant positive correlation was also observed between variance and the Ki-67 expression, which is consistent with previous studies. A possible explanation is that this may be closely related to tumor heterogeneity. SFT has higher heterogeneity, with active tumor cell proliferation and heterogeneous distribution of tissue components within the tumor, thus exhibiting a high degree of variance.The percentiles of ADC are also an essential quantitative parameter for assessing tumor heterogeneity, which is closely related to tumor biological behavior and tumor cell proliferative activity [15-16]. Tumors with high malignancy have a higher heterogeneity, with an active proliferation of tumor cells and a significant increase in the number and arrangement density of cells. The densely arranged tumor cells restrict the activity of water, which will eventually lead to a decrease in ADC values [15]. In our study, AP1 and AP10 were significantly lower in SFT than in TM, while the mean, AP50, AP90, and AP99 were not significantly different between them. In addition, our study also found that the expression level of Ki-67 proliferation index in SFT group was significantly higher than that in TM group, and AP1 had the strongest correlation with Ki-67 proliferation index among percentiles of ADC. This may be since that the lower-level percentiles of ADC represent the most active and densely proliferating areas of cells within the tumor, which can provide a more realistic and objective assessment of tumor heterogeneity. Given the above, lower-level percentiles of ADC should perhaps be given more concern when using ADC histogram analysis to evaluate brain tumors.
Conclusions
In conclusion, our study demonstrated that whole volumetric ADC histogram analysis is a feasible tool for non-invasive preoperatively distinguishing intracranial SFT and TM, with the variance being the most promising potential parameter, which may be helpful for clinical treatment decisions.Acknowledgements
No acknowledgement found.References
- Kinslow CJ, Bruce SS, Rae AI, et al. Solitary-fibrous tumor/hemangiopericytoma of the central nervous system: a population-based study. J Neurooncol. 2018;138(1):173-182.
- Yang H, Liu X, Jiang J, Zhou J. Apparent diffusion coefficient histogram analysis to preoperative evaluate intracranial solitary fibrous tumor: Relationship to Ki-67 proliferation index. Clin Neurol Neurosurg. 2022;220:107364.
- Louis DN, Perry A, Wesseling P, et al. The 2021 WHO Classification of Tumors of the Central Nervous System: a summary. Neuro Oncol. 2021;23(8):1231-1251.
- Ma XJ, Zhang GJ, Wang W, Li D, Wu Z, Zhang JT. Proposed Treatment for Intracranial Transitional Meningioma: A Single-Center Series of 298 Cases. World Neurosurg. 2019;127:e280-e287.
- Zhang J, Zhang G, Cao Y, et al. A Magnetic Resonance Imaging-Based Radiomic Model for the Noninvasive Preoperative Differentiation Between Transitional and Atypical Meningiomas. Front Oncol. 2022;12:811767.
- Shin DW, Kim JH, Chong S, et al. Intracranial solitary fibrous tumor/hemangiopericytoma: tumor reclassification and assessment of treatment outcome via the 2016 WHO classification. J Neurooncol. 2021;154(2):171-178.
- Sung KS, Moon JH, Kim EH, et al. Solitary fibrous tumor/hemangiopericytoma: treatment results based on the 2016 WHO classification. J Neurosurg. 2018:1-8.
- Chen T, Jiang B, Zheng Y, et al. Differentiating intracranial solitary fibrous tumor/hemangiopericytoma from meningioma using diffusion-weighted imaging and susceptibility-weighted imaging. Neuroradiology. 2020;62(2):175-184.
- Cao T, Jiang R, Zheng L, et al. T1 and ADC histogram parameters may be an in vivo biomarker for predicting the grade, subtype, and proliferative activity of meningioma. Eur Radiol. 2022.
- Xue C, Liu S, Deng J, et al. Apparent Diffusion Coefficient Histogram Analysis for the Preoperative Evaluation of Ki-67 Expression in Pituitary Macroadenoma. Clin Neuroradiol. 2022;32(1):269-276.
- Liu X, Huang X, Han T, et al. Discrimination between microcystic meningioma and atypical meningioma using whole-lesion apparent diffusion coefficient histogram analysis. Clin Radiol. 2022;77(11):864-869.
- Just N. Improving tumour heterogeneity MRI assessment with histograms. Br J Cancer. 2014;111(12):2205-2213.
- Zhao L, Liang M, Yang Y, Zhao XM, Zhang HM. Histogram models based on intravoxel incoherent motion diffusion-weighted imaging to predict nodal staging of rectal cancer. European Journal Of Radiology. 2021;142.
- Bohara M, Nakajo M, Kamimura K, et al. Histological Grade of Meningioma: Prediction by Intravoxel Incoherent Motion Histogram Parameters. Academic Radiology. 2020;27(3):342-353.
- Gihr GA, Horvath-Rizea D, Hekeler E, et al. Histogram Analysis of Diffusion Weighted Imaging in Low-Grade Gliomas: in vivo Characterization of Tumor Architecture and Corresponding Neuropathology. Front Oncol. 2020;10:206.
- Liu X, Deng J, Sun Q, et al. Differentiation of intracranial solitary fibrous tumor/hemangiopericytoma from atypical meningioma using apparent diffusion coefficient histogram analysis. Neurosurg Rev. 2022;45(3):2449-2456.
Figures
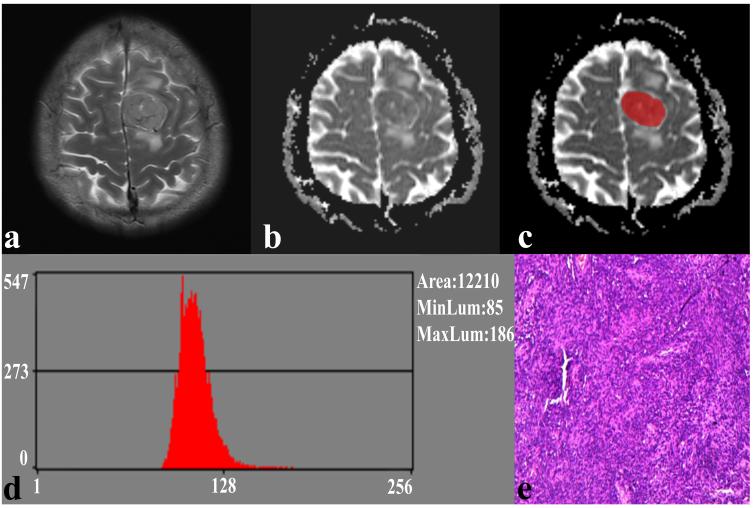
Fig. 1. A 41-year-old male with SFT. (a) The axial T2WI image shows an inhomogeneous lesion on the left side of the falx cerebri. (b) The lesion shows an uneven low signal on the ADC image. (c) The lesion covered ROI on the ADC image. (d) Histogram of the ROI. (e) Pathological analysis confirms SFT (hematoxylin and eosin, ×100).
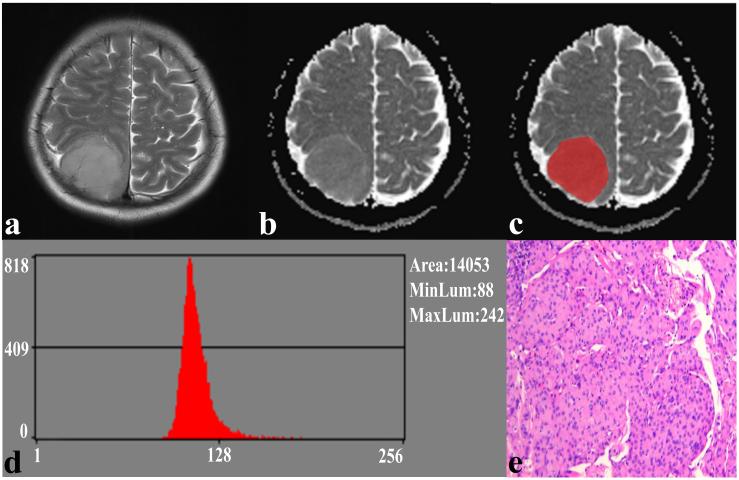
Fig. 2. A 59-year-old female with TM. (a) The axial T2WI image shows a homogeneous, well-defined lesion on the right parietal region. (b) The lesion shows a low signal on the ADC image. (c) The lesion covered ROI on the ADC image. (d) Histogram of the ROI. (e) Pathological analysis confirms TM (hematoxylin and eosin, ×100).
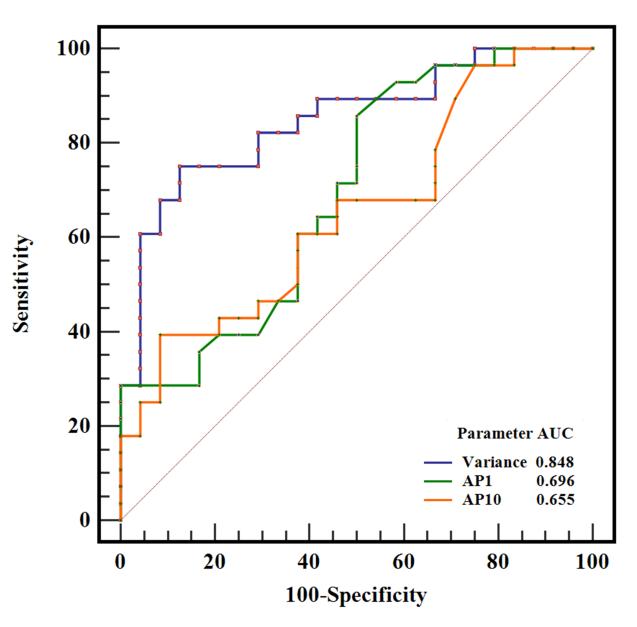
Fig. 3. ROC curves of variance, AP1, and AP10 in differentiating SFT and TM, and the variance generated the highest AUC of 0.848
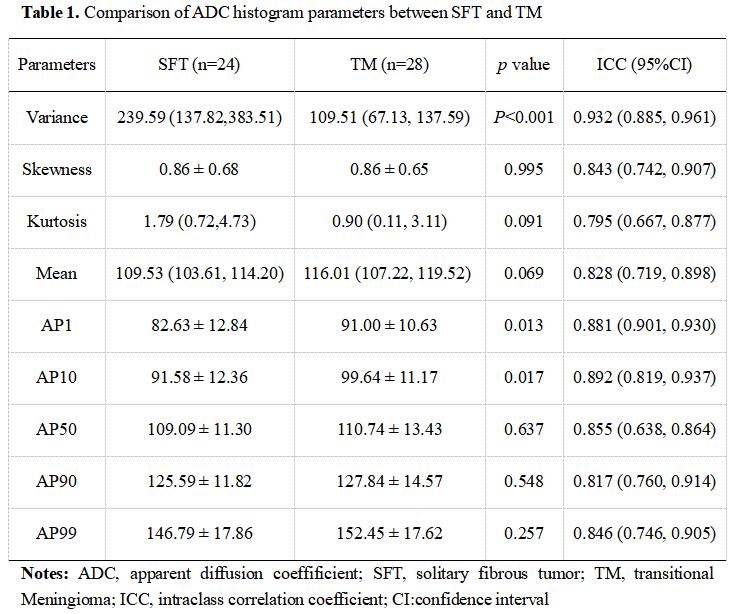
Table 1. Comparison of ADC histogram parameters between SFT and TM
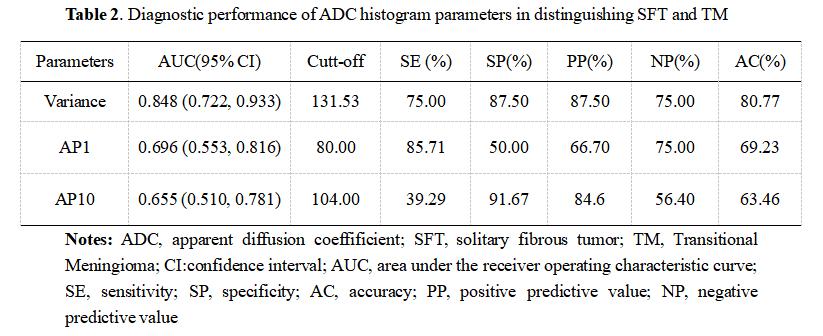
Table 2. Diagnostic performance of ADC histogram parameters in distinguishing SFT and TM
DOI: https://doi.org/10.58530/2023/1582