1581
Spatially Explicit Analysis of Tumor Hypoxia Heterogeneity from IVIM MRI Predicted Survival of Higher-Grade Glioma1Renji Hospital, Shanghai Jiaotong University School of Medicine, Shanghai, China, 2MR Scientific Marketing, Siemens Healthineers Ltd. Shanghai, China, Shanghai, China, 3Shanghai Key Laboratory of Magnetic Resonance, East China Normal University, Shanghai, China
Synopsis
Keywords: Tumors, Brain, Diffusion weighted MRI
This study investigated the feasibility of spatially explicit analysis based on IVIM MRI to identify hypoxia-related habitats with higher-grade glioma, and to predict progress-free survival in patients. The results showed that spatial explicit analysis on IVIM MRI could be an appropriate method for distinguishing different hypoxic subregions in glioma. In addition, the volume percentage of less hypoxic habitats can effectively predict progress-free survival in higher-grade glioma.Introduction
Instead of being a single self-organized system, cancers consist of a set of habitats, with specific microenvironment and cellular characteristics(1). Hypoxia is critical in the establishment of this heterogeneity(2). Conventional radiomic analyses generated quantitative features over the entire tumor. Although with high prognostic power, this approach assumes that tumors are heterogeneous but well mixed. Spatially explicit analysis can be used to identify regional variations within a tumor by evaluating cell density, and metabolic or perfusion-related features on Magnetic Resonance Imaging (MRI). Diffusion weighted imaging (DWI) has been shown to correlate well with cellularity and tissue perfusion in glioma based on images with different diffusion weighting (b-values)(3). By using the intravoxel incoherent motion (IVIM) model, the apparent diffusion coefficient (D) and perfusion fraction (f) could be estimated from DWI, which have been proven to link oxygen consumption and supply(4).Thus, the purposes of this study were to (a) evaluate the utility of spatially explicit analysis based on IVIM MRI in identifying subregions of different hypoxic statuses within glioma; (b) identify effective markers for predicting progression-free survival (PFS) in patients with higher-grade glioma (HGG) based on different hypoxia-related subregions.
Methods
This study included patients who were pathologically confirmed with HGG and underwent standard-of-care treatment. All patients underwent MRI including T1WI, T2WI, FLAIR, contrast-enhanced T1WI (CE-T1WI), and multi-b value DWI (b = 0, 50, 100, 200, 800, 1000 s/mm2) on MAGNETON Prisma 3 T MR scanner (Siemens Healthcare, Erlangen, Germany). The DWI parameters were as follows: TR/TE, 6500/74 ms; FOV, 240mm × 240 mm; matrix, 192 × 192; and slice thickness/gap, 4/1.2 mm. The total acquisition time for the DW sequence was 4 minutes and 9 seconds.Enhancing lesion segmentation was conducted on CE-T1 and DWIb=0 images by a radiologist (with a 5-year of experience in neuro-radiology) using leveling tracing segmentation method on 3D slicer software (https://www.slicer.org)(5). D and f maps were generated using MITK Diffusion software (Medical Imaging Interaction Toolkit, DKFZ, Heidelberg, Germany; www.MITK.org). Spatially explicit analysis was performed on contrast-enhancing mass on D and f maps. All voxels of the tumor region in D and f maps were grouped into three hypoxia-related habitats using the k-means clustering algorithm. Spatial habitats of less hypoxic (LH), more hypoxic (MH), and nonviable (NV) habitats were identified, which correspond to high f and low D value, low f and low D value, and high D value subregions (Fig. 1).
The relation between 3-years PFS and features of each habitat was assessed using univariate and multivariate cox regression analysis. The cut-off values of independent predictors were determined by the X-tile program (version 3.5.0, Yale University, New Haven, CT, USA). Kaplan-Meier curves were used to analyze predictive accuracy. A p < 0.05 was considered statistically significant.
Results
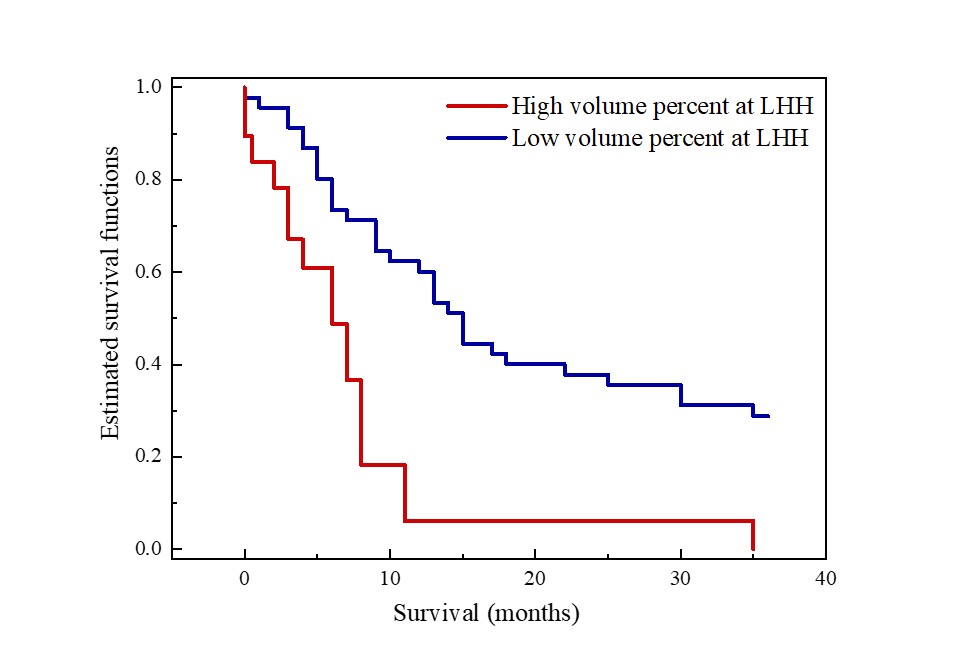
Sixty-five patients (mean 56 years, range 19-78 years, 40 male) were enrolled. Quantitative parameters, including volume, volume percentage, Dmean, and fmean were then generated from each habitat (Fig.2). Fig. 3 shows examples of hypoxia-related habitats of HGG patients with different PFS statuses.In univariate cox regression, the fmean of MHH (hazard ratio (HR) = 0.99, 95% confidence intervals (CI) 0.98-1.00; P = 0.047) and volume percentage of LHH (HR = 3.23, 95% CI 1.40-7.43, P = 0.006) were significantly associated with PFS. Volume percentage of LH remained significant in multivariate analysis (HR = 2.8, 95% CI 1.18-6.32, P = 0.020) (Table 1). The cut-off values of the volume percentage of LH habitat were 0.8. The Kaplan-Meier curves validated the fine predictive accuracy of the prognostic signature for predicting PFS (p < 0.001) (Fig. 4).
Discussion
This study was based on the hypothesis that the oxygen consumption and supply of tumors can be assessed by measuring D and f (6). D and f values have been proven that correlated well with cell density and tissue perfusion, respectively. Based on hypoxia-related imaging, we further identified three hypoxia statuses within the whole tumor. Each of them presents a distinct habitat with environmental selection force and cell population. Cells in a less hypoxic microenvironment tend to evolve into the main force that promotes proliferation and aggressiveness of the tumor, thus will affect prognosis in patients greatly (7, 8). This is consistent with the results of this study that the prognosis of patients was significantly associated with the percentage of the volume of LHH (p < 0.05). A significant difference also was observed in the univariate cox regression between the perfusion condition of MHH and PFS (p < 0.05). Cells in more hypoxic microenvironment tend to be a cellular subtype that is resistant to hypoxia and acidosis, and this type of cell may be able to transform into highly aggressive cells when tissue perfusion is increased (9). The identification of these particular sub-regions on MRI provided useful information for interpreting and visualizing tumor heterogeneity, thus aided implementation of customized treatment strategies for patients with glioma.Conclusion
Spatially explicit analysis based on IVIM MRI appears to effectively and noninvasively assess heterogeneity within the tumors by providing a set of hypoxia-related habitats. Preoperative hypoxic heterogeneity contains useful information about progress-free survival in patients with higher-grade gliomas.Acknowledgements
This study was funded by the National Natural Science Foundation of China (No.82171885, 81971583); Shanghai Science and Technology Commission explorer Program (21TS1400700); Shanghai Natural Science Foundation (20ZR1433200); the Medical Engineering Cross Research Foundation of Shanghai Jiao Tong University (No. YG2022QN035); Horizontal Research supported by Renji Hospital (grant RJKY22-01).References
1. Greaves M, Maley CC (2012) Clonal evolution in cancer. Nature. doi:10.1038/nature10762
2. Thews O, Nowak M, Sauvant C, Gekle M (2011) Hypoxia-induced extracellular acidosis increases p-glycoprotein activity and chemoresistance in tumors in vivo via p38 signaling pathway. Advances in experimental medicine and biology. doi:10.1007/978-1-4419-7756-4_16
3. Le Bihan D (1991) Molecular diffusion nuclear magnetic resonance imaging. Magn Reson Q.
4. Le Bihan D, Breton E, Lallemand D, et al. (1986) MR imaging of intravoxel incoherent motions: application to diffusion and perfusion in neurologic disorders. Radiology. doi:10.1148/radiology.161.2.3763909
5. Fedorov A, Beichel R, Kalpathy-Cramer J, et al. (2012) 3D Slicer as an image computing platform for the Quantitative Imaging Network. Magn Reson Imaging. doi:10.1016/j.mri.2012.05.001
6. Hompland T, Hole KH, Ragnum HB, et al. (2018) Combined MR Imaging of Oxygen Consumption and Supply Reveals Tumor Hypoxia and Aggressiveness in Prostate Cancer Patients. Cancer Res. doi:10.1158/0008-5472.Can-17-3806
7. Juan-Albarracín J, Fuster-Garcia E, Pérez-Girbés A, et al. (2018) Glioblastoma: Vascular Habitats Detected at Preoperative Dynamic Susceptibility-weighted Contrast-enhanced Perfusion MR Imaging Predict Survival. Radiology. doi:10.1148/radiol.2017170845
8. Gatenby RA, Grove O, Gillies RJ (2013) Quantitative imaging in cancer evolution and ecology. Radiology.
9. Kim M, Park JE, Kim HS, et al. (2021) Spatiotemporal habitats from multiparametric physiologic MRI distinguish tumor progression from a treatment-related change in post-treatment glioblastoma. European radiology. doi:10.1007/s00330-021-07718-y
Figures
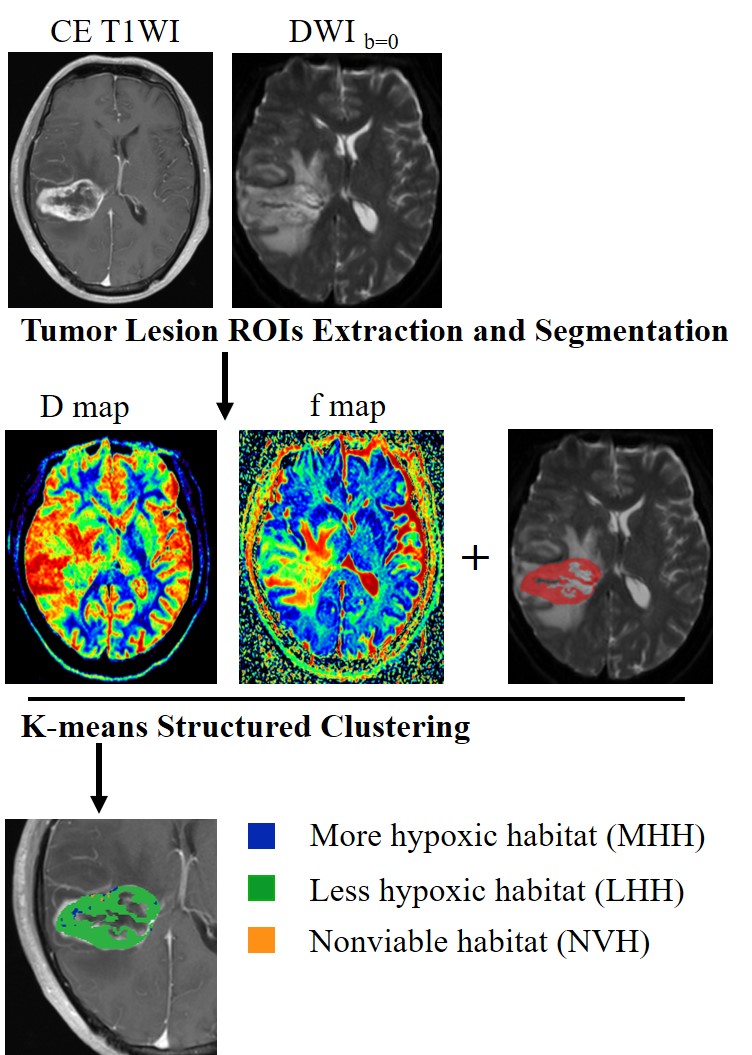
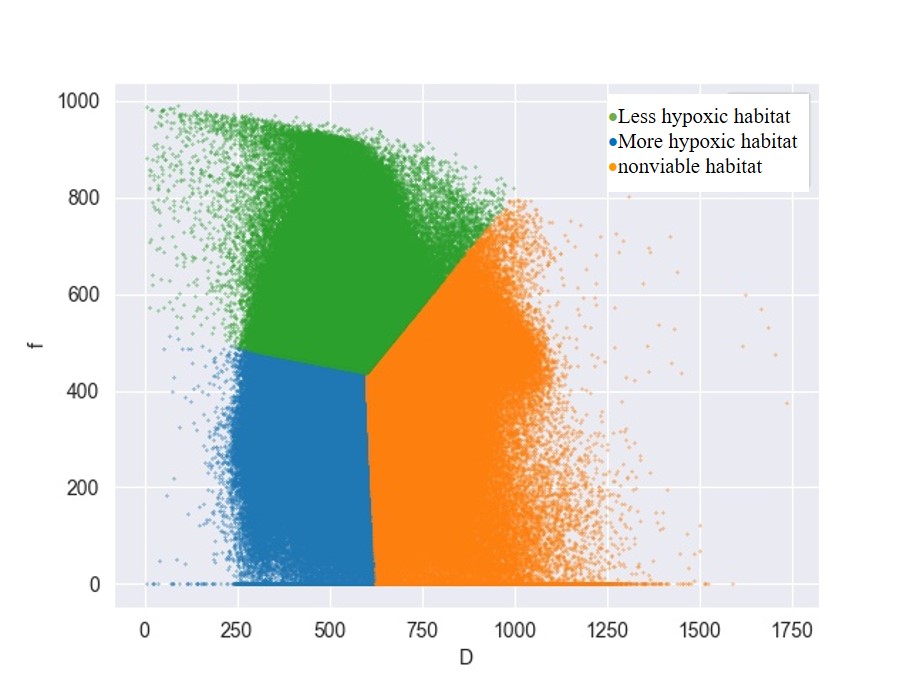
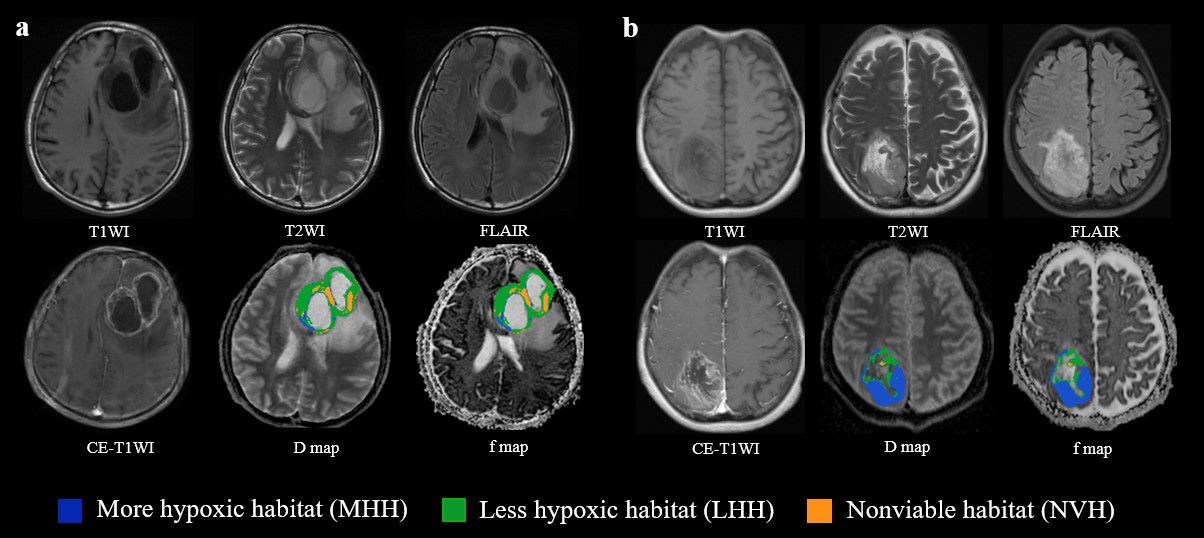
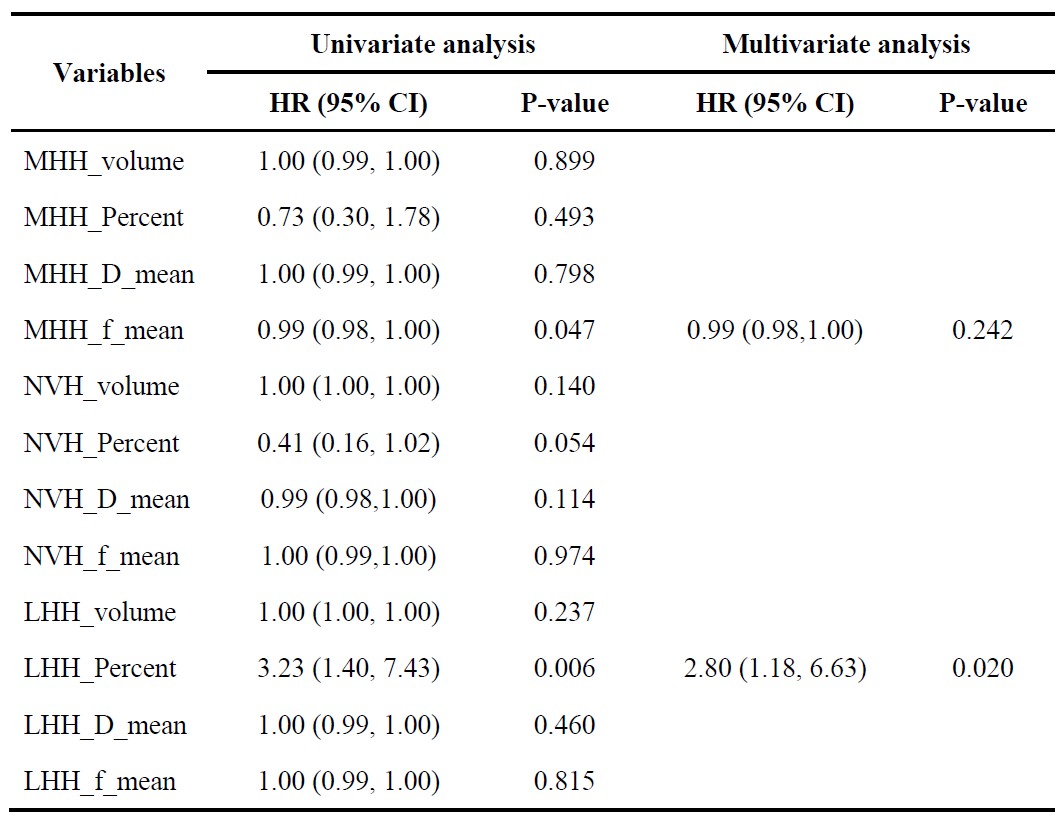
Table 1 Predictors of progression-free survival in patients with HGG
MHH, more hypoxic habitat; LHH, less hypoxic habitat; NVH, nonviable habitats.Volume, the volume of habitat; percent, the volume percentage of habitat; f_mean, mean of f value in habitat, D_mean, mean of D value in habitat