1579
Detecting microstructural features in gliomas with differences in malignancy and IDH-1 mutation status with a three-component diffusion model1Department of Radiology, Renji Hospital, School of Medicine, Shanghai Jiao Tong University, Shanghai, China, 2Renji Hospital, School of Medicine, Shanghai Jiao Tong University, Shanghai, China, 3MR Collaboration, Central Research Institute, United Imaging Healthcare, Shanghai, China
Synopsis
Keywords: Tumors, Diffusion/other diffusion imaging techniques
Evaluation of the degree of malignancy of gliomas, including the histopathological and molecular features, is of great importance for neurosurgeons in making individualized operation plans before surgery. In our study, the clinical value of a three-component diffusion model in characterizing gliomas malignancy and IDH-1 mutation status was evaluated. Our results showed that the three-component diffusion model exhibited great potential in evaluating the phenotype and genotype of gliomas by providing more complex microstructural information and showed significantly optimal diagnostic performance than the mono-exponential, bi-exponential and DKI models.
Introduction
Higher grade and wild-type IDH1 tumors have shown clear evidence of treatment resistance and lower survival rates1. Evaluation of the degree of malignancy of gliomas, including the histopathological and molecular features, is of great importance for neurosurgeons in making individualized operation plans before surgery2,3.Although the bi-exponential model has the ability to separate parenchymal diffusion from microvascular pseudo-diffusion4,5, it has been challenged for its lack of reproducibility and has been considered as oversimplified6,7. Recently a spectral analysis method using the non-negative least squares (NNLS) has been introduced to identify an intermediate component between the two classical components8,9. Previous studies have suggested that intermediate diffusion may be correlated with the interstitial composition or extravascular extracellular space (EES)9,10.
Thus, we aimed to 1) investigate the clinical value of diffusion parameters, especially intermediate diffusion derived from the three-component model in evaluating the degree of malignancy and IDH-1 gene type of gliomas, and 2) compare the three-component model with other diffusion models.
Methods
Totally 60 patients with surgery or biopsy-proven gliomas(19 LGG; 32 IDH-1 mutation) were retrospectively included in this study. All MRI examinations were performed on a 3.0T scanner (uMR 780, United Imaging Healthcare) with a 32-channel phased-array head coil. Multi-b-value DWI was performed using a single-shot spin-echo echo planar imaging sequence with 13 b-values (0, 20, 50, 80, 100, 200, 500, 800, 1000, 1500, 2000, 3000, and 4000 s/mm2).All diffusion data were processed voxel-by-voxel using the Levenberg–Marquardt nonlinear least square fitting algorithm with MATLAB 2016a software (MathWorks, Natick, MA, USA). The intermediate and perfusion-related diffusion coefficients (Dint and Dp) and fractions of strictly-limited, intermediate and perfusion-related diffusion (Fvery-slow, Fint and Fp) were obtained with a modified three-component diffusion model11. Parameters were also obtained from diffusion kurtosis model (MD, MK), mono- (ADC) and bi-exponential models (D, D* and f). Regions of interest (ROIs) were manually delineated in the solid part of tumors on the DWI images of b value = 1000 s/mm2. Finally, the ROIs were propagated to all the metric maps to calculate the average value of each parameter.
All metrics were compared between different tumor grades and IDH1-1 gene types using independent-samples t-test or Mann-Whitney U test. Logistic regression analysis was performed for each diffusion model to investigate the parameters that determined the glioma grade. Receiver operating characteristic (ROC) curves were employed to calculate the area under the curve (AUC) to assess diagnostic performance for HGG. P < 0.05 were considered as statistically significant.
Results
HGGs had significantly higher Fint, Fvery-slow and Dp values but significantly lower Fp and Dint values than LGGs, and Fint and Fp differed significantly among grade II, III, and IV gliomas (P < 0.05 for all) (Figure 1, Table 1). Fint achieved the highest AUC of 0.872 in differentiating between LGGs and HGGs (Figure 2). Logistic regression analysis revealed that in each model, Fint, D, ADC, MD and MK were associated with glioma grading. After multiple regression analysis, Fint remained the only differentiator. Additionally, Fint and Fp showed significant differences between IDH-1 mutated and IDH-1 wild-type gliomas (P = 0.007 and 0.01, respectively) (Figure 3).Discussion
All the parameters derived from the three-component model showed significant differences between LGGs and HGGs. Fint represents the fraction of the intermediate diffusion (extracellular and extravascular) and Dint is the corresponding diffusion coefficient. Dint was considerably lower in HGGs, potentially because as the degree of malignancy in gliomas increases, disruption of the BBB and the narrow and disorganized EES result in the less freely water molecules diffusion12. The influence of this proportion will increase in HGGs, thus explaining the increase in Fint. Fvery-slow was defined as strictly-limited diffusion (intracellular) and significantly increased in HGGs in our study. the increase in Fvery-slow in HGGs may be related to the narrowness and complexity of the intracellular space. In our study, Fp and Dp represented the perfusion-related diffusion component. Our results showed that Dp was significantly increased in HGGs compared with LGGs, reflecting the high vascularity of HGGs. However, Fp was significantly lower in HGGs, which is inconsistent with previous general knowledge7.The significantly lower Fint values and higher Fp values of IDH-1 mutation group indicated the higher fraction of diffusion in the EES and the lower fraction of intravascular diffusion in IDH-1 wild-type gliomas. Some studies have shown that IDH-1 mutations result in a lower relative cerebral blood volume (rCBV) than wide-type IDH-113,14. However, the key internal connection is unclear, and more in-depth research is needed.
Besides, Fint achieved the highest AUC in differentiating LGGs from HGGs. After multiple regression analysis, Fint remained the only differentiator. Thus the diagnostic performance of the three-component model in differentiating LGGs from HGGs seemed to be better than that of mono-, bi-exponential and DKI models, which indicated that the three-component model could better reveal the real status of water diffusion and more accurately describe the complex features of tumor compared with other models.
Conclusion
The three-component diffusion model served as useful biomarker for detecting microstructural features in gliomas with different grades and IDH-1 mutation statuses.Acknowledgements
This study was funded by the National Natural Science Foundation of China (No.82171885, 81971583); Shanghai Science and Technology Commission explorer Program (21TS1400700); Shanghai Natural Science Foundation (20ZR1433200); the Medical Engineering Cross Research Foundation of Shanghai Jiao Tong University (No. YG2022QN035); Horizontal Research supported by Renji Hospital (grant RJKY22-01)
References
1. Eckel-Passow JE, Lachance DH, Molinaro AM et al (2015) Glioma Groups Based on 1p/19q, IDH, and TERT Promoter Mutations in Tumors. N Engl J Med 372:2499-2508.
2. Stupp R, Mason WP, van den Bent MJ et al (2005) Radiotherapy plus concomitant and adjuvant temozolomide for glioblastoma. N Engl J Med 352:987-996.
3. Yan H, Parsons DW, Jin G et al (2009) IDH1 and IDH2 mutations in gliomas. N Engl J Med 360:765-773.
4. Le Bihan D, Breton E, Lallemand D, Aubin ML, Vignaud J, Laval-Jeantet M (1988) Separation of diffusion and perfusion in intravoxel incoherent motion MR imaging. Radiology 168:497-505.
5. Gao A, Zhang H, Yan X et al (2022) Whole-Tumor Histogram Analysis of Multiple Diffusion Metrics for Glioma Genotyping. Radiology 302:652-661.
6. Koh DM, Collins DJ, Orton MR (2011) Intravoxel incoherent motion in body diffusion-weighted MRI: reality and challenges. AJR Am J Roentgenol 196:1351-1361.
7. Bisdas S, Koh TS, Roder C et al (2013) Intravoxel incoherent motion diffusion-weighted MR imaging of gliomas: feasibility of the method and initial results. Neuroradiology 55:1189-1196.
8. Ohno N, Miyati T, Kobayashi S, Gabata T (2016) Modified triexponential analysis of intravoxel incoherent motion for brain perfusion and diffusion. J Magn Reson Imaging 43:818-823.
9. Wong SM, Backes WH, Drenthen GS et al (2020) Spectral Diffusion Analysis of Intravoxel Incoherent Motion MRI in Cerebral Small Vessel Disease. J Magn Reson Imaging 51:1170-1180.
10. Fujima N, Sakashita T, Homma A et al (2017) Advanced diffusion models in head and neck squamous cell carcinoma patients: Goodness of fit, relationships among diffusion parameters and comparison with dynamic contrast-enhanced perfusion. Magn Reson Imaging 36:16-23.
11. Ling C, Shi F, Zhang J, Jiang B, Dong F, Zeng Q (2019) In vivo measurement of cytoplasmic organelle water fraction using diffusion-weighted imaging: Application in the malignant grading and differential diagnosis of gliomas. Medicine (Baltimore) 98:e17949.
12. Mills SJ, Soh C, Rose CJ et al (2010) Candidate biomarkers of extravascular extracellular space: a direct comparison of apparent diffusion coefficient and dynamic contrast-enhanced MR imaging--derived measurement of the volume of the extravascular extracellular space in glioblastoma multiforme. AJNR Am J Neuroradiol 31:549-553.
13. Jabehdar Maralani P, Myrehaug S, Mehrabian H et al (2021) Intravoxel incoherent motion (IVIM) modeling of diffusion MRI during chemoradiation predicts therapeutic response in IDH wildtype glioblastoma. Radiother Oncol 156:258-265.
14. Lu J, Li X, Li H (2021) Perfusion parameters derived from MRI for preoperative prediction of IDH mutation and MGMT promoter methylation status in glioblastomas. Magn Reson Imaging 83:189-195.
Figures
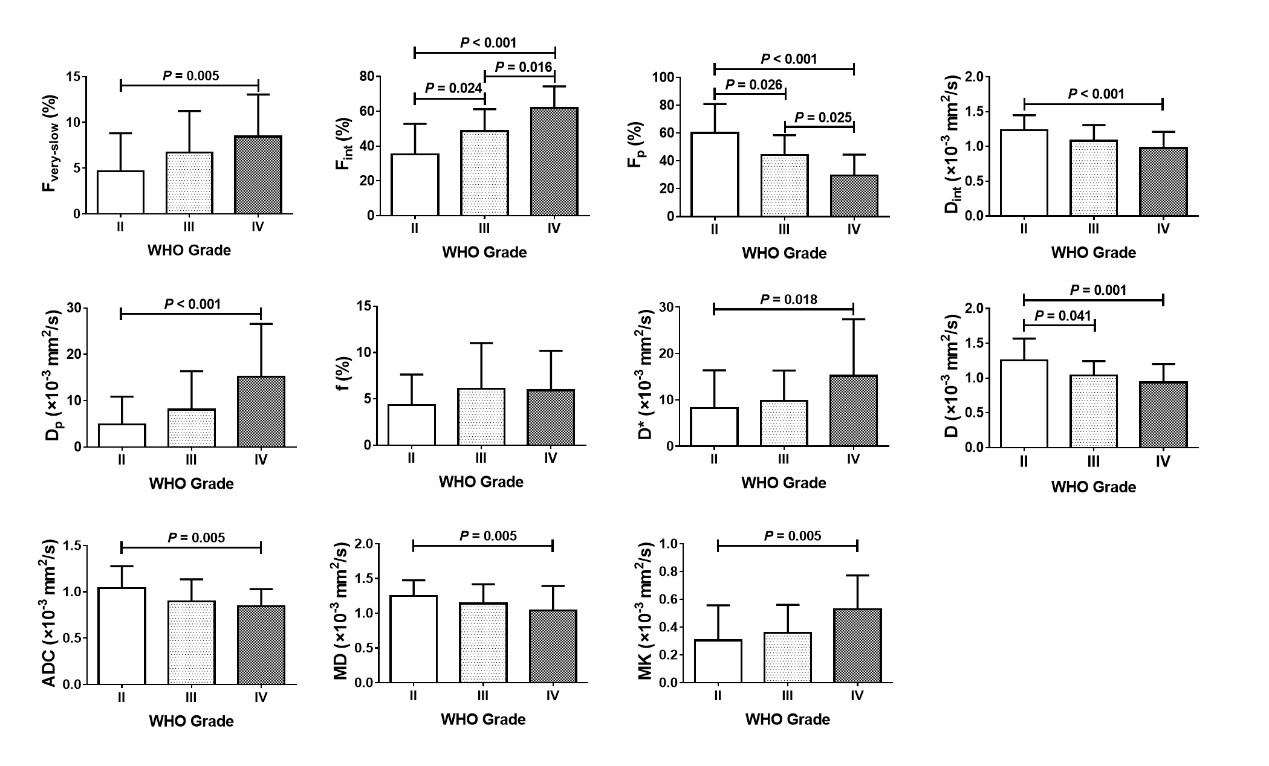
Figure1 The bar chart shows the mean value (± standard deviation) of each parameter from all diffusion models in WHO grade II, III, and IV gliomas. P values were obtained with independent-samples t-test (for normally distributed data) or Mann‒Whitney U test (for non-normally distributed data).
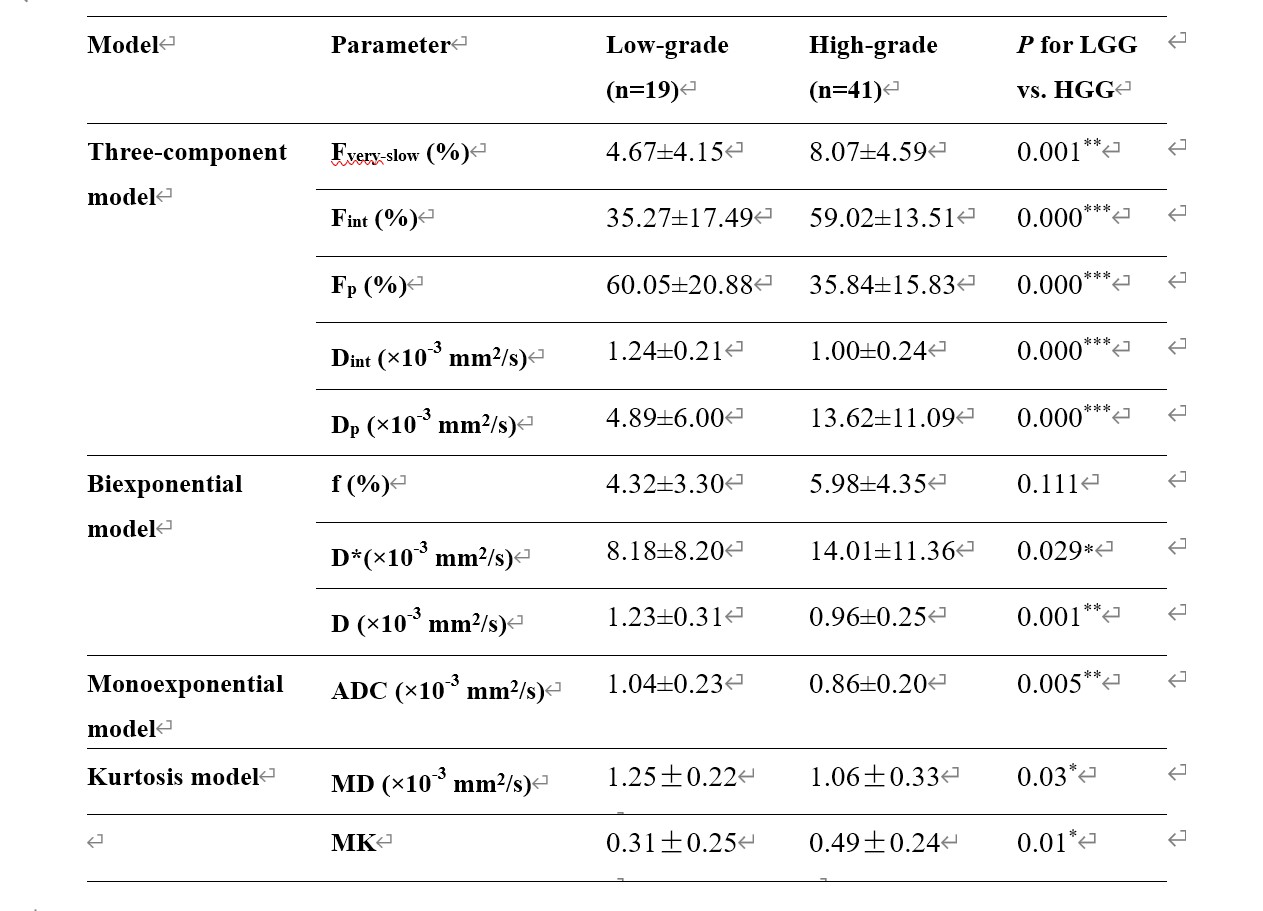
Table 1. Parameters derived from three-component, monoexponential and biexponential models in low- and high-grade gliomas

Figure 2. ROC curves of each parameter from all diffusion models in distinguishing high- from low-grade gliomas. Numbers in parentheses represent areas under the ROC curves.
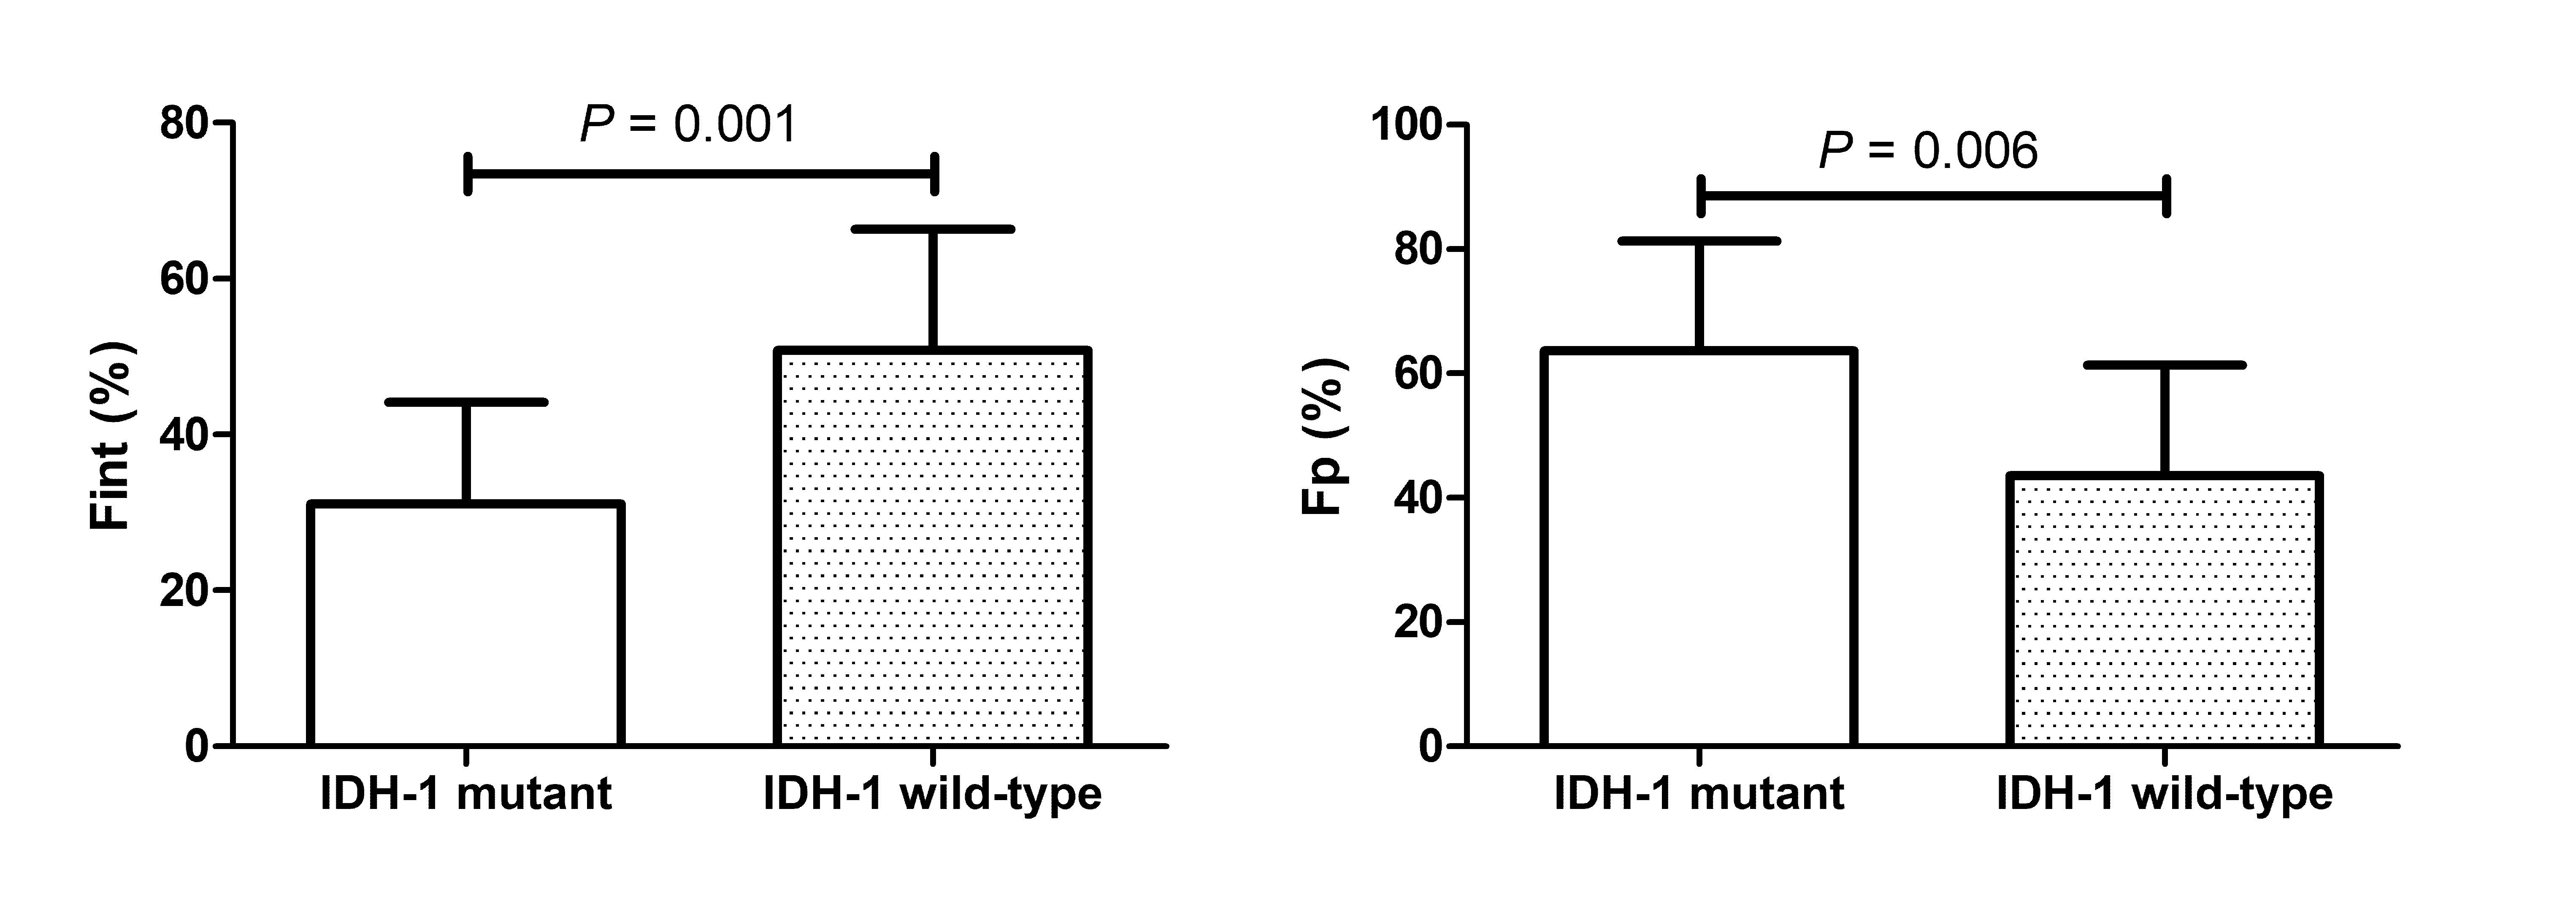
Figure 3. The bar chart shows the mean value (± standard deviation) of Fint and Fp in the isocitrate dehydrogenase 1 (IDH-1) mutant and wild-type groups of all gliomas.