1578
Differentiation of High-Grade Gliomas from Solitary Brain Metastases in the Peritumoral Edema: using Combined Synthetic MRI and 3D-pCASL1Second Clinical School, Lanzhou University, Lanzhou, China, Lanzhou, China, 2Department of Magnetic Resonance, Lanzhou University Second Hospital, Lanzhou, China, Lanzhou, China, 3GE Healthcare MR Research, Beijing, China, Beijing, China, 4GE Healthcare MR Enhancement Application, Beijing, China, Beijing, China, 5Department of Radiology, General Hospital of Ningxia Medical University, Yinchuan, China, Yinchuan, China
Synopsis
Keywords: Tumors, Tumor
The main work of our research was to investigate the difference of quantitative MR metrics from synthetic MRI and 3D-pCASL including T1, T2, PD, CBF, and the multiparametric strategies that contained more than one of the metrics between high-grade gliomas (HGGs) from solitary brain metastases (SBMs) in the peritumoral edema. We found that the T1, T2, and CBF were useful metrics for differentiating HGGs from SBMs which were easily confounded with HGGs in daily diagnosis. Furthermore, combining T1, T2, and CBF further improved their diagnostic performance.Introduction
High-grade gliomas (HGGs, grades 3 and 4)[1] exhibit poor prognosis, with 5-year survival ranges from 25.9% to 49.4% in grade 3 and of only 4.7% in grade 4[2]. Brain metastases are the most common brain tumors detected in adults[3], with solitary brain metastases (SBMs) account for approximately 50% of them[4]. The first manifestation of HGGs and SBMs overlap and it is difficult to distinguish between the two based on clinical and conventional radiographic findings, furthermore, treatment modalities are very heterogeneous for both of them. Pathological examination is the gold-standard evaluation for diagnosing SBMs from HGGs, but it may result in iatrogenic injury. Most studies found that functional imaging-derived quantitative metrics in intratumoral regions did not aid in differentiation of the two[5-7]. Considering the marked difference between two kinds of tumor peritumoral edema in physiological and pathophysiological conditions, thus, when distinguishing them considerable attention has focused on this region[8-10]. Synthetic MRI, which can simultaneously generate anatomical images of multiple contrast (synthetic T1FLAIR, T2WI, T2FLAIR, etc.) and quantitative maps of various metrics (T1map, T2map, PDmap, etc.), is a newly developed MR quantitative imaging method of increasing interest in recent years[11, 12]. The recent advent of pseudo-continuous arterial spin labeling combined with a 3D rapid readout sequence (3D-pCASL) and a background suppression technique has enabled the production of high-quality ASL images and has been used to measure cerebral blood flow (CBF) in brain tumors quantitatively. This study aims to use a combination of synthetic MRI and 3D-pCASL parameters to create a predictive multiparametric imaging approach that can be used to differentiate HGGs from SBMs in the peritumoral edema.Material and Methods
This prospective study was approved by the Medical Research Ethics Committee and written informed consent was obtained from all participants. A total of 176 patients with suspected intracranial space-occupying lesions were recruited between August 2020 and February 2022. All MR examinations were performed on a 3.0T MR scanner (SIGNATM Premier, GE Healthcare Systems, Milwaukee, WI, USA) equipped with a 48-channel head-neck unite coil. The main scanning parameters of sequences are shown in Table 1. All processing of the 3D-pCASL and synthetic MRI data was directly performed using Advantage Workstation (GE Healthcare). The peritumoral edema is characterized by hyperintense signals on synthetic T2WI in the white matter surrounding the enhanced tumor. Three regions of interest (ROIs) were carefully placed on the peritumoral T2-hyperintense regions within 1 cm surrounding the enhanced components of the tumor[13], respectively, then copied to all quantitative maps (T1, T2, PD and CBF maps). The mean values of the quantitative metrics (T1, T2, PD, and CBF) in the ROIs were measured. Student’s t-test were used to compare two groups. Receiver operating characteristic (ROC) curves and the area under the ROC curves (AUC) were established to assess the diagnostic value of parameters for discrimination.Material and Methods
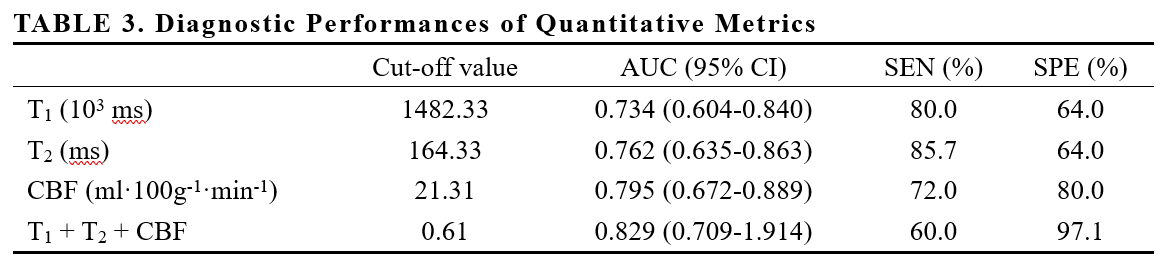
A total of 60 patients (55.1 ± 10.3 years, 25 males, 35 with HGGs and 25 with SBMs) met the eligibility criteria were enrolled in the study. Figure 1 present an overview of the characteristics of the study participants. The T1, T2, PD, and CBF of different brain tumor pathologies are shown in Table 2. The mean T1 and T2 of the HGGs in the peritumoral edema were significantly lower than those of the SBMs (all P < 0.05), while the mean CBF was significantly higher (P < 0.001). The mean PD was not significantly different between groups (P > 0.05). Figure 2 shows some typical MR images from two patients with HGGs and SBMs respectively. As shown in Table 3, CBF presented the largest AUC of 0.795 which can achieve 72% sensitivity and 80% specificity for identifying HGGs, followed by T2 (AUC = 0.762), and T1 (AUC = 0.734). When using combinations of T1, T2, and CBF, all the AUCs of the multiparametric strategies were better than those of any parameter alone.Discussion
The present study explored the clinical value of synthetic MRI-derived metrics and its combination with pCASL-derived metric in distinguishing HGGs from SBMs. As shown in the results, there were statistically significant difference in T1, T2, and CBF between HGGs and SBMs in the peritumoral edema. High T1 and T2 were present in SBMs, while low T1 and T2 were typically observed in HGGs, due to less free water and tumor cells infiltration in the peritumoral edema. Abnormally increased CBF is a sign of a leaky blood-brain barrier, and is related to the neovascularity of the tumor, which explains the reason that hyperperfusion exists in the peritumoral edema of HGGs. Ge et al.[14] reported that the multiparameter MRI model with synthetic MRI, 3D-pCASL, and DWI improves the diagnostic performance of Visually-Accessible-Rembrandt-Images scoring system which is the conventional MR image-based glioma grading system. In our study, the combination of T1, T2, and CBF was validated by a higher AUC that significantly improved the diagnostic efficiency in differentiating these two entities.Conclusion
T1, T2, and CBF have potential for differential diagnosis of HGGs and SBMs in the peritumoral edema. Combination of synthetic MRI and 3D-pCASL could offer more diagnostic information, thus improving the diagnostic performance.Acknowledgements
NoneReferences
[1] Louis DN, Perry A, Wesseling P, et al. The 2021 WHO Classification of Tumors of the Central Nervous System: a summary[J]. Neuro Oncol,2021,23(8):1231-1251.
[2] Omuro A, Deangelis LM. Glioblastoma and Other Malignant Gliomas: A Clinical Review[J]. JAMA,2013,310(17):1842-1850.
[3] Ostrom QT, Cioffi G, Waite K, et al. CBTRUS Statistical Report: Primary Brain and Other Central Nervous System Tumors Diagnosed in the United States in 2014–2018[J]. Neuro Oncol,2021,23(12 Suppl 2): iii1-iii105.
[4] Bauer AH, Erly W, Moser FG, et al. Differentiation of solitary brain metastasis from glioblastoma multiforme: a predictive multiparametric approach using combined MR diffusion and perfusion[J]. Neuroradiology,2015,57(7):697-703.
[5] Caravan I, Ciortea CA, Contis A, et al. Diagnostic value of apparent diffusion coefficient in differentiating between high-grade gliomas and brain metastases[J]. Acta Radiol,2018,59(5):599-605.
[6] Tsougos I, Svolos P, Kousi E, et al. Differentiation of glioblastoma multiforme from metastatic brain tumor using proton magnetic resonance spectroscopy, diffusion and perfusion metrics at 3 T[J]. Cancer Imaging,2012,12(3):423-436.
[7] Server A, Orheim TED, Graff BA, et al. Diagnostic examination performance by using microvascular leakage, cerebral blood volume, and blood flow derived from 3-T dynamic susceptibility-weighted contrast-enhanced perfusion MR imaging in the differentiation of glioblastoma multiforme and brain metastasis[J]. Neuroradiology,2011,53(5):319-330.
[8] Claes A, Idema AJ, Wesseling P. Diffuse glioma growth: a guerilla war[J]. Acta Neuropathol,2007,114(5):443-458.
[9] Holly KS, Barker BJ, Murcia D, et al. High-grade Gliomas Exhibit Higher Peritumoral Fractional Anisotropy and Lower Mean Diffusivity than Intracranial Metastases[J]. Front Surg,2017,4:18.
[10] Kim MS, Park SH, Park ES, et al. Quantitative analysis in peritumoral volumes of brain metastases treated with stereotactic radiotherapy[J]. J Neuroradiology,2018,45(5):310-315.
[11] Fujita S, Hagiwara A, Aoki S, et al. Synthetic MRI and MR fingerprinting in routine neuroimaging protocol: What's the next step?[J]. J Neuroradiology,2020,47(2):134-135.
[12] Warntjes JBM, Leinhard OD, West J, et al. Rapid magnetic resonance quantification on the brain: Optimization for clinical usage[J]. Magn Reson Med,2008,60(2):320-329.
[13] Weber MA, Zoubaa S, Schlieter M, et al. Diagnostic performance of spectroscopic and perfusion MRI for distinction of brain tumors[J]. Neurology,2006,66(12):1899-1906.
[14] Ge X, Wang M, Ma H, et al. Investigated diagnostic value of synthetic relaxometry, three-dimensional pseudo-continuous arterial spin labelling and diffusion-weighted imaging in the grading of glioma[J]. Magn Reson Imaging,2022,86:20-27.
Figures