1577
7T metabolic MRI in three types of diffuse glioma1Department of Radiology and Nuclear Medicine, University Medical Center Utrecht, Utrecht, Netherlands, 2UMC Utrecht Brain Center, Department of Neurology and Neurosurgery, University Medical Center Utrecht, Utrecht, Netherlands, 3Department of Pathology, University Medical Center Utrecht, Utrecht, Netherlands, 4Department of Pathology, Amsterdam University Medical Center, location AMC, Amsterdam, Netherlands, 5Stichting Epilepsie Instellingen Nederland (SEIN), Heemstede, Netherlands, 6Department of Medical Imaging, Radboud University Medical Center, Nijmegen, Netherlands
Synopsis
Keywords: Tumors, Tissue Characterization
We combined metabolic magnetic resonance imaging (MRI) sequences at 7 Tesla (7T) to characterize glioma tissue and discover metabolic MRI profiles that could help delineate the extent of disease spread and determine molecular tumor subtypes preoperatively. Here we show the first preliminary results of three different diffuse glioma subtypes imaged with 1H MR spectroscopy (MRS), 31P 3D chemical shift imaging (CSI), glutamate chemical exchange saturation transfer (GluCEST) and quantitative susceptibility mapping (QSM).Conventional magnetic resonance imaging (MRI) has been established as one of the main pillars of neuroimaging. However, in case of diffuse glioma, it is limited in delineating the extent of invasion of tumor cells within the brain parenchyma. In addition, it is usually not specific enough to provide a definitive diagnosis of the diffuse glioma subtype with the same certainty as histopathological analysis, necessary to establish the most efficient treatment strategy.
Diffuse gliomas are characterized by specific dysregulated metabolic pathways. For instance, increased metabolic production of 2-hydroxyglutarate (2HG) due to the isocitrate dehydrogenase (IDH) mutation is very characteristic for certain subtypes. While studies have tried to probe the metabolic profile of diffuse gliomas with metabolic sequences like MR spectroscopy (MRS), many were performed at clinical field strengths (up to 3T) that are known for their relatively low spectral resolution or focused on only one metabolic MRI technique.
In this ongoing clinical trial we aim to combine several metabolic MRI sequences at 7 tesla (7T): single voxel (SV) 1H-MRS, 31P 3D chemical shift imaging (CSI), glutamate chemical exchange saturation transfer (GluCEST) and quantitative susceptibility mapping (QSM) – to characterize glioma tissue, and discover metabolic MRI profiles that could help delineate the extent of disease spread and determine molecular subtypes preoperatively.
Methods
Three patients (aged 19, 54 and 59 years; one female) with suspected diffuse glioma and scheduled for surgical resection were included; final diagnosis was based on histopathology. This clinical trial was approved by the IRB of our institution; all patients gave written informed consent.
MRI examination
All patients underwent one preoperative 7T MRI examination with a 32-channel receive and 8-channel transmit head coil (Nova Medical, Wilmington (MA), USA) including single voxel (SV) 1H-MRS optimized to detect 2HG (sLASER, TE 110 ms, TR 5000 ms, NSA 64), QSM and GluCEST (28 offsets, B1 4.9 uT, TR 5000 ms, FOV 200x240x30 mm) in addition to structural imaging. Patients were removed from the scanner and repositioned to obtain 31P 3D pulse-acquire CSI (FA 11°, TR 100 ms, TE 0.46 ms; 20x20x20 mm voxels; FOV 220x220x180 mm, hamming weighted acquistion) using a home-built quadrature TxRx 1H/31P headcoil.
Post processing & data analysis
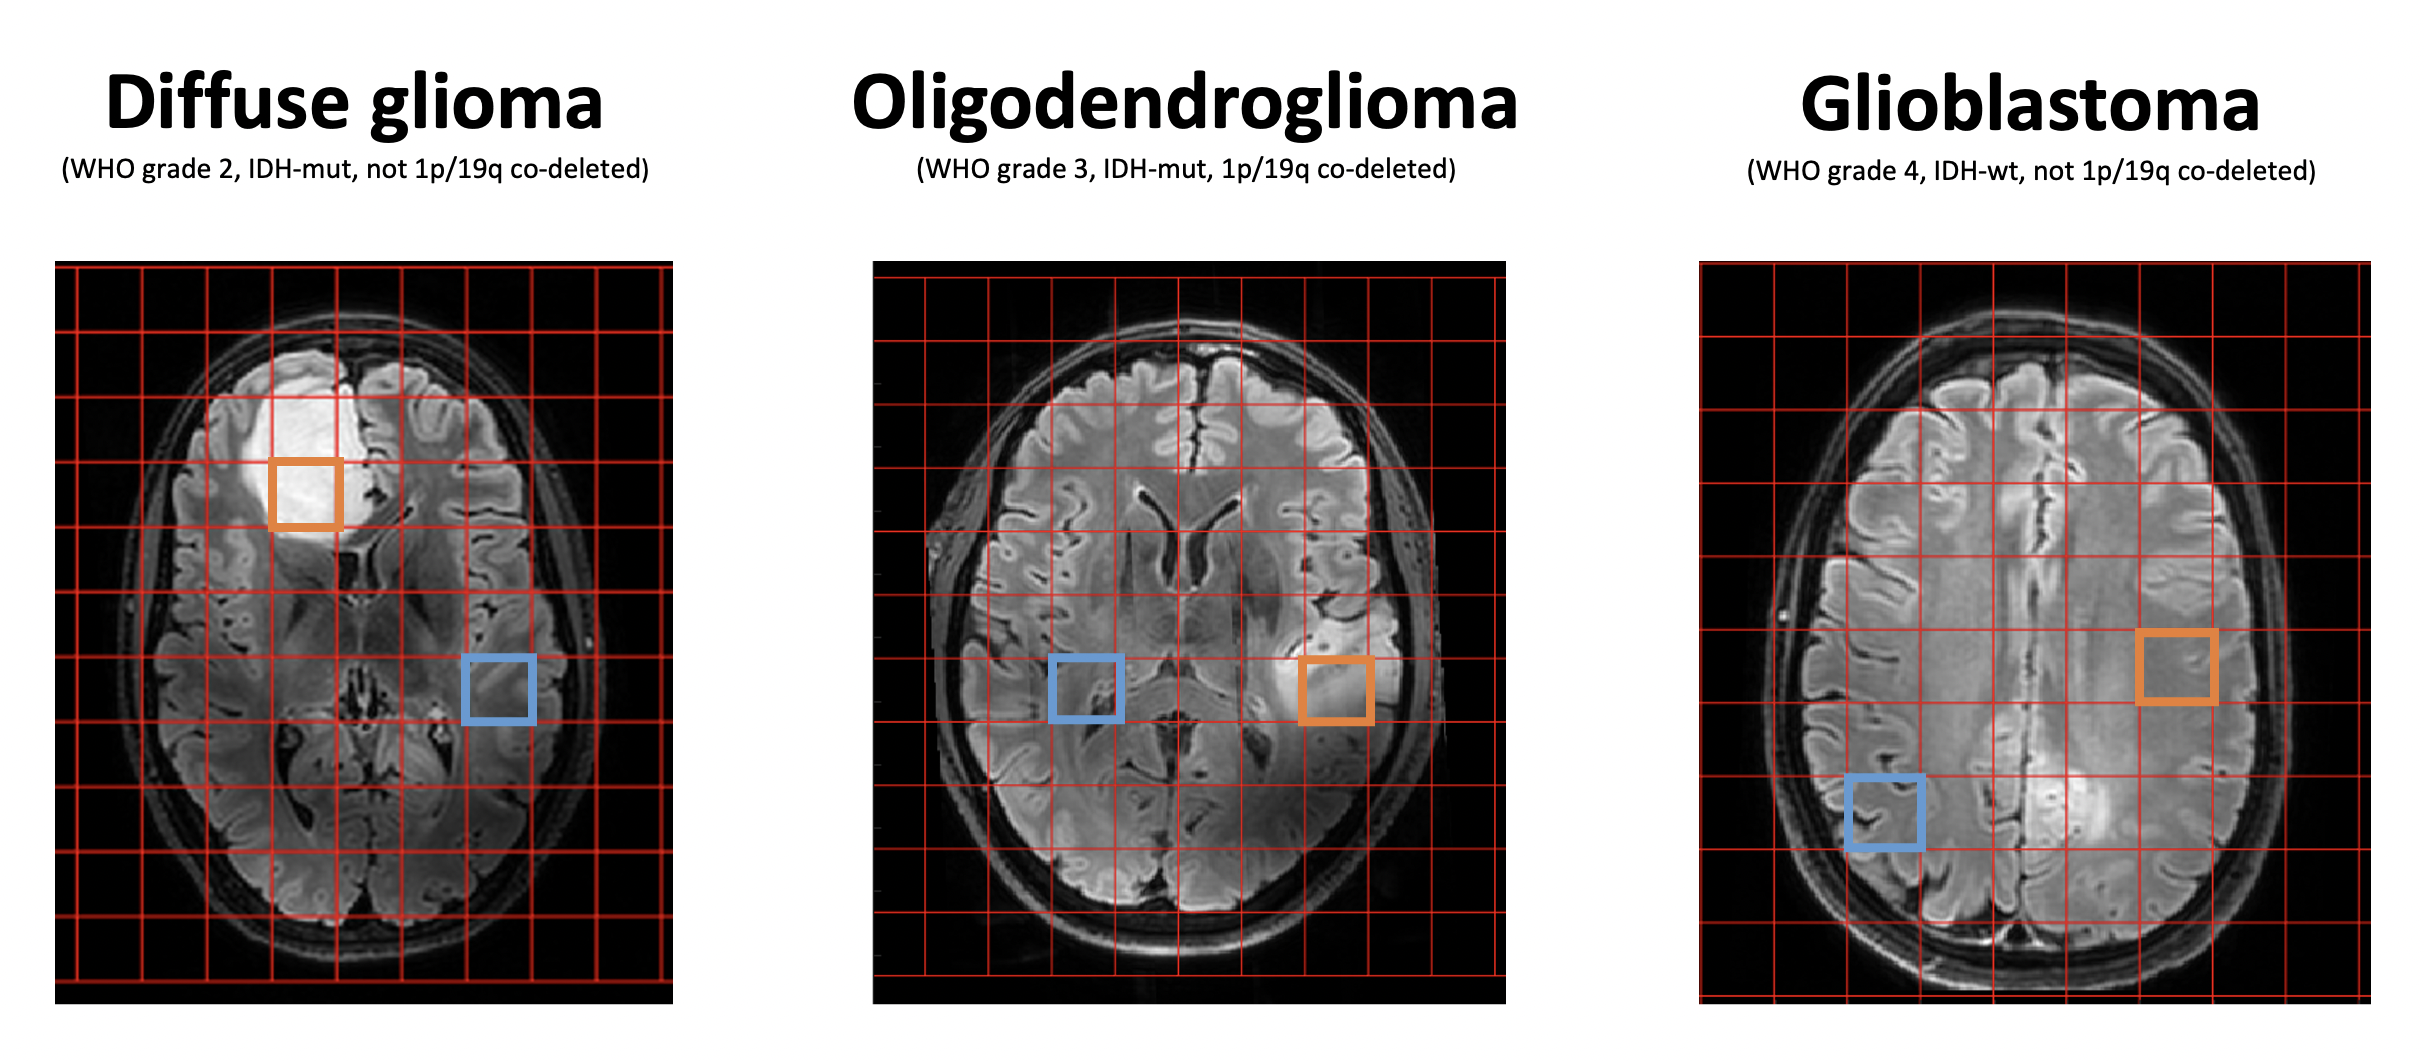
MRS data was analyzed using LCModel with a simulated basis set.1 QSM data was post-processed with the SEPIA tool to compute the susceptibility maps (inclusing Laplacian-based phase unwrapping, variable-kernel SHARP background field removal and the iLSQR)2 GluCEST data was post-processed and analyzed using custom-written scripts in MATLAB (MathWorks, USA). The GluCEST contrast maps were generated by calculating the magnetization transfer ratio (MTRasym), defined by the following equation MTRasym=S(−3ppm)−S(+3ppm)/S0.3 All images were assessed visually and compared between patients. A registration pipeline was created in Elastix to project the 31P-CSI grid on the FLAIR image, to select a voxel containing most tumor tissue (Figure 1).
Results
Patient A was diagnosed with a low-grade diffuse glioma (WHO grade 2, IDH mutant, not 1p/19q co-deleted), patient B with an anaplastic oligodendroglioma (WHO grade 3, IDH mutant, 1p/19q co-deleted), and patient C with a glioblastoma (WHO grade 4, IDH wildtype, not 1p/19q co-deleted).
1H-MRS
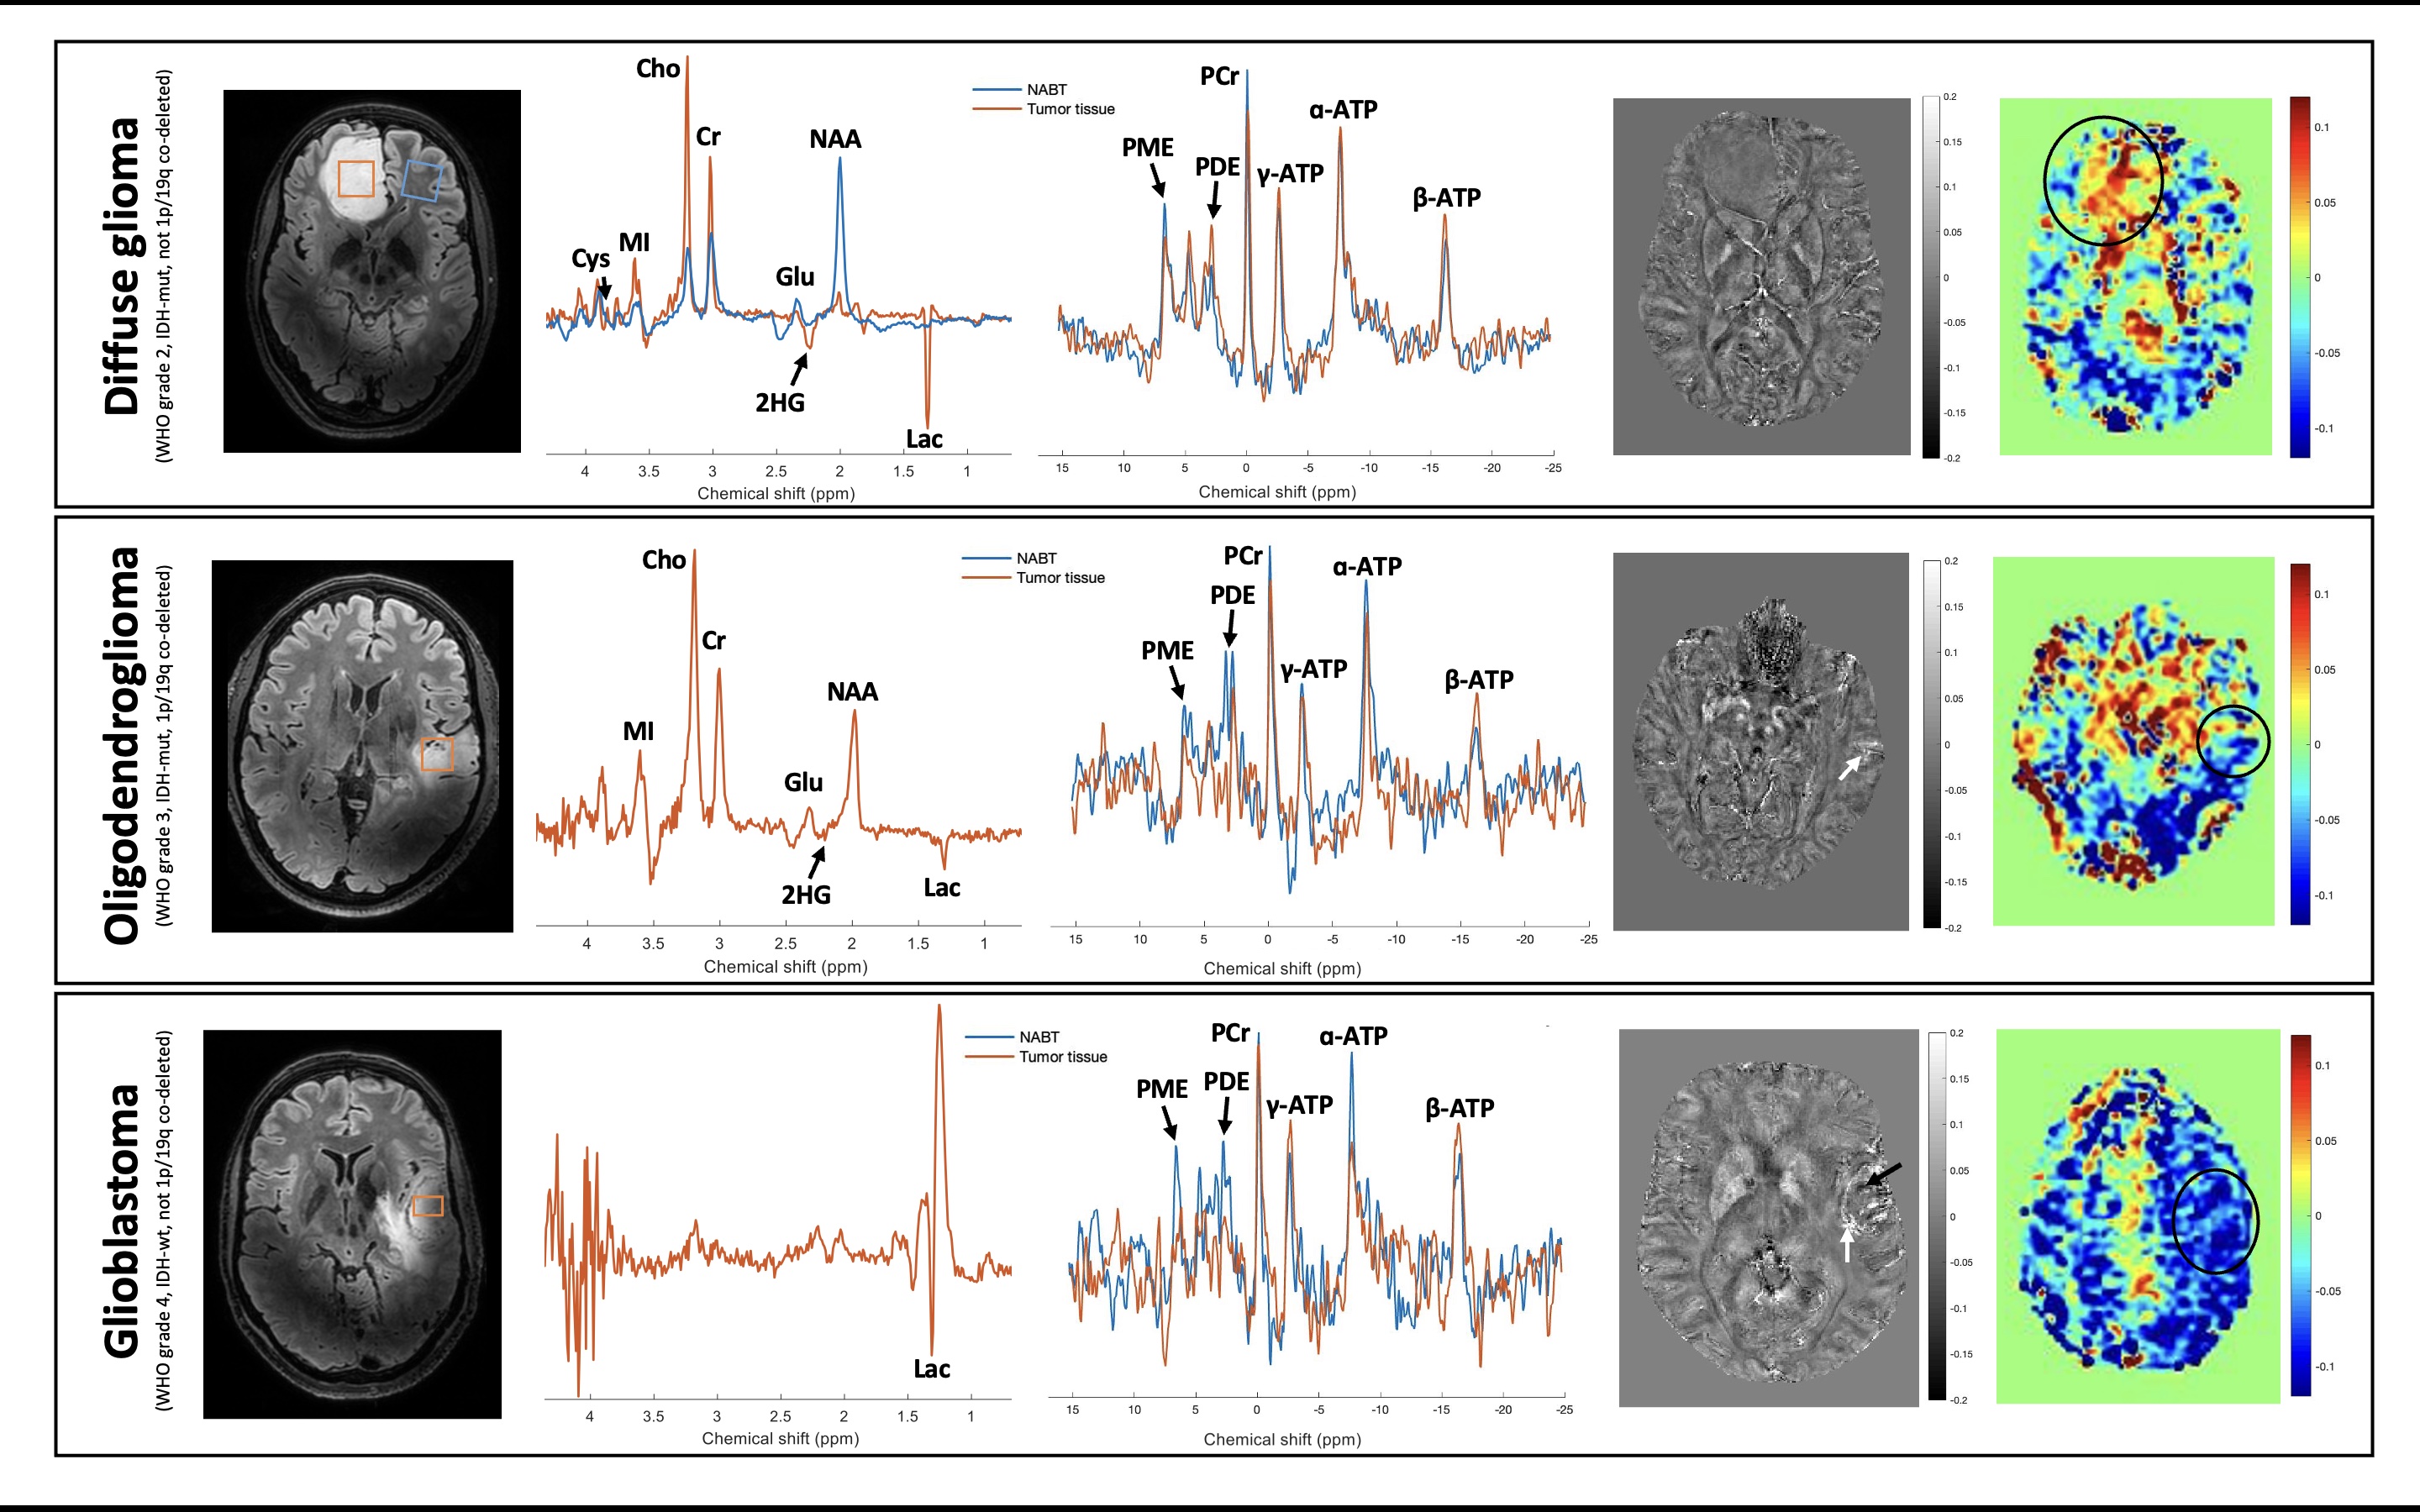
Proton spectra showed almost only lactate (Lac) in the glioblastoma (most likely due to the Warburg effect). The diffuse glioma and oligodendroglioma showed similar profiles but with some differences: both showed the presence of 2HG, increased choline (Cho), creatine (Cr), myo-inositol (MI) and Lac levels and decreased n-acetyl aspartate (NAA) and Glu compared to normal-appearing brain tissue (NABT) of patient A. The oligodendroglioma, however, showed higher NAA levels compared to the diffuse glioma, possibly due to partial volume effect, and Glu, and less 2HG and Lac compared to the diffuse glioma. Notably, the oligodendroglioma, with 1p/19q-co-deletion, showed no cystathionine (Cys), whilst the diffuse glioma with no 1p/19q-co-deletion did (Figure 2).
GluCEST
Glutamate weighted maps showed more Glu compared to NABT for the diffuse glioma and no difference with NABT for the oligodendroglioma. Less Glu was seen for the glioblastoma. (Figure 2).
31P-CSI
31P spectra showed no increased phosphomonoesters to phosphodiesters (PME/PDE) ratio, often seen in tumors, in all three diffuse gliomas, however it showed in in the NABT of patient A. ATP levels were somewhat reduced, but almost similar in both the diffuse glioma and oligodendroglioma which combined with high (P)Cr levels seen in both the SV 1H-MRS and the 31P-CSI spectra is indicative of inefficient energy turnover (Figure 1,2).
QSM
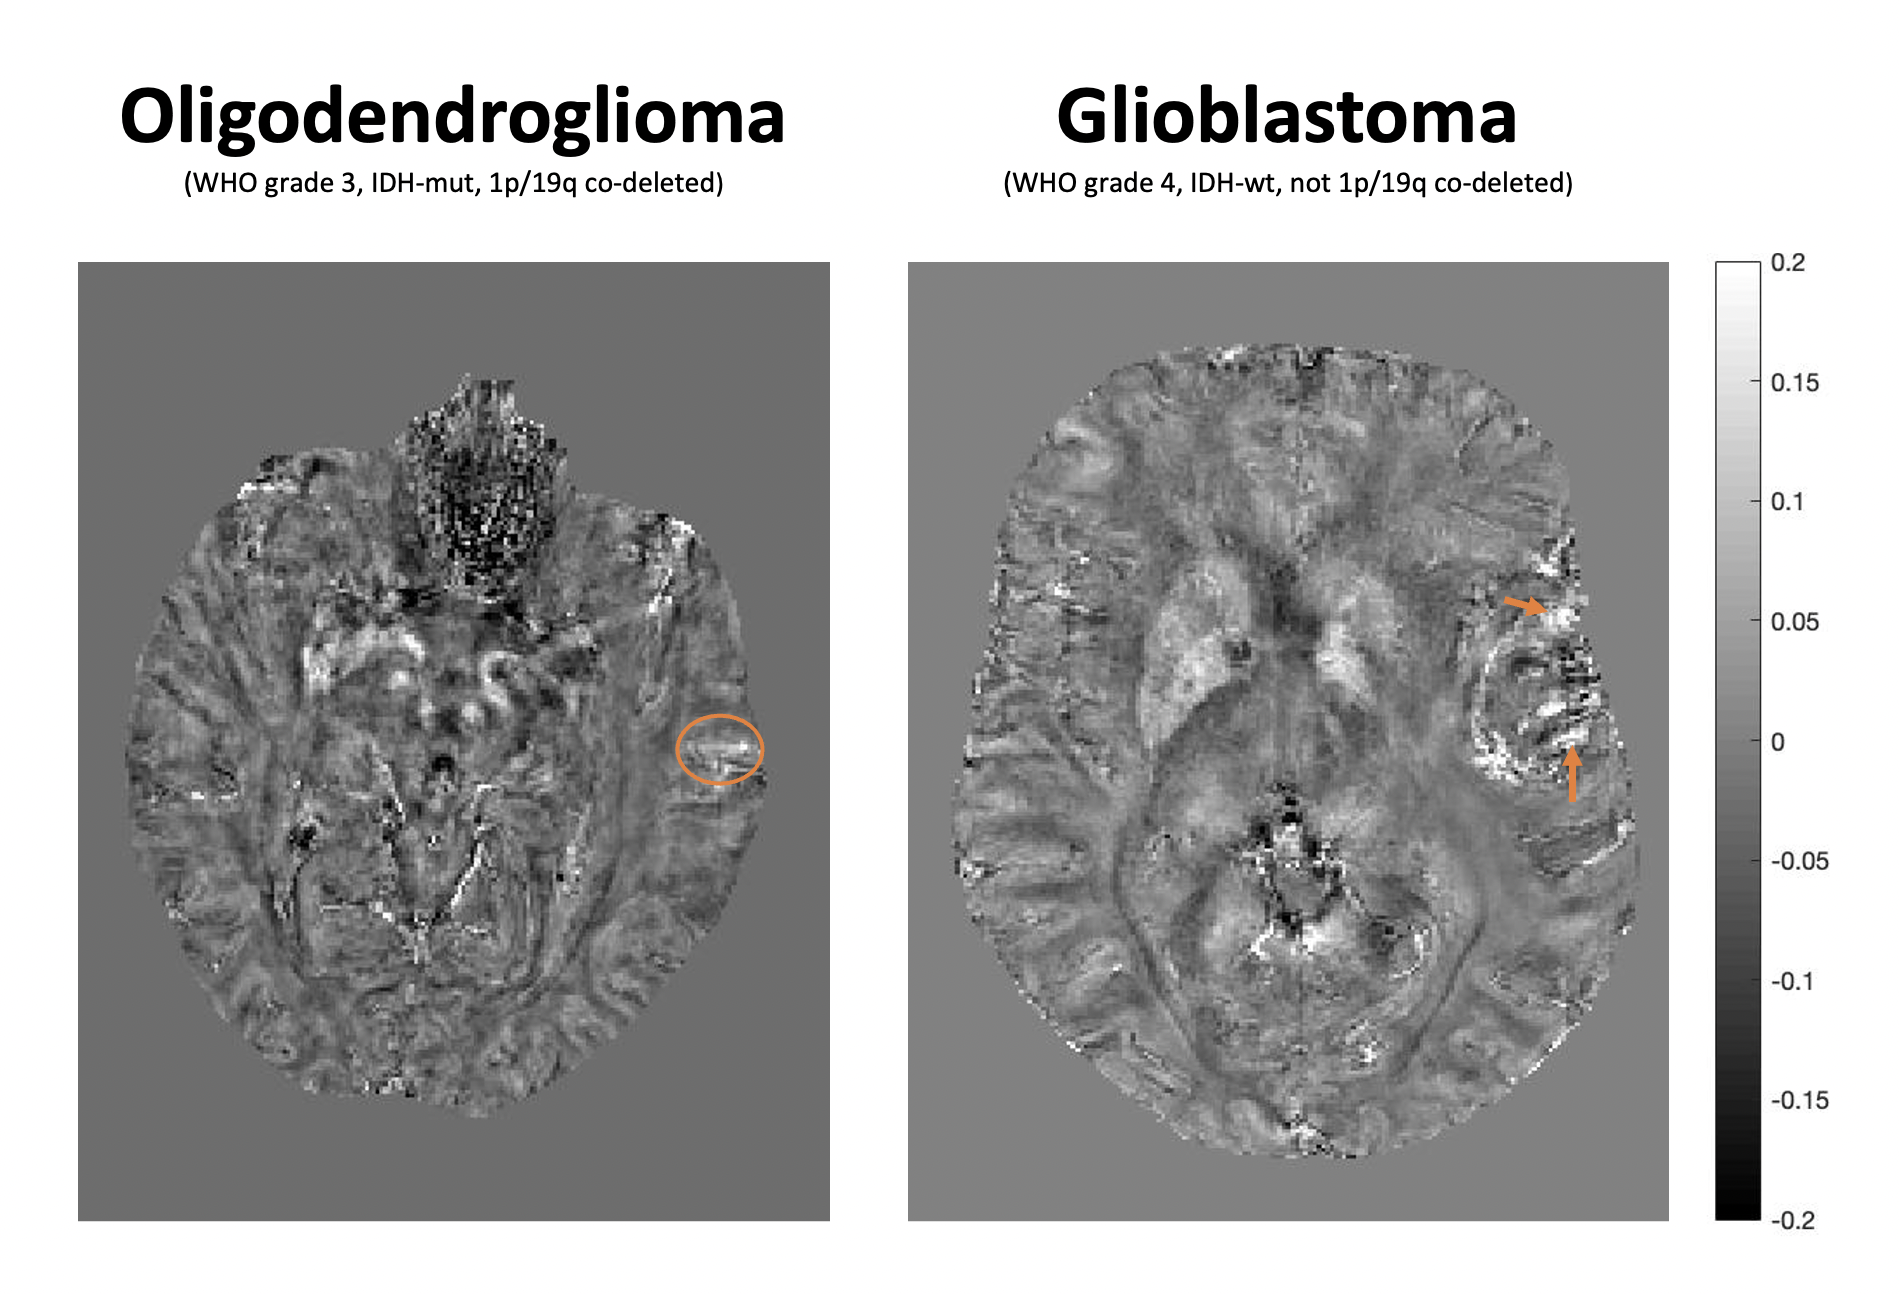
QSM maps showed both areas of positive, possibly indicating iron-loaden microglia and macrophages, and areas of negative susceptibility in the glioblastoma, some areas with positive susceptibility, possibly indicating venous tumor vasculature, in the oligodendroglioma and none in the diffuse glioma (Figure 2,3).
Discussion
We successfully obtained preliminary data on the metabolic profile of three different types of diffuse glioma using a combination of SV 1H-MRS, 31P-CSI, GluCEST and QSM at 7T. All three tumors showed a different metabolic profile with some interesting inconsistencies within our own data as well as compared to literature.4 First, the oligodendroglioma, defined by its 1p/19q-codeletion that causes accumulation of Cys, contradictorily showed no Cys while the diffuse glioma without 1p/19q-co-deletion did. Second, we saw no increased PME/PDE ratio in all three tumors, as expected, but in NABT.
Acknowledgements
No acknowledgement found.References
1. Shams Z, van der Kemp WJM, Emir U, et al. Comparison of 2-Hydroxyglutarate Detection With sLASER and MEGA-sLASER at 7T. Front Neurol. 2021 Sep 7;12:7184233.
2. Chan KS, Marques JP. SEPIA-Susceptibility mapping pipeline tool for phase images. Neuroimage. 2021 Feb 15;227:117611. doi: 10.1016/j.neuroimage.2020.117611. Epub 2020 Dec 10. PMID: 33309901.
3. H. Wei, R. Dibb, Y. Zhou, Y. Sun, J. Xu, N. Wang, C. LiuStreaking artifact reduction for quantitative susceptibility mapping of sources with large dynamic rangeNMR Biomed., 28 (2015), pp. 1294-1303https://doi.org/10.1002/nbm.3383
4. Cai K., Haris M., Singh A., Kogan F., Greenberg J. H., Hariharan H., et al. (2012). Magnetic resonance imaging of glutamate. Nat. Med. 18 302–306. 10.1038/nm.2615
5. Branzoli F, Pontoizeau C, Tchara L, et al. Cystathionine as a marker for 1p/19q codeleted gliomas by in vivo magnetic resonance spectroscopy. Neuro Oncol. 2019;21(6):765-774. doi:10.1093/neuonc/noz031
Figures