1575
High b-value diffusion-weighted imaging of glioblastoma on an MR-Linac1Physical Sciences, Sunnybrook Research Institute, Toronto, ON, Canada, 2Department of Radiation Oncology, Sunnybrook Health Sciences Centre, Toronto, ON, Canada, 3Medical Imaging, Sunnybrook Health Sciences Centre, Toronto, ON, Canada, 4Division of Neurology, Department of Medicine, Sunnybrook Health Sciences Centre, Toronto, ON, Canada, 5Department of Surgery, St. Michael's Hospital, Toronto, ON, Canada, 6Department of Neurosurgery and Paediatric Neurosurgery, Medical University, Lublin, Poland
Synopsis
Keywords: Tumors, Radiotherapy
Hyperintense regions on high b-value DWI (HRDs) may reflect hypercellular tumour and are of interest for radiotherapy dose escalation. However, the extent to which diffusion restriction versus prolonged T2 creates these hyperintensities is not known. Additionally, the dynamics of HRDs during radiotherapy are not fully characterized. In 35 glioblastoma patients treated on a 1.5T MR-Linac, we found HRDs shrank during treatment and extended beyond the gross tumour volume. Apparent diffusion coefficient was reduced and T2 was elevated in HRD compared to the remainder of the clinical target volume, implying that both diffusion restriction and prolonged relaxation are responsible for HRDs.Introduction
In glioblastoma (GBM), contrast-enhanced T1-weighted imaging is generally used to identify the gross tumour extent. However, non-enhancing tumour can have cell densities similar to enhancing tumour1 and should be included in treatment planning. Previous literature suggests that hypercellular tumours are detectable as hyperintense regions on high b-value DWI (HRDs)2–5; hence, HRDs are being incorporated into planning for dose escalated radiotherapy.6,7 However, hyperintensities can result from elongated transverse relaxation times8,9 due to free water in tumour10 rather than high cellularity. Also, knowledge of HRD dynamics is limited so the potential importance of radiotherapy target adaptation is not fully known. We characterized changes in HRDs during radiotherapy from weekly imaging on a 1.5T MR-Linac and additionally analyzed apparent diffusion coefficient (ADC) and T2 maps determine the source of hyperintensities on DWI.Methods
Patients and scanning: Thirty-five patients with GBM were treated on a 1.5T Elekta Unity MR-Linac (60 Gy/30 fractions or 54/30 or 40/15). High b-value DWI EPI (“DWI2000”) was acquired weekly (TR/TE=4300/96 ms, voxel size=4.7×6.5×5.0 mm3, FOV=300×245×155 mm3, b-values=0,200,500,2000 s/mm2). Signal-to-noise ratios (SNR) were estimated from single-average scans and a “noise” scan (flip angle=1°, b=1000 s/mm2). T2 maps were acquired weekly, on a different day from DWI2000 (multi-echo spin-echo, TR/TE0/ΔTE=3000/20/20, echoes=10, voxel size=2.9×3.1×3.0 mm3, FOV=200×200×39 mm3).Registration and segmentation: The DWI, T1-weighted images, and treatment planning GTV (gross tumour volume) and CTV (clinical target volume) were aligned to the earliest T1-weighted image by rigid registration using ANTs11 and FSL FLIRT.12–14 The aligned T1-weighted images were segmented with Atropos15 to create white matter and cerebrospinal fluid (CSF) masks.
Parameter mapping: ADC maps were computed from the DWI by linear least-squares fitting to the log signal for b-values of 0 and 2000 s/mm2. T2 maps were calculated from the multi-echo sequences by monoexponential fitting to the log signal as a function of echo time, using even echoes only.16
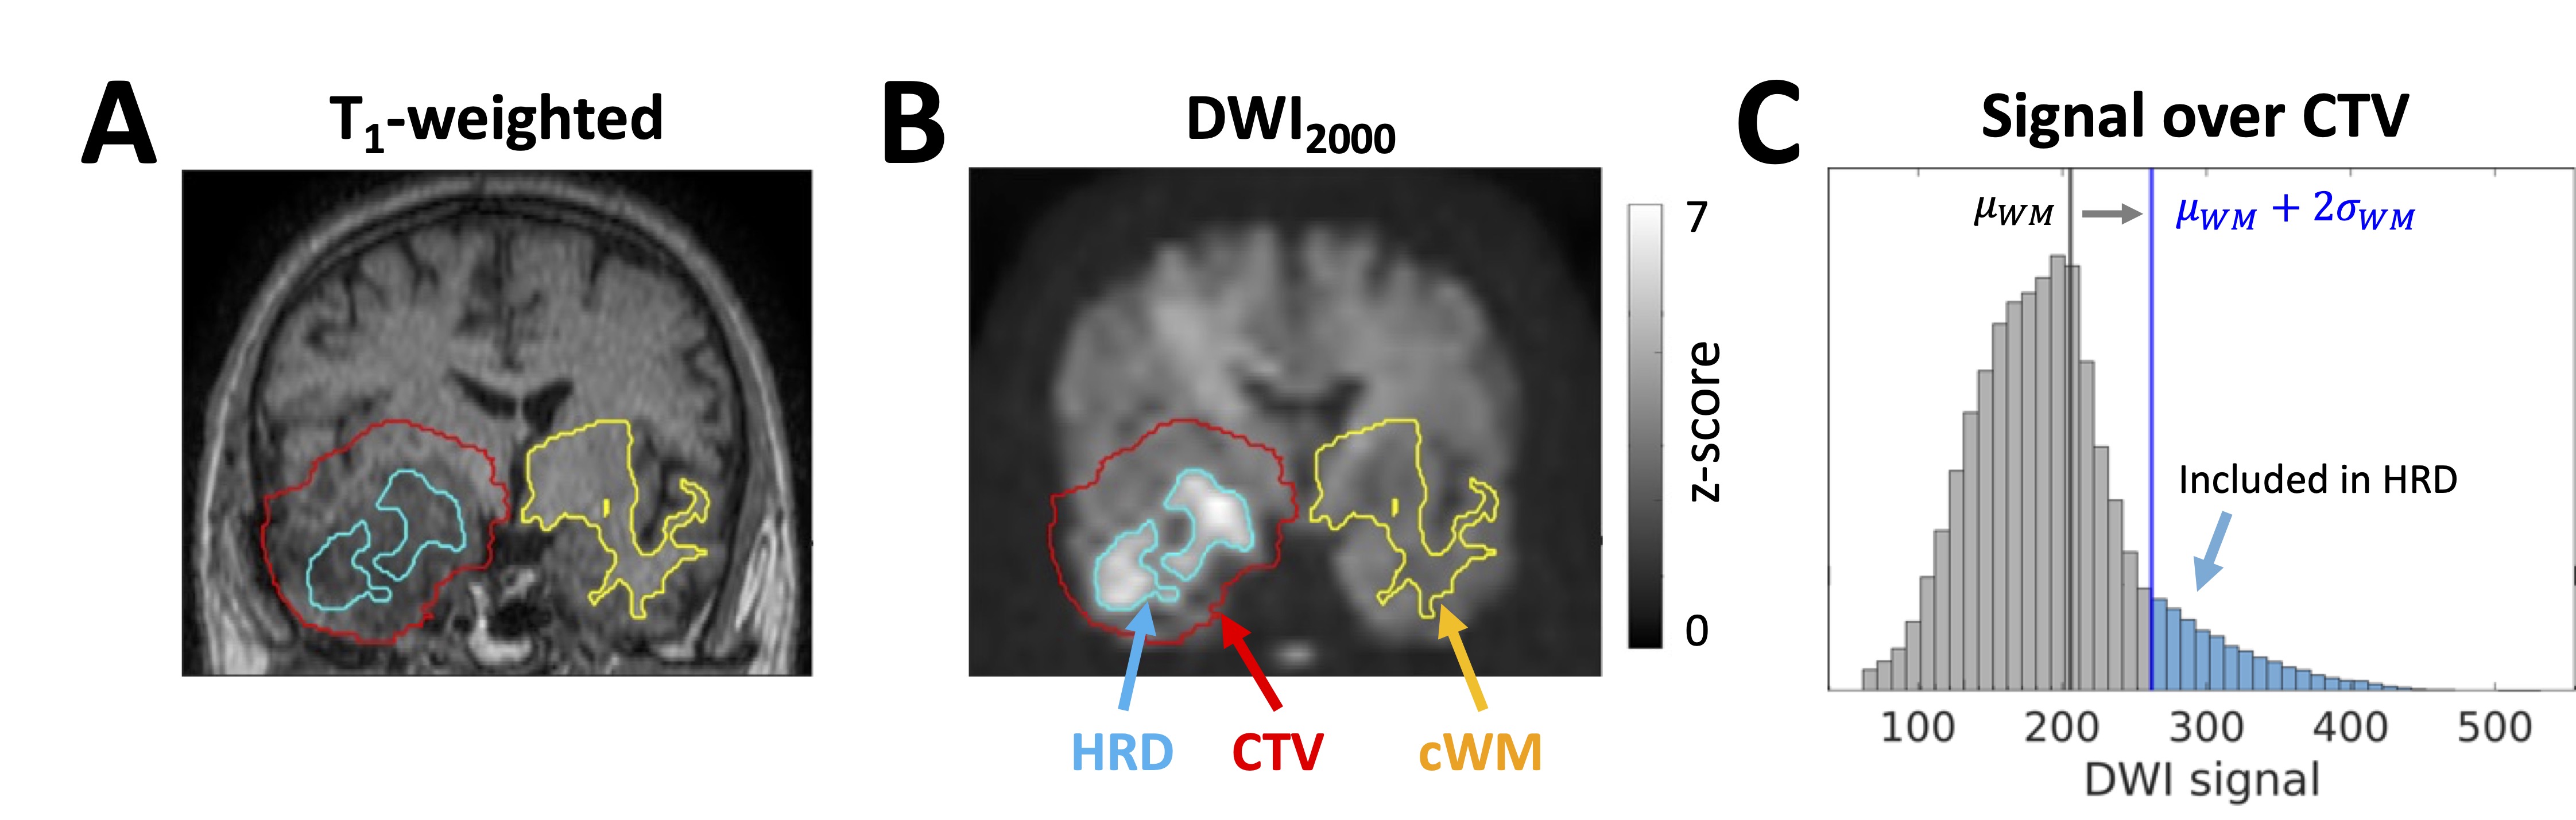
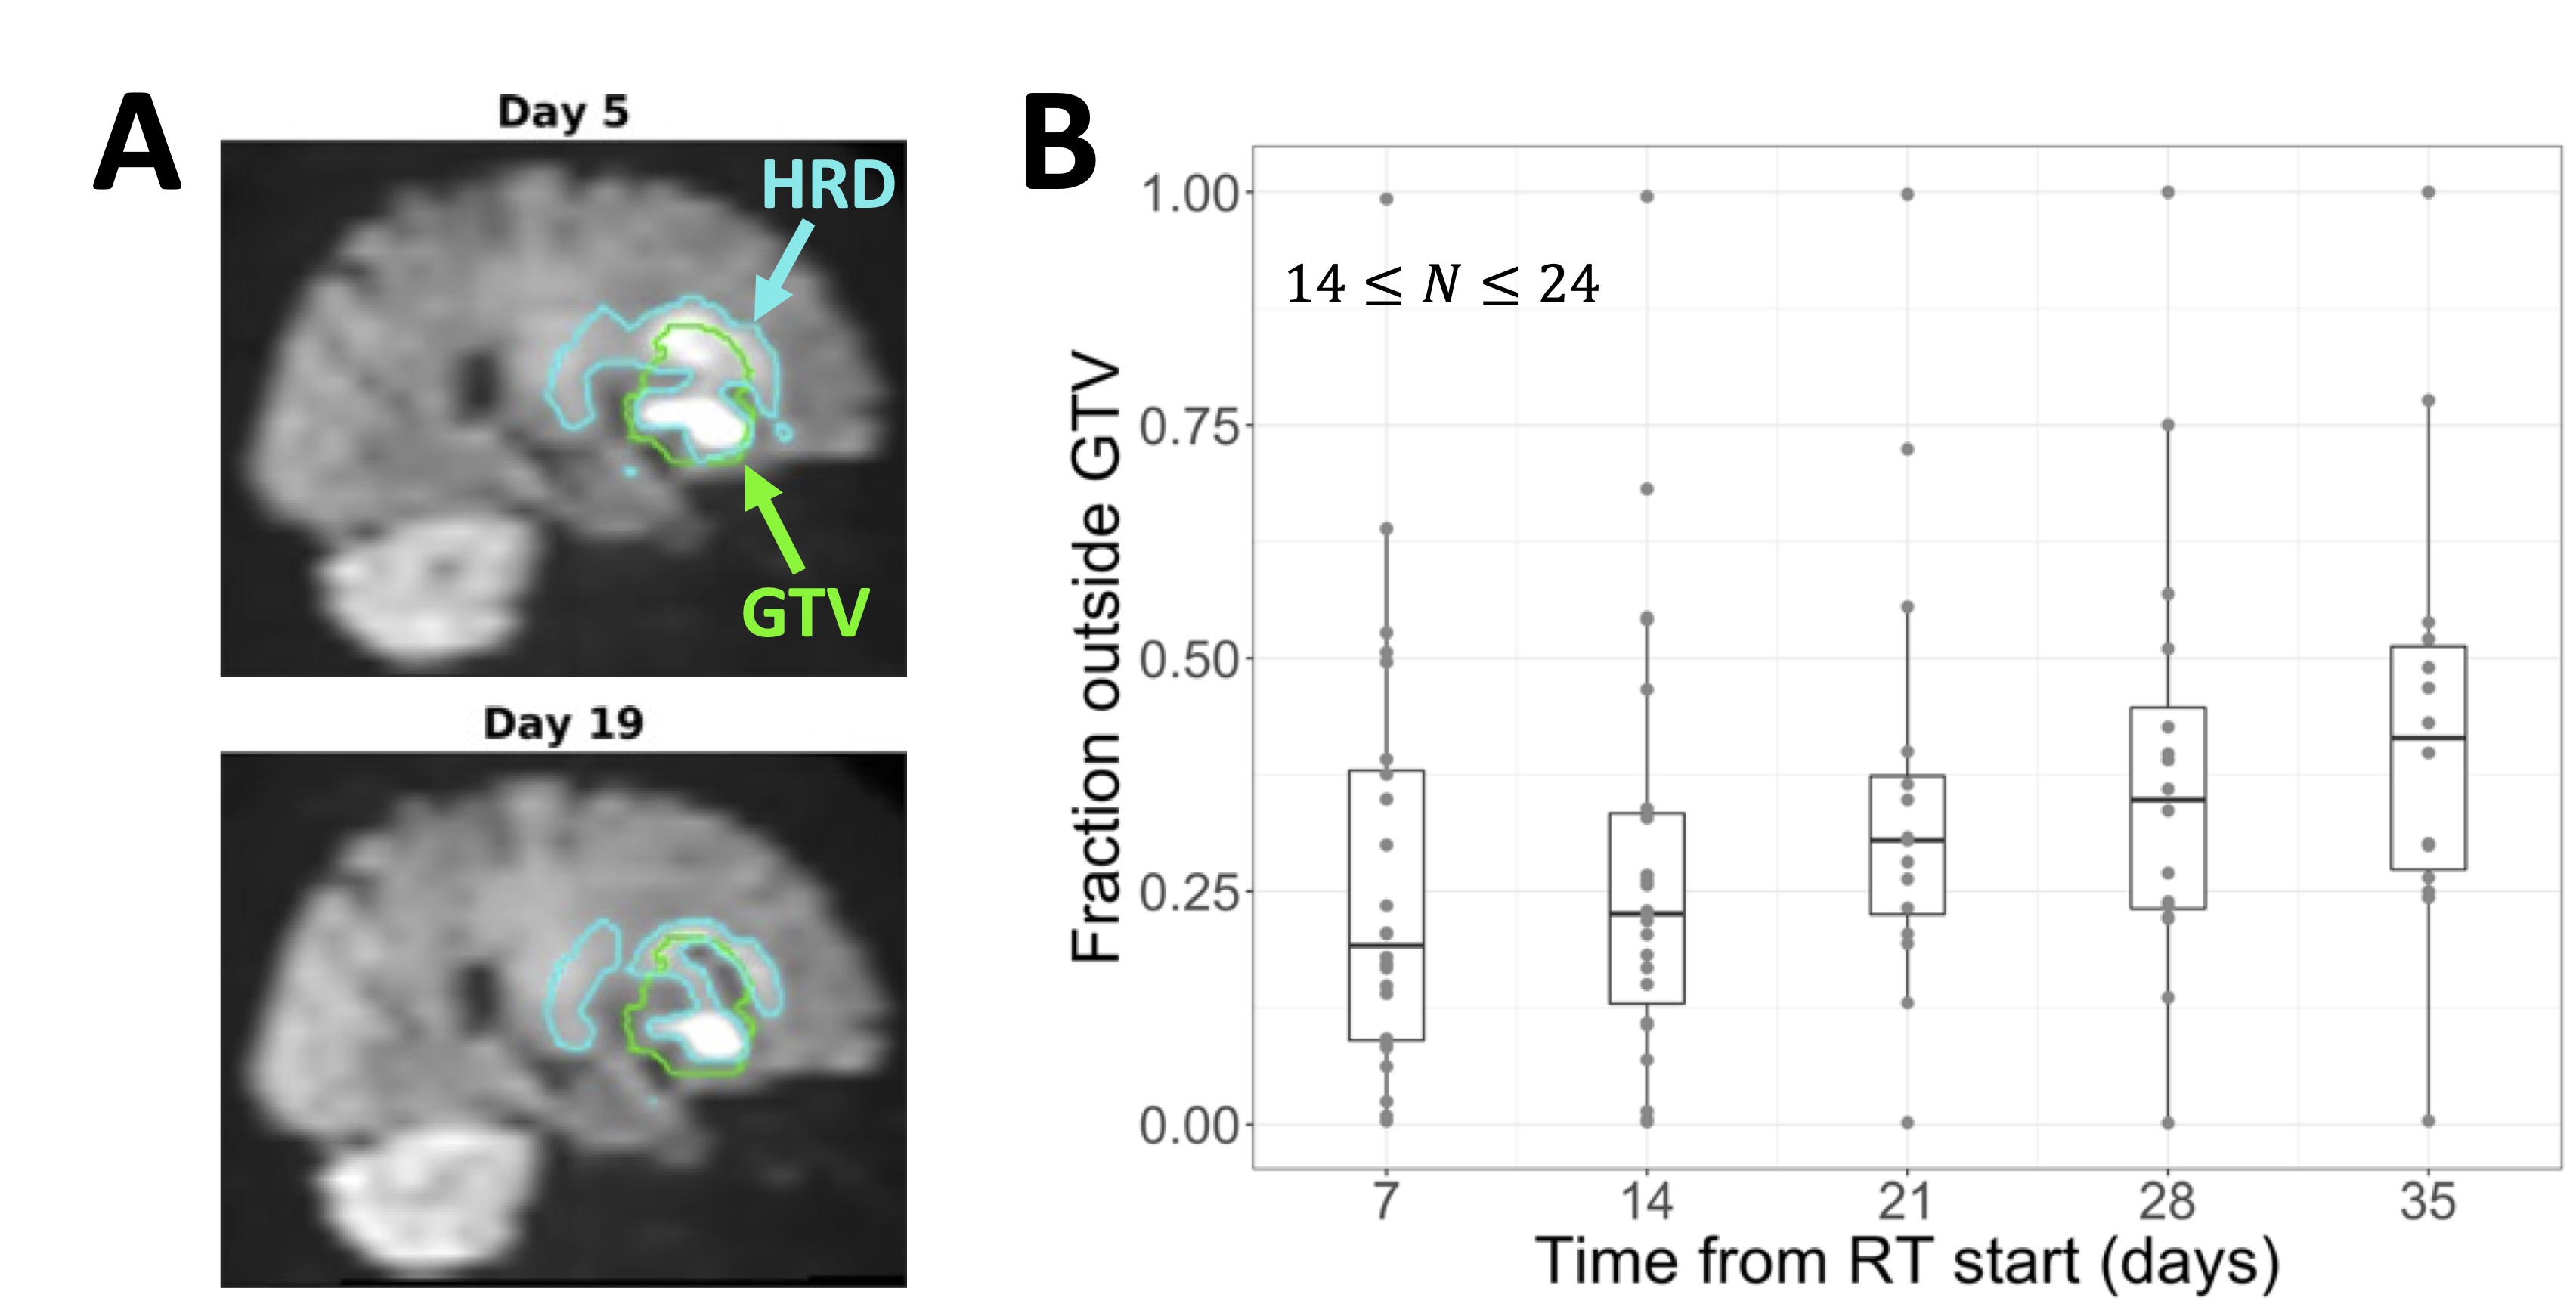
Hyperintense regions on DWI: The CTV was reflected through the midsagittal plane and intersected with white matter to create a contralateral white matter (cWM) region. The hyperintense region on b=2000 s/mm2 DWI (HRD) was defined as the set of voxels in the CTV satisfying $$$S > \mu_{WM} + 2\sigma_{WM}$$$, where $$$S$$$ is the voxel signal intensity and $$$\mu_{WM}$$$ and $$$\sigma_{WM}$$$ are the mean and standard deviation in cWM5 (Figure 1). For parameter comparison, a “CTV-HRD” region was defined as the CTV excluding the HRD and CSF.
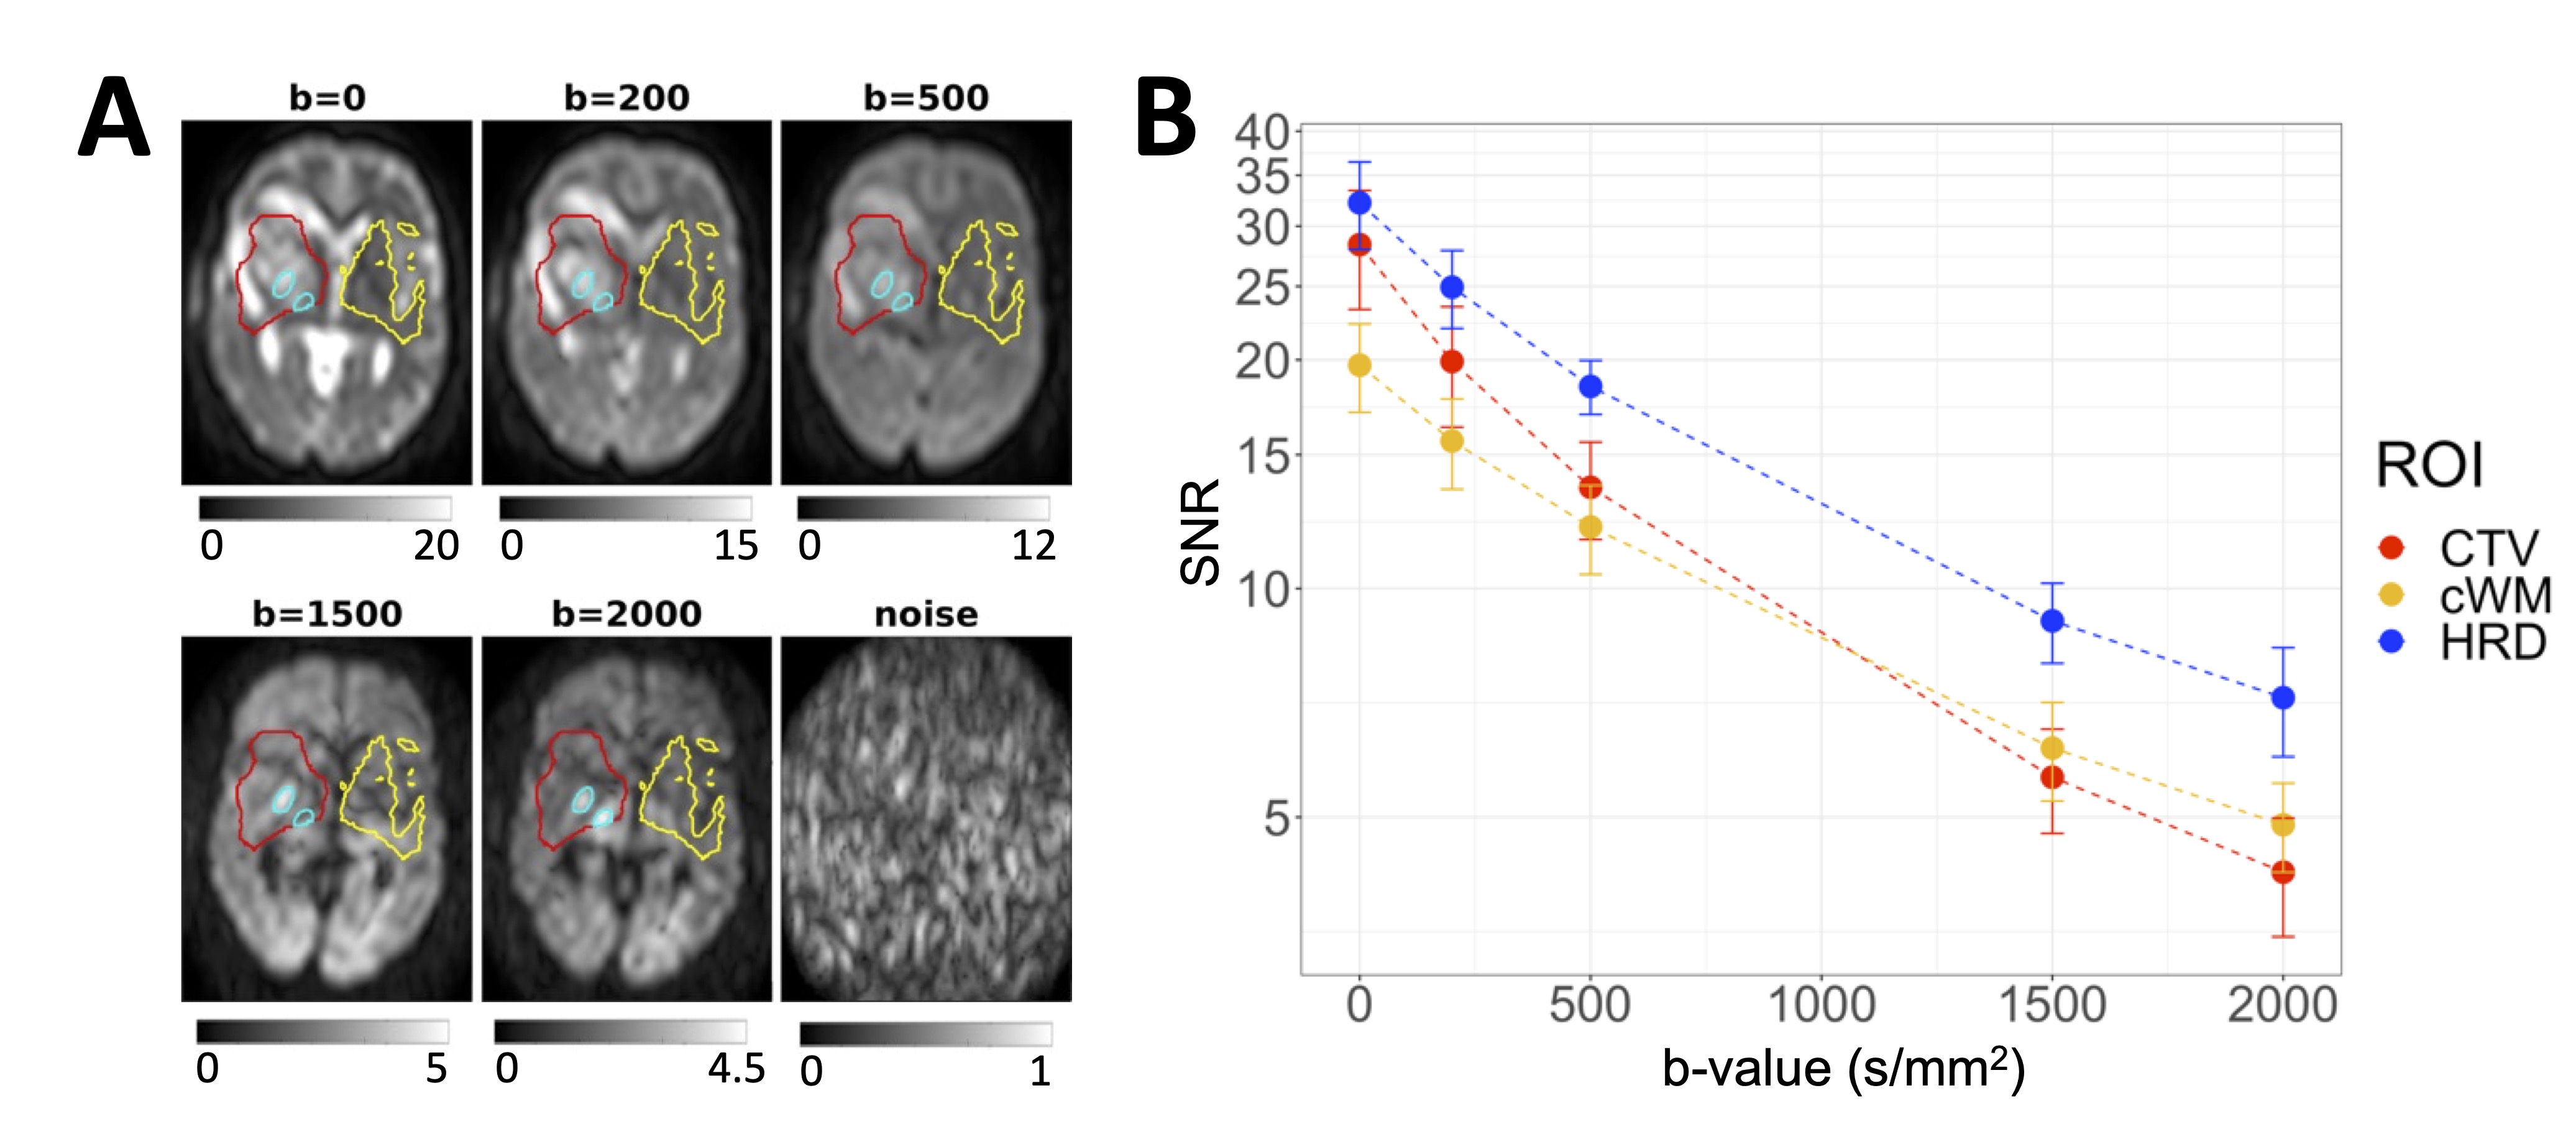
Signal-to-noise ratio: The SNR was calculated as $$$m_{sig}/m_{noise}$$$, where $$$m_{sig}$$$ and $$$m_{noise}$$$ are the means of the signal and noise scans over each region, respectively.17
Statistics: The median ADC and T2 over the HRD, cWM, and CTV-HRD were computed at the first DWI2000 day for each patient ("first-DWI") and compared between regions using a linear mixed effects model with region as a fixed effect and subject as a random effect. P-values less than .05 were deemed significant. To evaluate HRD changes, certain patients were excluded (first-DWI > 14 days after beginning RT or first-DWI HRD volume < 1 cm3). HRD volume changes were computed as $$$(V-V_0)/V_0$$$, where $$$V$$$ is the volume on a given day and $$$V_0$$$ is the volume at first-DWI. The fraction of the HRD outside of the GTV was computed as $$$1-|HRD \cap GTV|/|HRD|$$$. Values were interpolated to common timepoints at weekly intervals (days 7, 14, …, 35).
Results
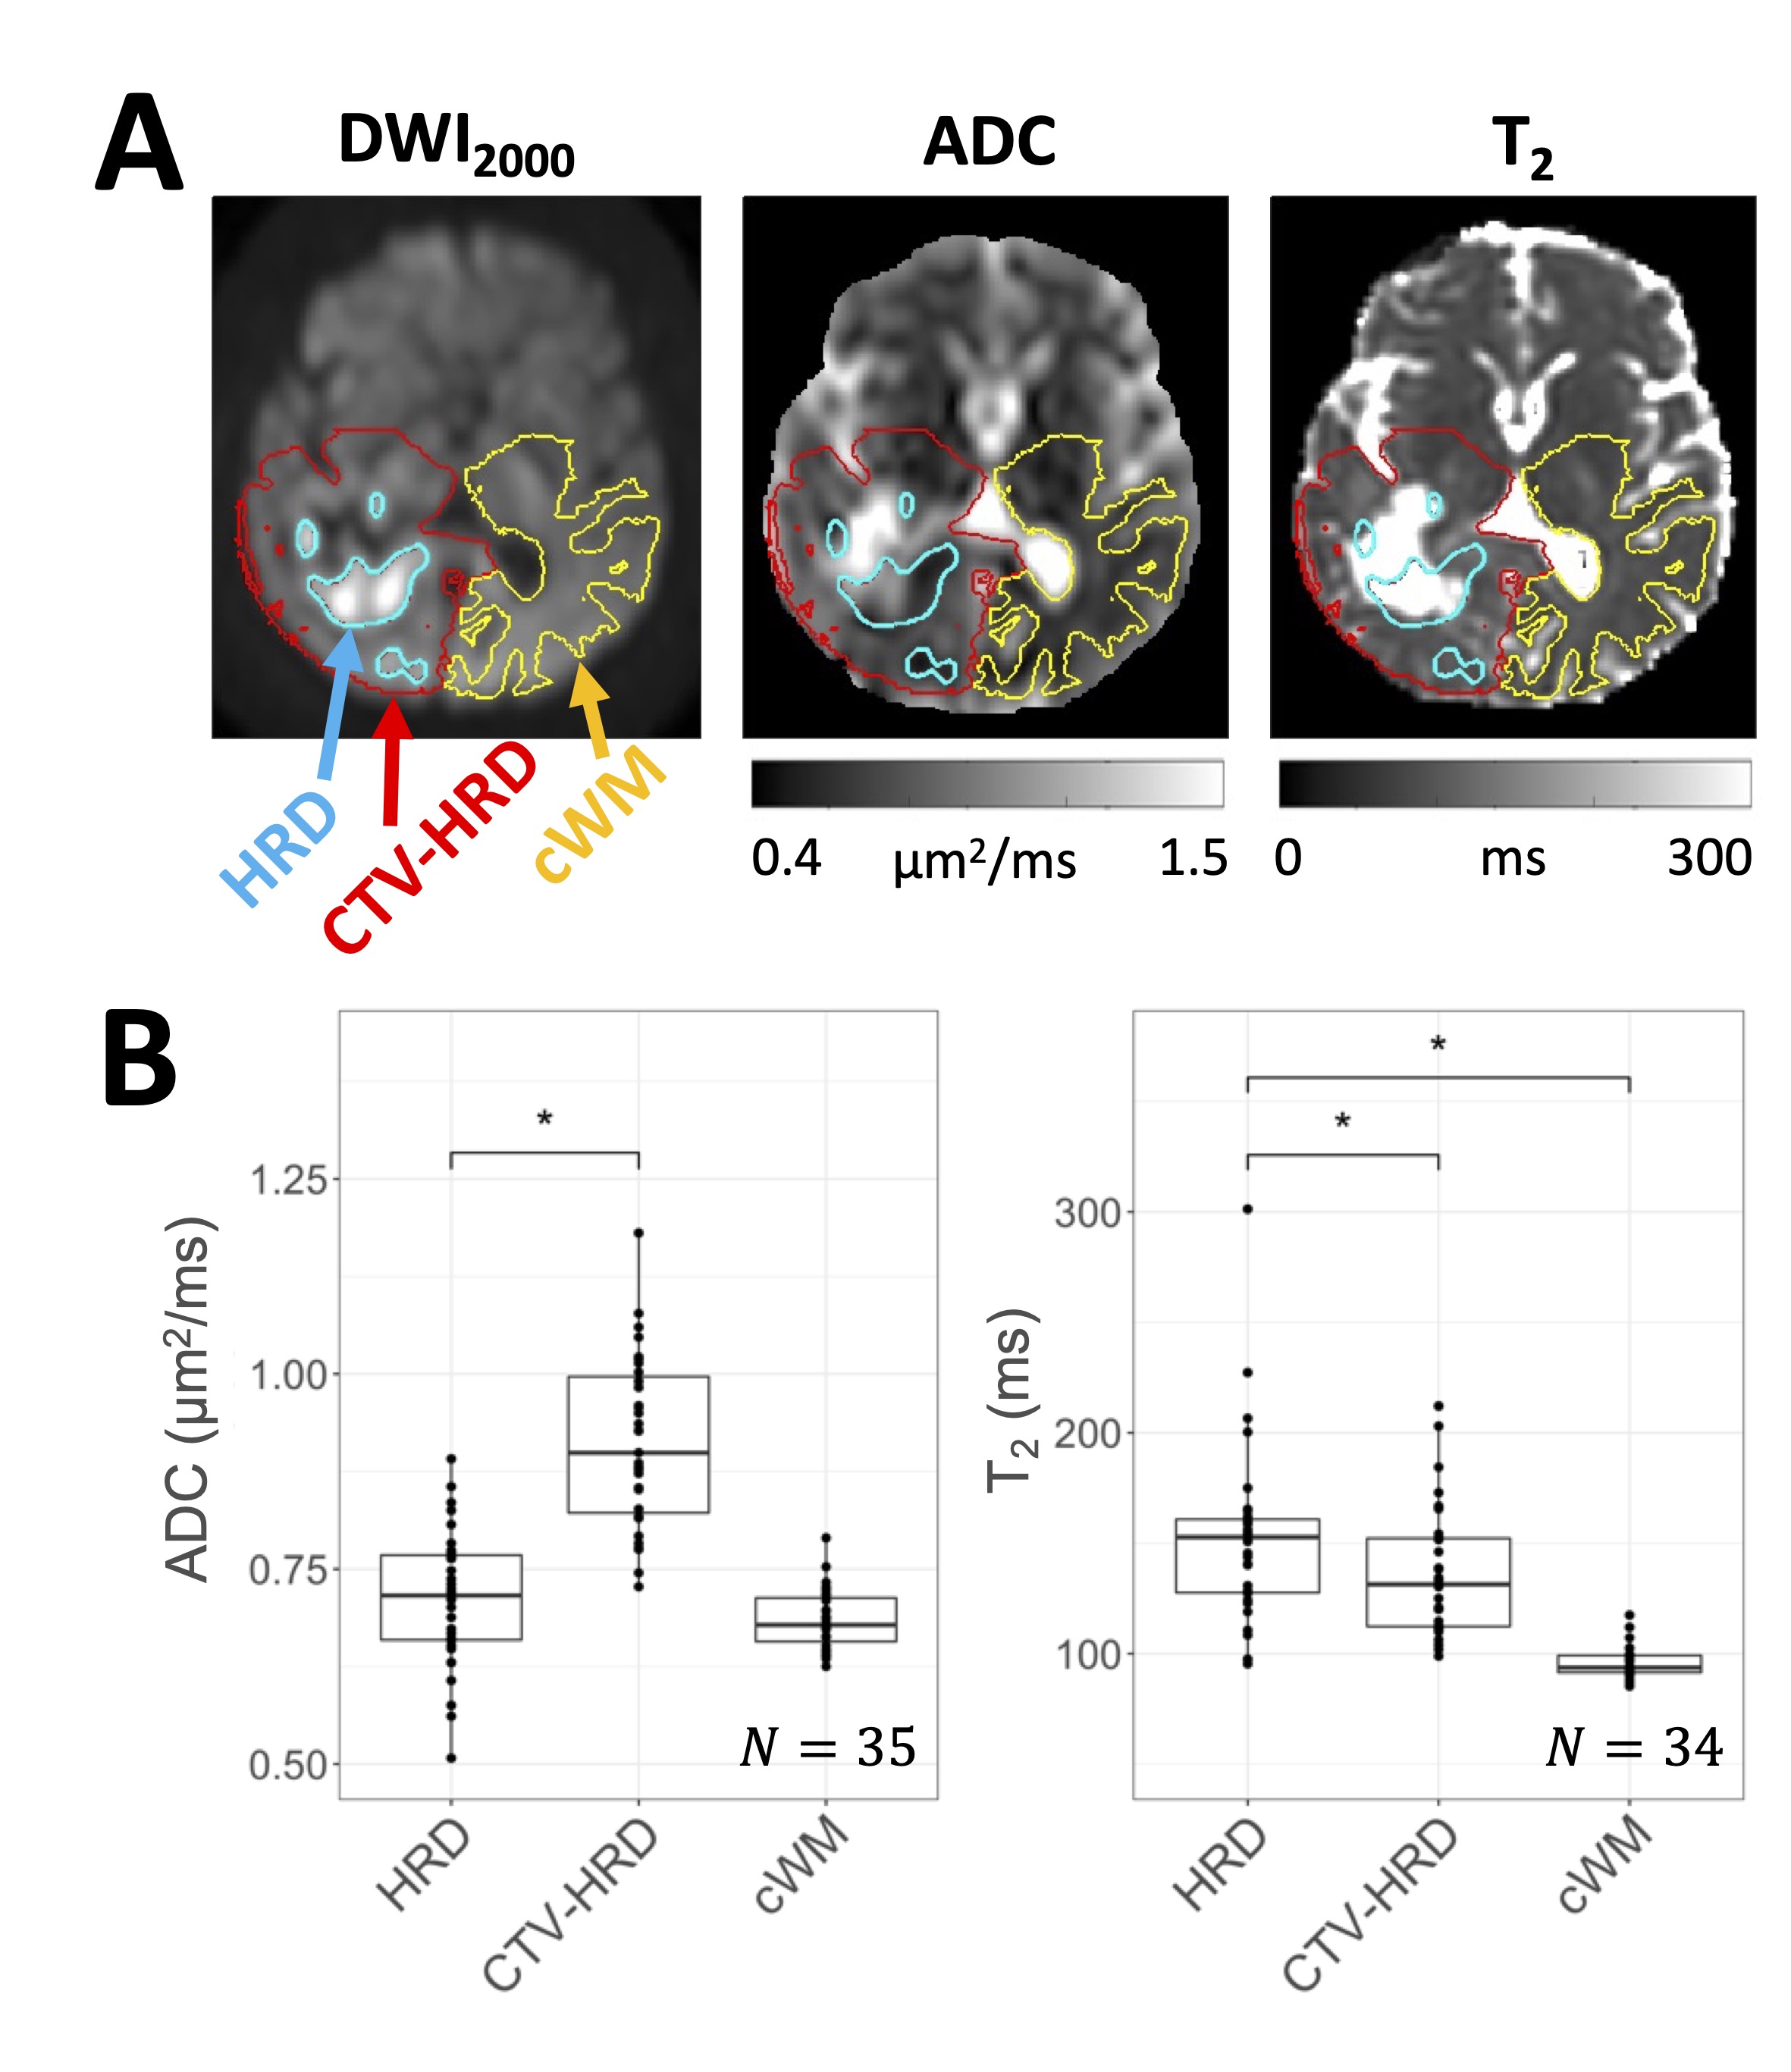
The SNR was sufficient for ADC estimation without substantial Rician noise bias18 (Figure 2).In the HRD at first-DWI, ADC values were decreased relative to CTV-HRD (p<.001) but were not significantly different from cWM (p=.083). T2 values were elevated relative to CTV-HRD (p=.012) and cWM (p<.001) (Figure 3).
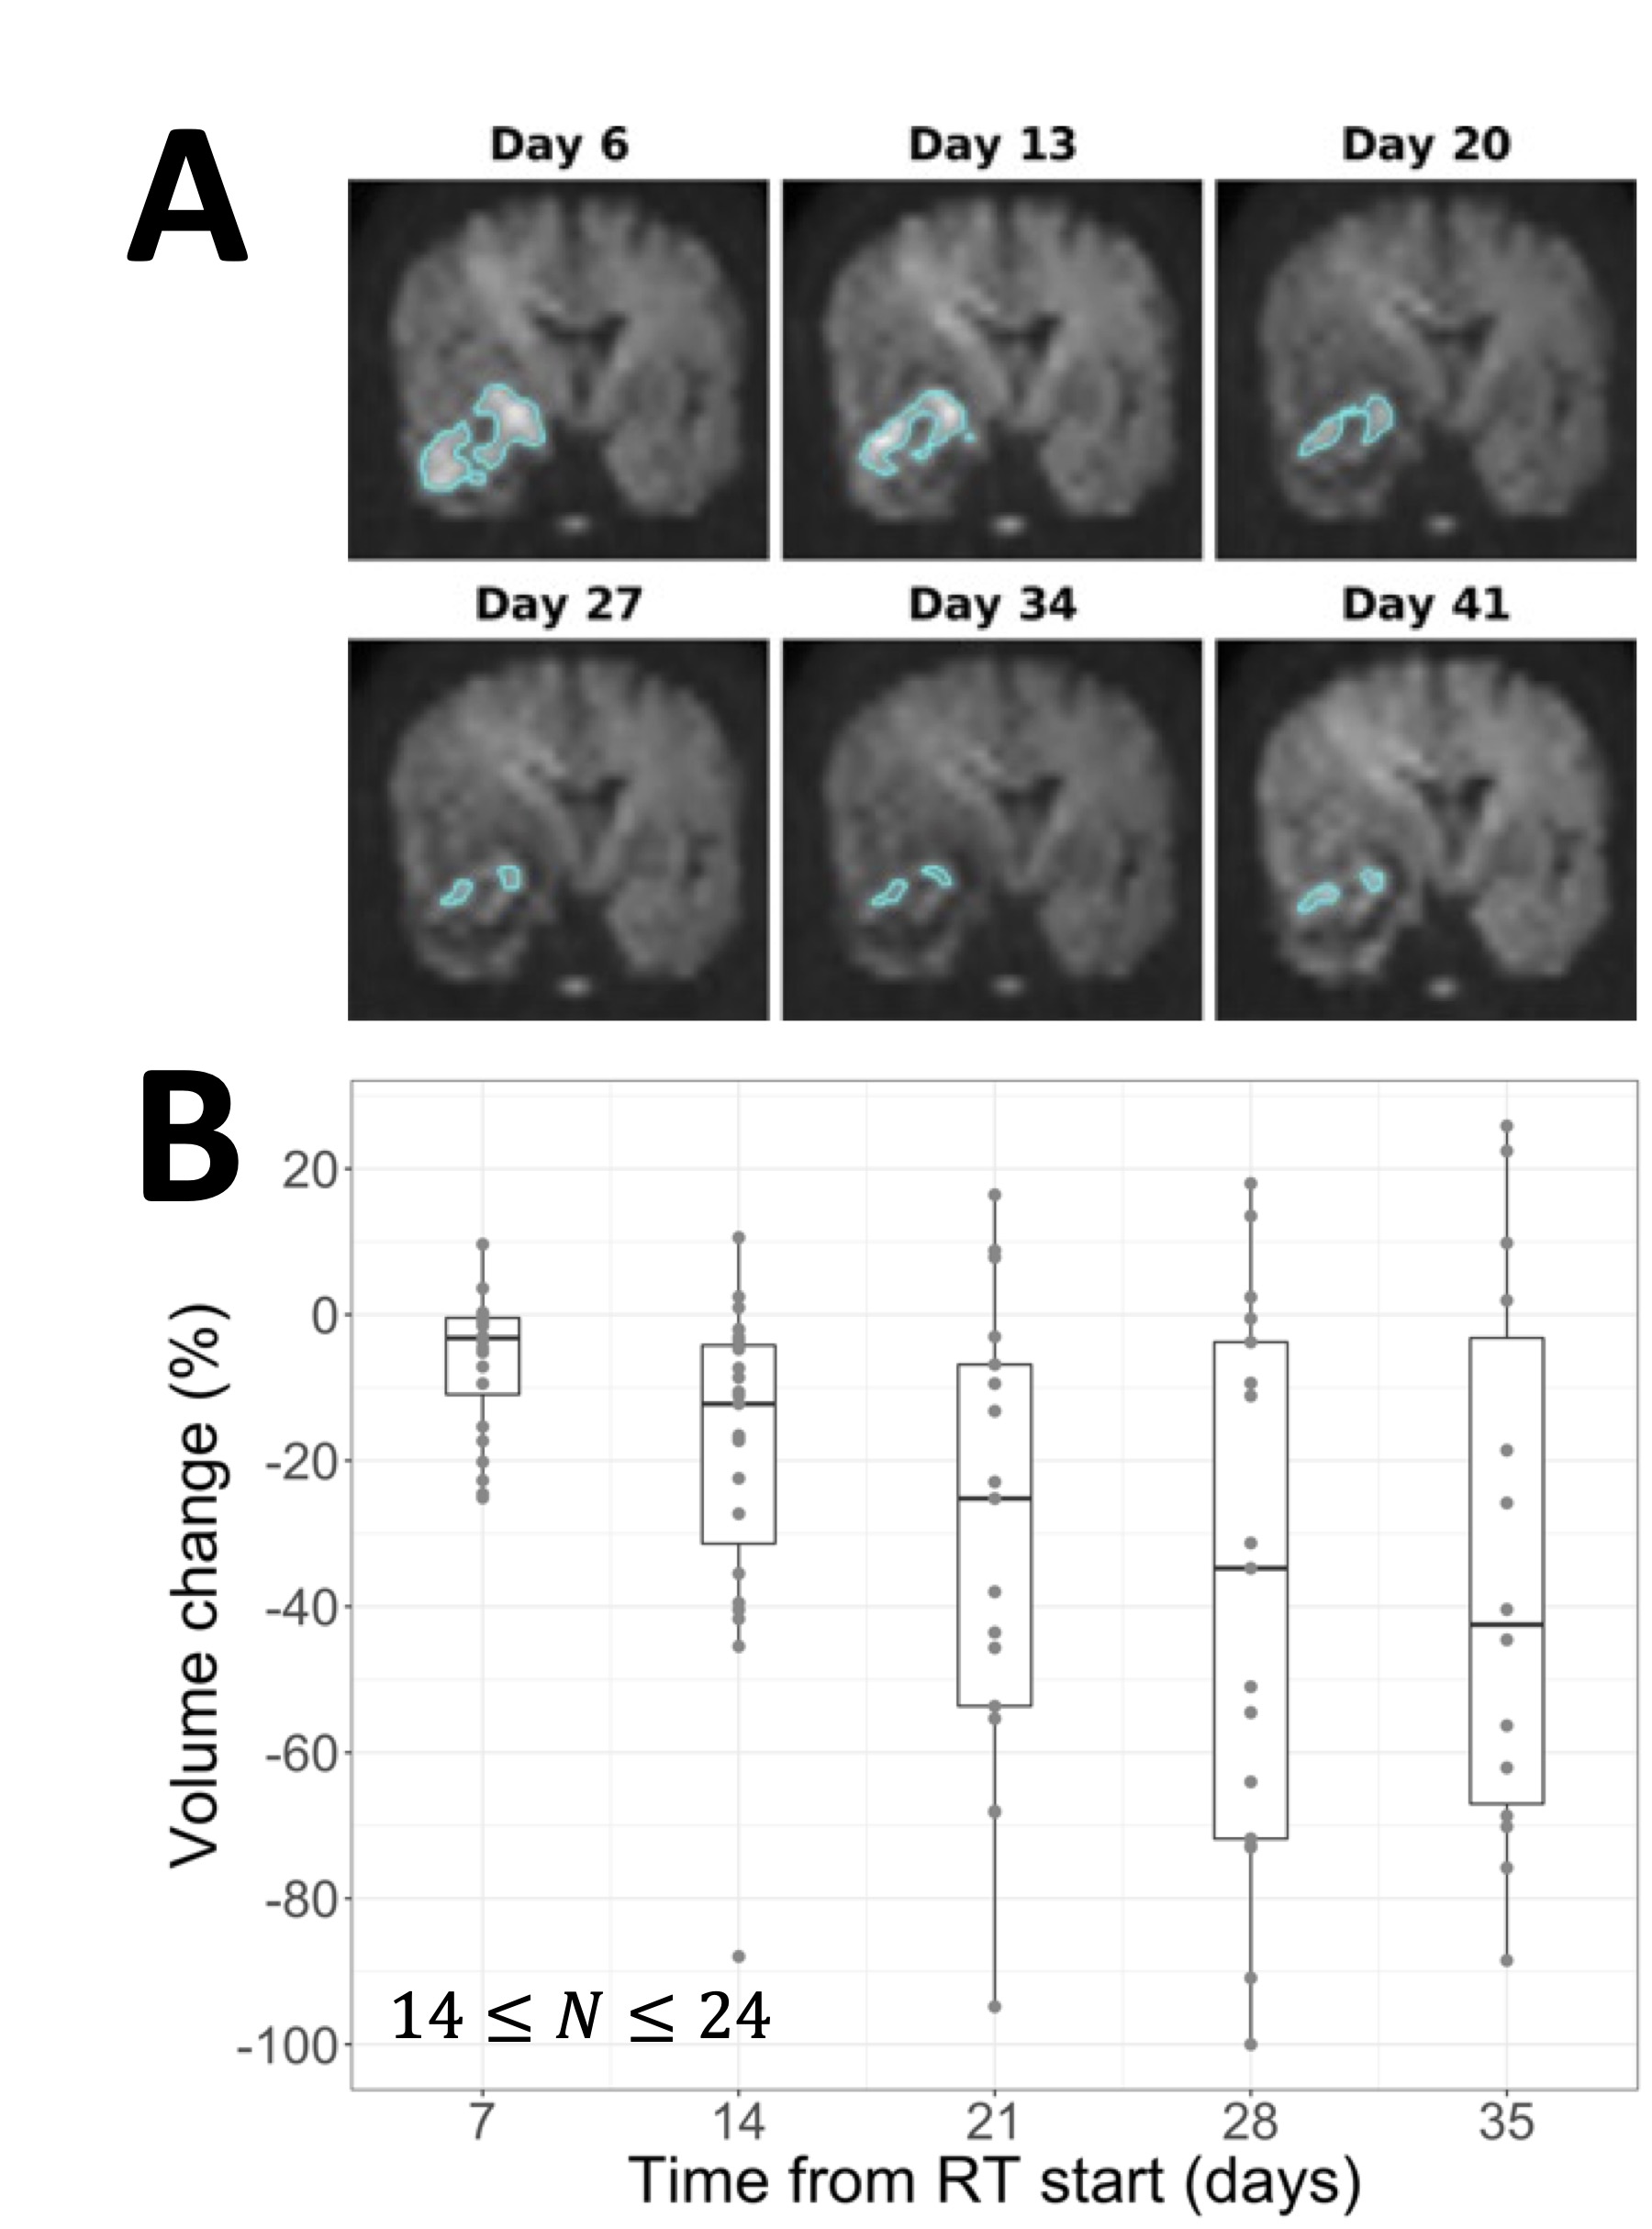
After exclusion, 25 patients were used for evaluating temporal changes. HRD volumes tended to shrink during treatment, starting with a median change of -3.2% at day 7 and decreasing to -42% by day 35 (Figure 4). The fraction of the HRD outside of the GTV increased during treatment, starting at a median value of 0.19 at day 7 and increasing to 0.41 by day 35 (Figure 5).
Discussion
We found evidence in favour of the hypothesis that hyperintense regions on DWI result from diffusion restriction and hypercellularity: ADC values were reduced in HRDs relative to the remainder of the CTV (Figure 3); and HRDs shrank continuously during radiotherapy (Figure 4), which is consistent with reducing cellularity due to treatment-induced necrosis.19However, prolonged relaxation times may also play a role in generating hyperintensities since HRD T2 values were elevated compared to the rest of the CTV (Figure 3). Analyzing parameter maps (e.g., ADC, quantitative MT or CEST20,21) instead of DWI may be more effective for identifying hypercellular tumour.
A significant fraction of the HRD was outside of the GTV and this fraction increased over time (Figure 5), suggesting the potential for DWI to visualize non-enhancing tumour. By definition, the HRD was within the CTV; future work will include identifying tumour beyond the CTV. This study found HRD dynamics consistent with literature,3,5,7 while also including more imaging timepoints than previous studies.
Conclusions
Hyperintensities on high b-value DWI in glioblastoma are indicative of restricted diffusion and prolonged relaxation times. Dose escalation to these regions would benefit from adaptive radiotherapy using MR-Linacs.Acknowledgements
We thank the MR-Linac radiation therapists Shawn Binda, Danny Yu, Renée Christiani, Katie Wong, Helen Su, Monica Foster, Rebekah Shin, Khang Vo, Ruby Bola, Susana Sabaratram, Christina Silverson, Danielle Letterio, and Anne Carty for scanning and for their assistance with the protocol; Mikki Campbell for study coordination; Brian Keller and Brige Chugh for MR-Linac operations; and Wilfred Lam for data retrieval. We gratefully acknowledge the following sources of funding: Natural Sciences and Engineering Research Council; Terry Fox Research Institute; Canadian Institutes of Health Research; and Canadian Cancer Society Research Institute.References
1. Eidel O, Burth S, Neumann JO, et al. Tumor Infiltration in Enhancing and Non-Enhancing Parts of Glioblastoma: A Correlation with Histopathology. Kleinschnitz C, ed. PLoS ONE. 2017;12(1):e0169292. doi:10.1371/journal.pone.0169292
2. Doskaliyev A, Yamasaki F, Ohtaki M, et al. Lymphomas and glioblastomas: Differences in the apparent diffusion coefficient evaluated with high b-value diffusion-weighted magnetic resonance imaging at 3T. European Journal of Radiology. 2012;81(2):339-344. doi:10.1016/j.ejrad.2010.11.005
3. Pramanik PP, Parmar HA, Mammoser AG, et al. Hypercellularity Components of Glioblastoma Identified by High b-Value Diffusion-Weighted Imaging. International Journal of Radiation Oncology*Biology*Physics. 2015;92(4):811-819. doi:10.1016/j.ijrobp.2015.02.058
4. Yamasaki F, Kurisu K, Aoki T, et al. Advantages of high b-value diffusion-weighted imaging to diagnose pseudo-responses in patients with recurrent glioma after bevacizumab treatment. European Journal of Radiology. 2012;81(10):2805-2810. doi:10.1016/j.ejrad.2011.10.018
5. Wahl DR, Kim MM, Aryal MP, et al. Combining Perfusion and High B-value Diffusion MRI to Inform Prognosis and Predict Failure Patterns in Glioblastoma. International Journal of Radiation Oncology*Biology*Physics. 2018;102(4):757-764. doi:10.1016/j.ijrobp.2018.04.045
6. Kim MM, Sun Y, Aryal MP, et al. A Phase 2 Study of Dose-intensified Chemoradiation Using Biologically Based Target Volume Definition in Patients With Newly Diagnosed Glioblastoma. International Journal of Radiation Oncology*Biology*Physics. 2021;110(3):792-803. doi:10.1016/j.ijrobp.2021.01.033
7. Kim MM, Aryal MP, Sun Y, et al. Response assessment during chemoradiation using a hypercellular/hyperperfused imaging phenotype predicts survival in patients with newly diagnosed glioblastoma. Neuro Oncol. 2021;23(9):1537-1546. doi:10.1093/neuonc/noab038
8. Silvera S, Oppenheim C, Touzé E, et al. Spontaneous intracerebral hematoma on diffusion-weighted images: influence of T2-shine-through and T2-blackout effects. AJNR Am J Neuroradiol. 2005;26(2):236-241.
9. Burdette JH, Elster AD, Ricci PE. Acute cerebral infarction: quantification of spin-density and T2 shine-through phenomena on diffusion-weighted MR images. Radiology. 1999;212(2):333-339. doi:10.1148/radiology.212.2.r99au36333
10. Isobe T, Matsumura A, Anno I, et al. Quantification of cerebral metabolites in glioma patients with proton MR spectroscopy using T2 relaxation time correction. Magnetic Resonance Imaging. 2002;20(4):343-349. doi:10.1016/S0730-725X(02)00500-3
11. Avants BB, Tustison NJ, Stauffer M, Song G, Wu B, Gee JC. The Insight ToolKit image registration framework. Front Neuroinform. 2014;8:44. doi:10.3389/fninf.2014.00044
12. Jenkinson M, Smith S. A global optimisation method for robust affine registration of brain images. Med Image Anal. 2001;5(2):143-156. doi:10.1016/S1361-8415(01)00036-6
13. Jenkinson M, Bannister P, Brady M, Smith S. Improved Optimization for the Robust and Accurate Linear Registration and Motion Correction of Brain Images. NeuroImage. 2002;17(2):825-841. doi:10.1006/nimg.2002.1132
14. Smith SM, Jenkinson M, Woolrich MW, et al. Advances in functional and structural MR image analysis and implementation as FSL. NeuroImage. 2004;23:S208-S219. doi:10.1016/j.neuroimage.2004.07.051
15. Avants BB, Tustison NJ, Wu J, Cook PA, Gee JC. An open source multivariate framework for n-tissue segmentation with evaluation on public data. Neuroinformatics. 2011;9(4):381-400. doi:10.1007/s12021-011-9109-y
16. Kim D, Jensen JH, Wu EX, Sheth SS, Brittenham GM. Breathhold multiecho fast spin-echo pulse sequence for accurate R2 measurement in the heart and liver. Magn Reson Med. 2009;62(2):300-306. doi:10.1002/mrm.22047
17. Kooreman ES, van Houdt PJ, Keesman R, et al. ADC measurements on the Unity MR-linac – A recommendation on behalf of the Elekta Unity MR-linac consortium. Radiotherapy and Oncology. 2020;153:106-113. doi:10.1016/j.radonc.2020.09.046
18. Jones DK, Basser PJ. “Squashing peanuts and smashing pumpkins”: How noise distorts diffusion-weighted MR data. Magn Reson Med. 2004;52(5):979-993. doi:10.1002/mrm.20283
19. Chenevert TL, Stegman LD, Taylor JMG, et al. Diffusion Magnetic Resonance Imaging: an Early Surrogate Marker of Therapeutic Efficacy in Brain Tumors. J Natl Cancer Inst. 2000;92(24):2029-2036. doi:10.1093/jnci/92.24.2029
20. Chan RW, Chen H, Myrehaug S, et al. Quantitative CEST and MT at 1.5T for monitoring treatment response in glioblastoma: early and late tumor progression during chemoradiation. J Neurooncol. Published online November 16, 2020. doi:10.1007/s11060-020-03661-y
21. Chan RW, Lawrence LSP, Oglesby RT, et al. Chemical exchange saturation transfer MRI in central nervous system tumours on a 1.5 T MR-Linac. Radiotherapy and Oncology. 2021;162:140-149. doi:10.1016/j.radonc.2021.07.010
Figures