1574
Pre-treatment Turbo Spin-Echo (TSE) intravoxel incoherent motion (IVIM) predicts treatment outcome in nasopharyngeal carcinoma1Radiology, Union Hospital Tongji Medical College Huazhong University of Science and Technology, Wuhan, China, 2Union Hospital Tongji Medical College Huazhong University of Science and Technology, Wuhan, China, Wuhan, China, 3Union Hospital Tongji Medical College Huazhong University of Science and Technology, Wu, China, 4Philips healthcare,Beijing, Beijing, China, 5Union Hospital Tongji Medical College Huazhong University of Science and Technology, Wuhan, China
Synopsis
Keywords: Tumors, Head & Neck/ENT
TSE-DWI-IVIM as a new and feasible method for predicting the early response to Induction Chemotherapy(IC) for NPC patients.Diffusion-related IVIM parameters (pre-D) might be and perfusion-related parameters (pre-f) can be helpful as potential imaging biomarkers of the therapeutic response to IC in NPC patients.
Abstract
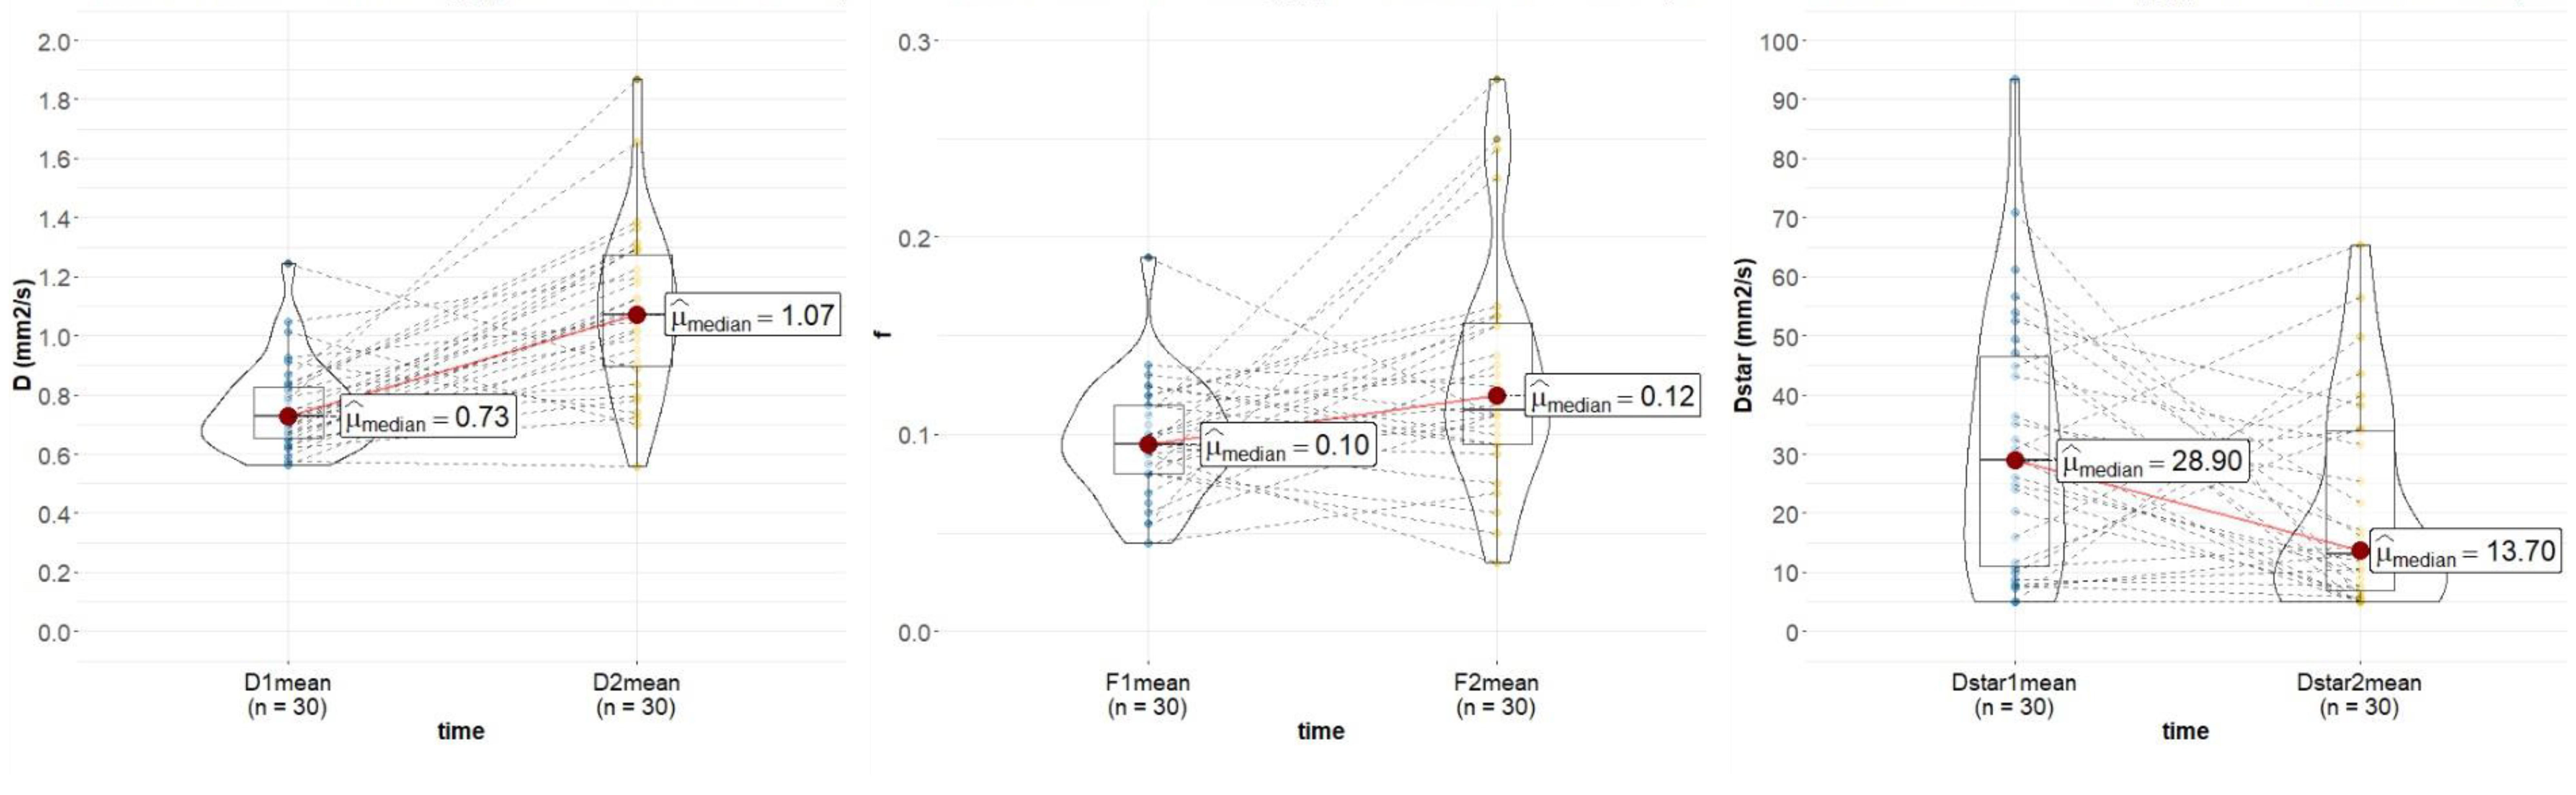
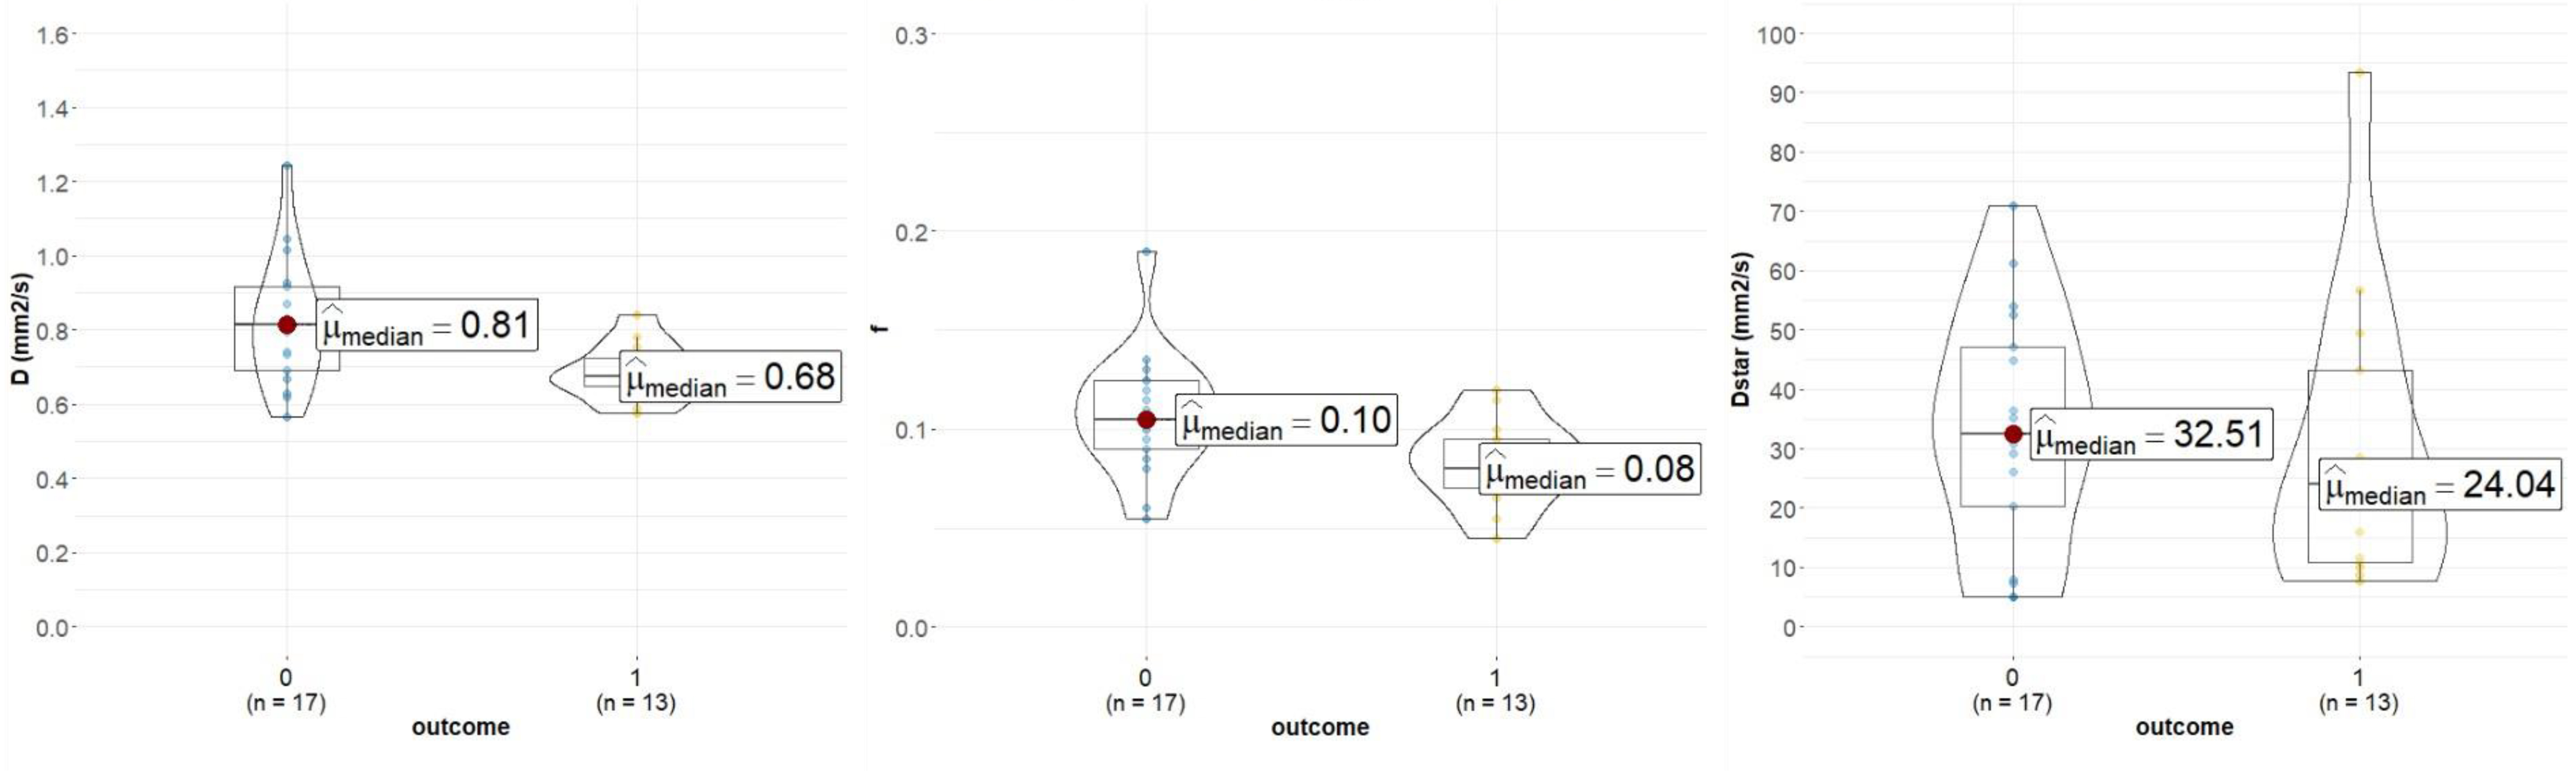
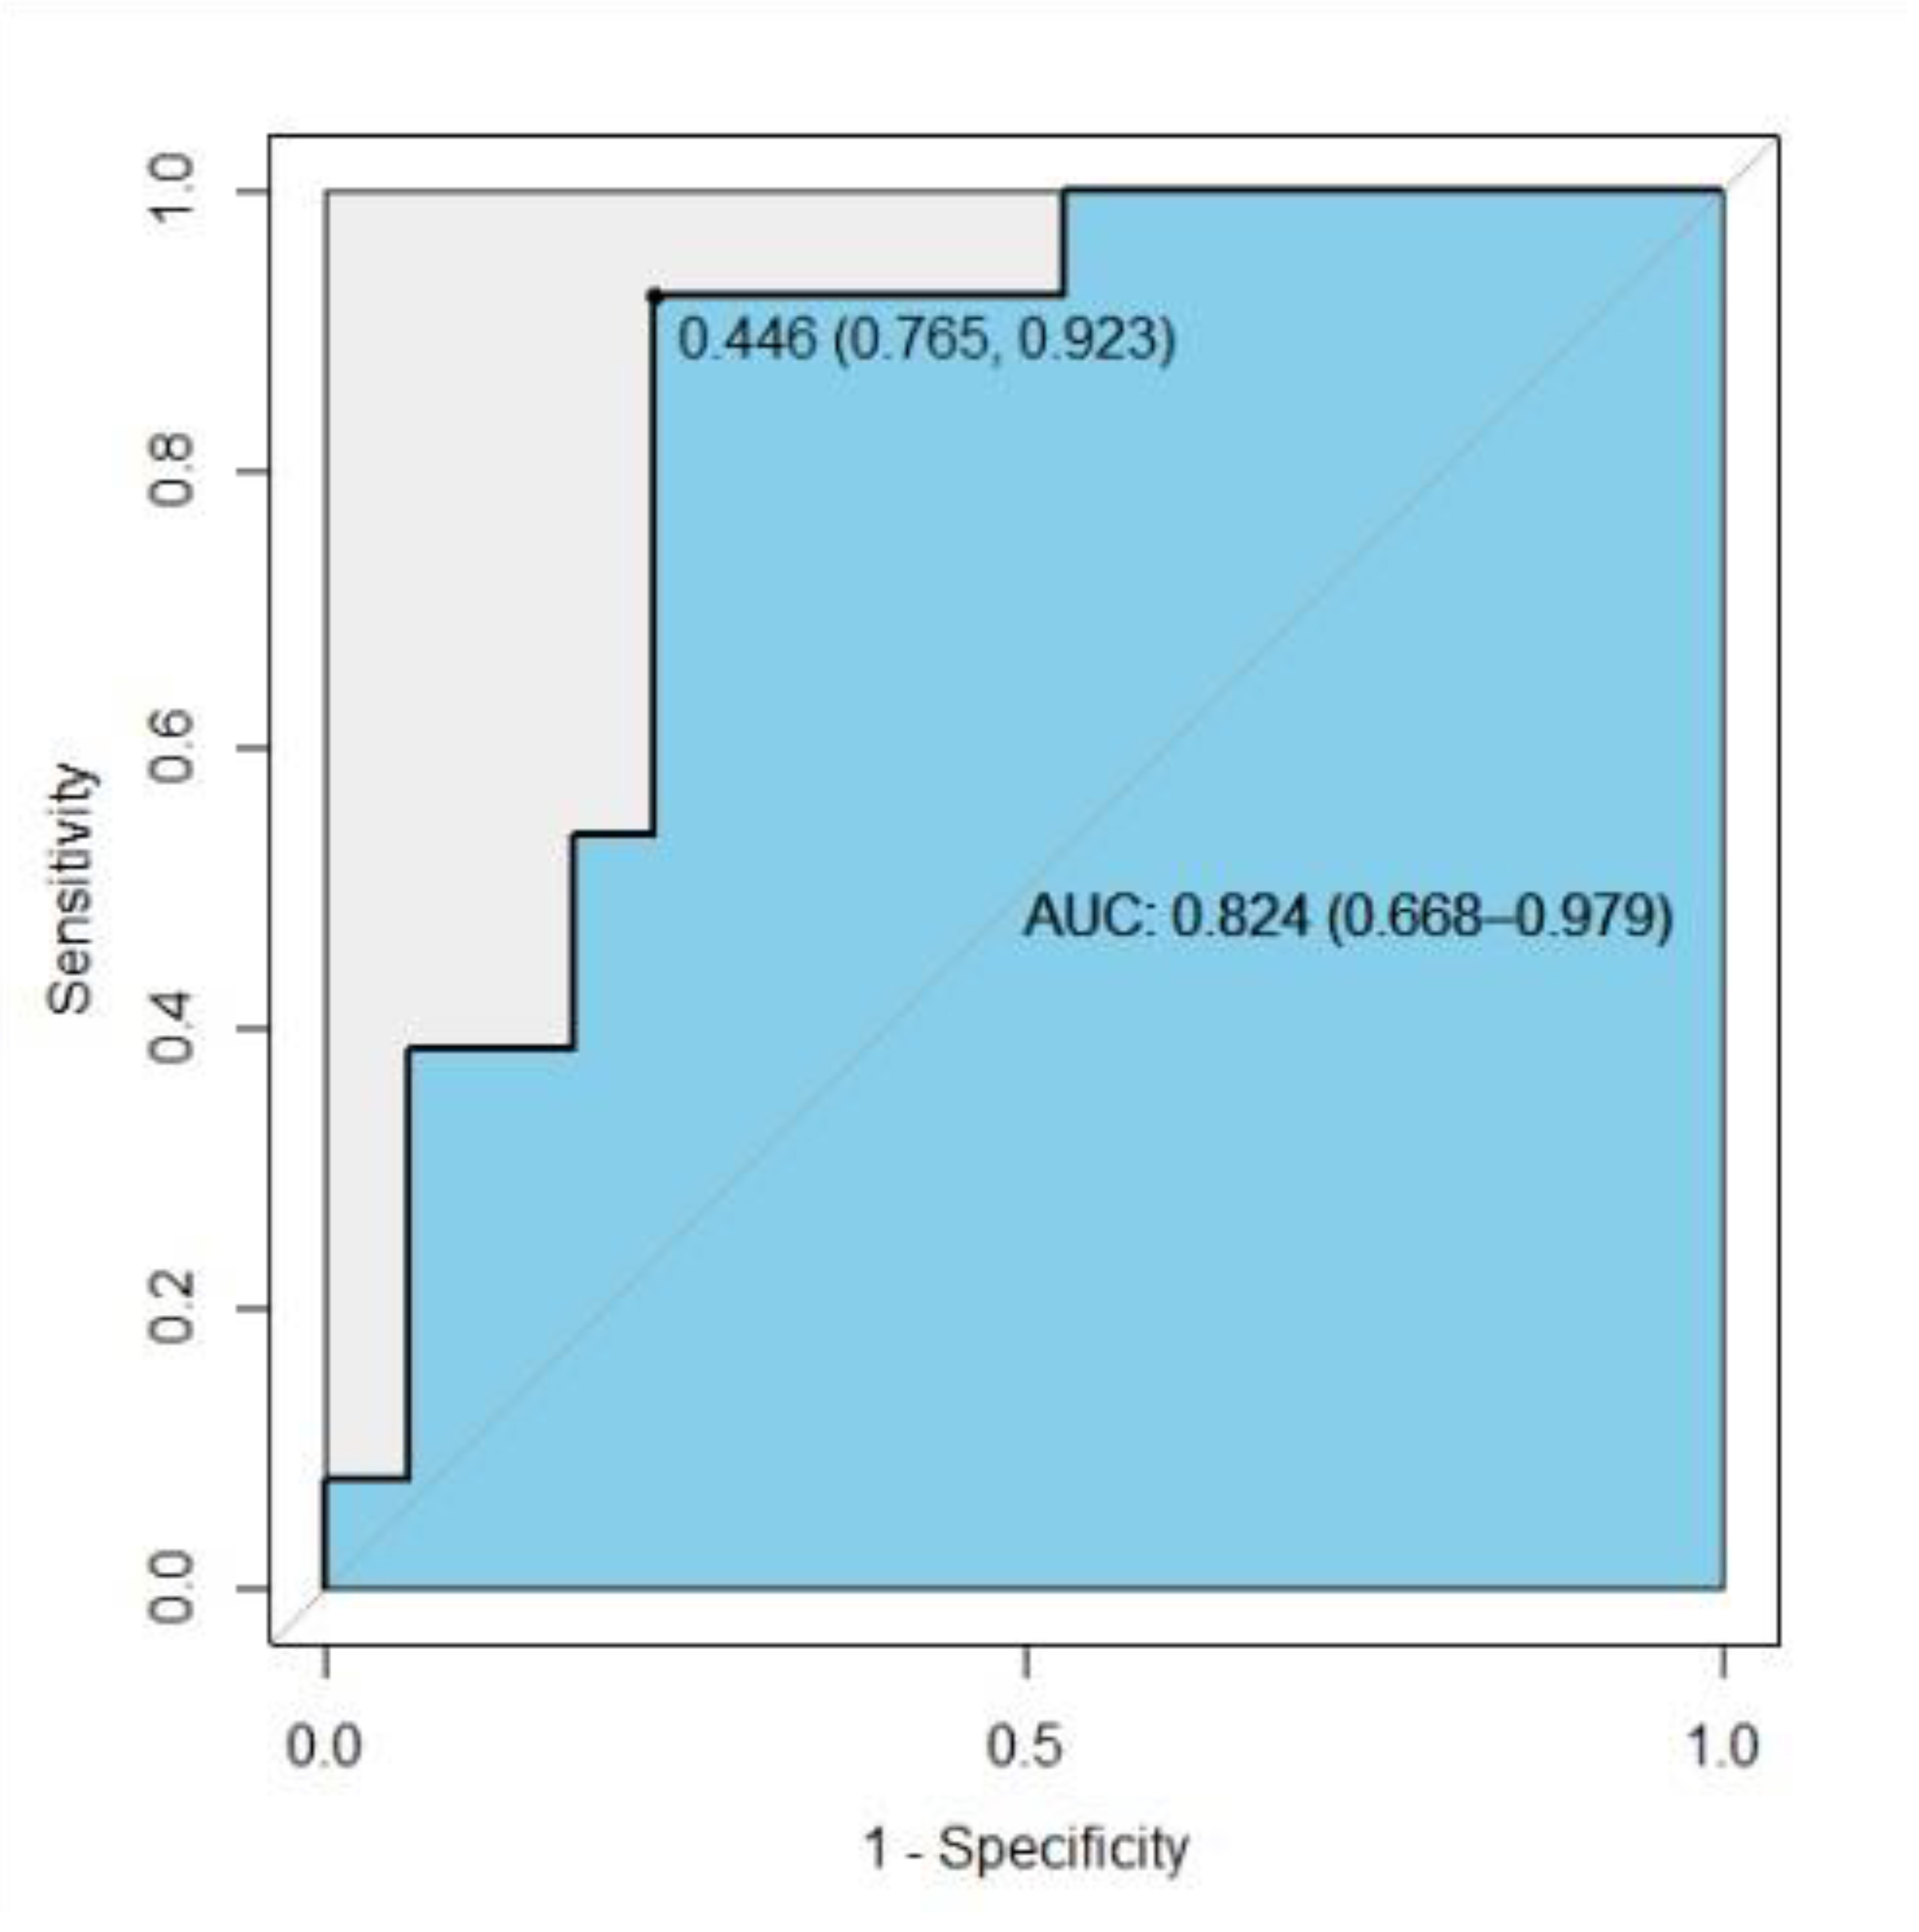
Introduction Nasopharyngeal carcinoma (NPC) is highly prevalent in East and Southeast Asia, particularly in South China[1]. Despite the management of NPC has improved because of advances in radiotherapy technology and chemotherapy, patients with advanced stages NPC (T3-4 or N2-3) have a higher rate of recurrence or metastasis[2]. It would be advantageous to find new imaging markers that could early predict therapeutic response in the early period of therapy. The treatment response after 2 Neoadjuvant chemotherapy (NAC) cycles has been reported as a valuable time point to choose patients to chemoradiation therapy[3]. The intravoxel incoherent motion (IVIM) diffusion-weighted imaging (DWI) model is an advanced diffusion technique, using multiple b values and bi-exponential fitting for the pure molecular water diffusion and microcirculation of blood water in randomly capillaries[4]. Several studies have shown the utility of IVIM for characterizing different tumors in different organs, and monitoring treatment responses. Echo-planar imaging (EPI) is the most common sequence for DWI. However, EPI has several inherent drawbacks, including susceptibility, and chemical shift artifacts. Therefore, we hypothesize that IVIM parameters derived from the turbo spin-echo (TSE) based DWI could serve as a surrogate technique in predicting the early therapeutic response in NPC. Methods This prospective study was approved by the local institutional review board, and written consent was obtained from patients with NPC, who underwent staging MRI of the head and neck. All TNM statuses of patients were determined according to the 7th edition of the American Joint Committee on Cancer. 30 NPC patients were enrolled in the study (22 males and 8 females, mean age:48.2±12.4 years). After 2 NAC cycles, patients achieving CR or PR were categorized as the good-respond group, while SD and PD were assigned to the poor-respond group assessed by Response Evaluation Criteria in Solid Tumors (RECIST Version1.1). 17 patients were assigned to the good-respond group, of the remaining 13 were categorized as the poor-respond group. All patients were scanned using a 3.0T MR scanner (Ingenia CX, Philips Healthcare, the Netherlands) with a 16-channel neurovascular coil. Axial TSE-IVIM-DWI images were acquired using a fat-suppressed, single-shot turbo spin-echo (TSE) imaging sequence. The protocol was as follows: slice thickness, 5 mm; field of view, 230 × 230 mm2; voxel size, 2.5 × 2.5 mm2; repetition time, 2000 ms; echo time, 108 ms; and 8 b-values, 0, 20, 40, 80, 160, 300, 500, 800 s/mm2. The total TSE-IVIM-DWI scan time was 6 min 44 s. The IVIM model was fitted using a Philips workstation (IntelliSpace Portal v10) and the IVIM metrics D, D*, and f were extracted for further analysis (pre-treatment: pre-D, pre-D*, and f; post-treatment: post-D, post-D*, and post-f ). Result There were statistically significant differences in IVIM metrics pre- and post-D and f (p < 0.05) and after treatment, D and f significantly increased. There was no significant difference in pre-D* and post-D* (p=0.28)(Figure1). Statistically significant differences were identified in preD and pre-f between the good-respond group and the poor-respond group (pre-D: p=0.02. pre-f: p=0.02). pre-D* indicated no significant difference between the two groups (p=0.53)(Figure2,Figure4-5). The ROC curve was generated by fitting the above three pre-treatment metrics, with an AUC of 0.837(CI95% 0.694-0.980), a sensitivity of 76.9%, and a specificity of 82.4%.(Figure3) Discussion Our study demonstrated that pre-treatment TSE-DWI-IVIM was feasible for predicting the early response to Induction Chemotherapy(IC) for NPC patients. The susceptibility-induced distortion of images was less in TSE-DWI than in EPI-DWI as the previous study showed.[5] The new TSE-DWI-IVIM sequence helped more accurately to access the response with small NPCs especially when there are susceptibility artifacts from air or bone, and the scan time was acceptable. We observed that patients with a good response to IC had higher pre-D values than those with poor clinical outcomes, which is in line with a previous study [6], this indicated cancers present a greater impediment to diffusion due to the more densely packed tumor cells. The decrease in the number of cells or necrosis during treatment led to a smaller impediment to diffusion. But some previous studies have shown that primary NPCs with a high D had poor short-term outcomes [7]. The low D values were found to have high cell densities, indicating restricted Brownian motion of water and hypoxia, which resulted in the poor outcomes. According to the IVIM theory, both D* and f are perfusion-related parameters. Compared with pre-f, the f values for NPC showed an obvious elevation after IC in our study, which reflected a treatment-induced alteration of perfusion. An enlargement of small blood vessels due to inflammation and edema as IC treatment response[8]. The present study did not reveal significant differences between pre-D* and post-D*, The technical constraints and low robustness of using D* have been shown in previous studies on head and neck cancers[7] Our research had certain limitations, e.g. only a few cases of NPC, especially for the poor effective group, were recruited in this study. This study demonstrated the potential of TSE-DWI-IVIM for predicting the early effect of IC on advanced NPC. Diffusion-related IVIM parameters (pre-D) might be and perfusion-related parameters (pre-f) can be helpful as potential imaging biomarkers of the therapeutic response to IC in NPC patients.Acknowledgements
The authors have no conflicts of interest to disclose.References
1. Tang LL, Chen YP, Chen C ben, et al (2021) The Chinese Society of Clinical Oncology (CSCO) clinical guidelines for the diagnosis and treatment of nasopharyngeal carcinoma. Cancer Commun 41:1195–1227. https://doi.org/10.1002/cac2.12218 2. Zhou GQ, Lv JW, Tang LL, et al (2020) Evaluation of the National Comprehensive Cancer Network and European Society for Medical Oncology Nasopharyngeal Carcinoma Surveillance Guidelines. Front Oncol 10:. https://doi.org/10.3389/fonc.2020.00119 3. Zheng D, Chen Y, Liu X, et al (2015) Early response to chemoradiotherapy for nasopharyngeal carcinoma treatment: Value of dynamic contrast-enhanced 3.0 T MRI. Journal of Magnetic Resonance Imaging 41:1528–1540. https://doi.org/10.1002/jmri.24723 4. Iima M (2021) Perfusion-driven intravoxel incoherent motion (IVIM) MRI in oncology: Applications, challenges, and future trends. Magnetic Resonance in Medical Sciences 20:125–138. https://doi.org/10.2463/mrms.rev.2019-0124 5. Mikayama R, Yabuuchi H, Sonoda S, et al (2018) Comparison of intravoxel incoherent motion diffusion-weighted imaging between turbo spin-echo and echo-planar imaging of the head and neck. Eur Radiol 28:316–324. https://doi.org/10.1007/s00330-017-4990-x 6. Chen WB, Zhang B, Liang L, et al (2017) Oncotarget 53740 www.impactjournals.com/oncotarget To predict the radiosensitivity of nasopharyngeal carcinoma using intravoxel incoherent motion MRI at 3.0 T 7. Qamar S, King AD, Ai QYH, et al (2020) Pre-treatment intravoxel incoherent motion diffusion-weighted imaging predicts treatment outcome in nasopharyngeal carcinoma. Eur J Radiol 129:. https://doi.org/10.1016/j.ejrad.2020.109127 8. Xiao-Ping Y, Jing H, Fei-Ping L, et al (2016) Intravoxel incoherent motion MRI for predicting early response to induction chemotherapy and chemoradiotherapy in patients with nasopharyngeal carcinoma. Journal of Magnetic Resonance Imaging 43:1179–1190. https://doi.org/10.1002/jmri.25075Figures
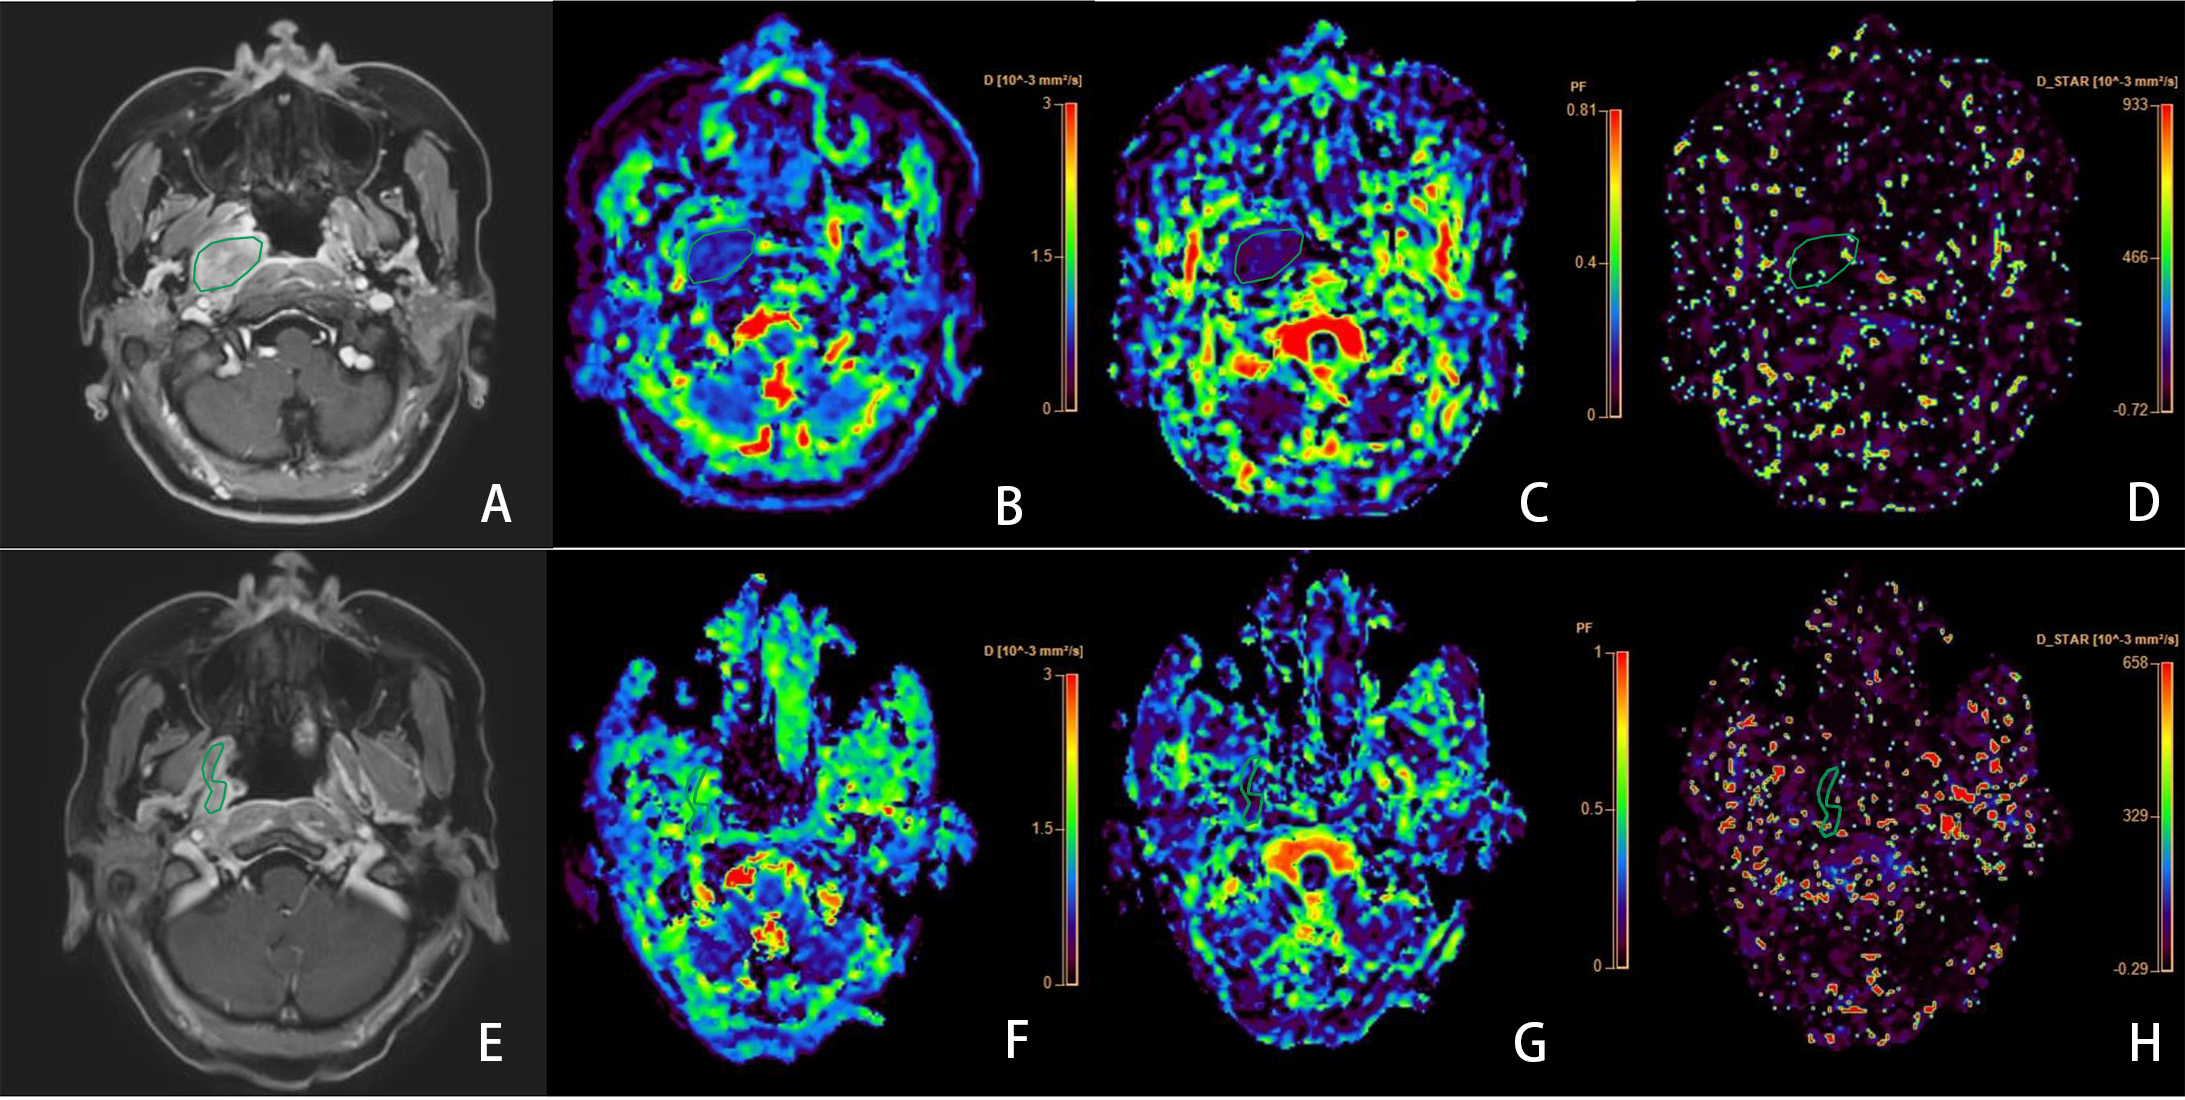
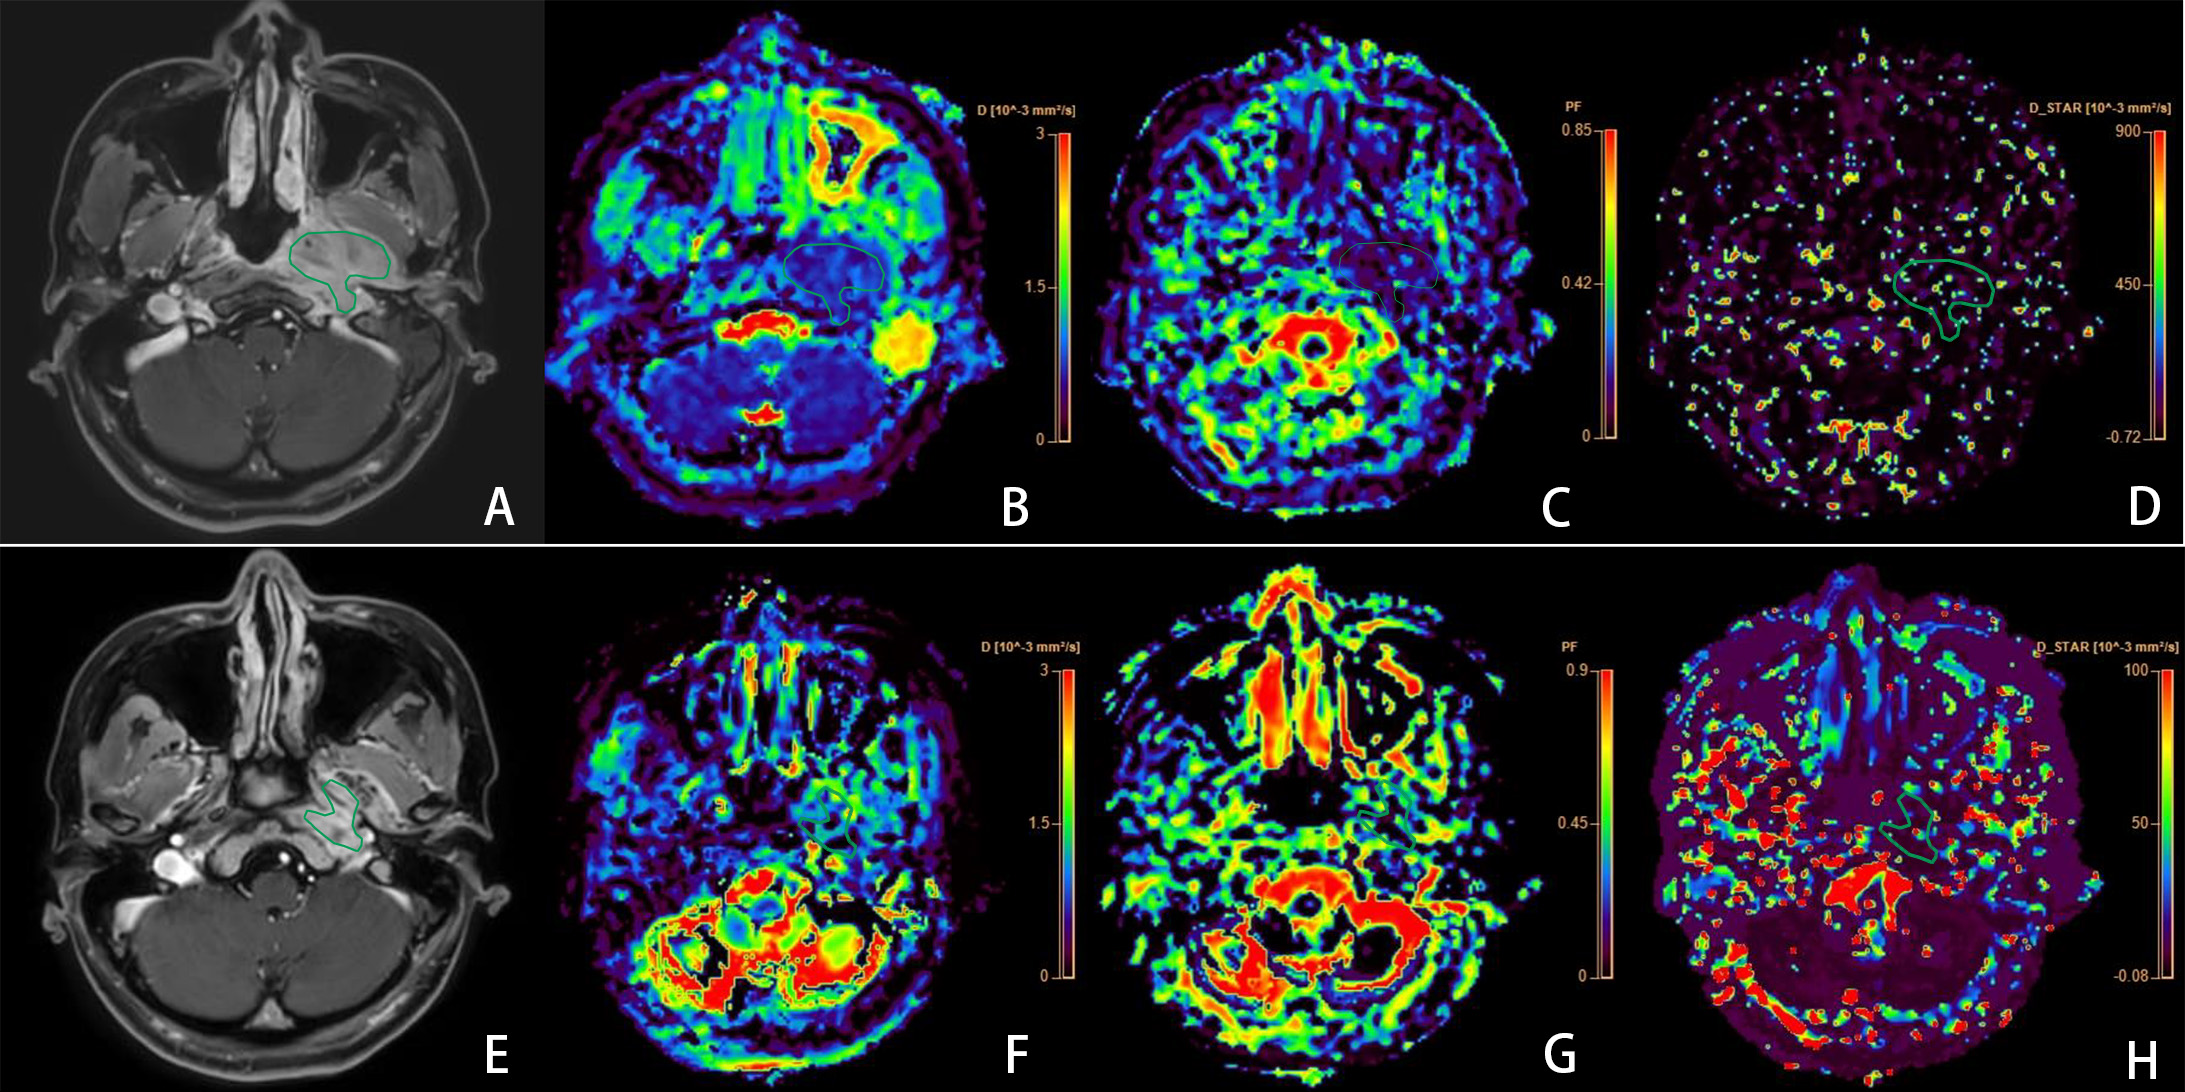
Representative images of a 31 year nasopharyngeal carcinoma patient (T4N2M0) with stable disease (SD) in the poor-respond group. Images in the first row (A-D) are contrast T1WI , D, f and D*maps before the initiation of IC. The D, f and D* values were 0.68x 10⁻³ mm2 /s, 0.09,10.075x10-3 mm2 /s, respectively. Images in the second row (E-H) are maps after the first cycle of IC, as well as contrast T1WI , D, f and D*maps. The D, f and D* values were 0.98x 10⁻³ mm2 /s, 0.23,39.98x 10-3 mm2 /s, respectively.