1573
Differentiation of progressive disease from pseudo-progression using Synthetic MRI and MUSE-DWI in patients with glioblastoma.1Ningxia Medical University, Yinchuan, China, 2GE Healthcare MR Research, Beijing, China, 3General Hospital of Ningxia Medical University, Yinchuan, China
Synopsis
Keywords: Tumors, Brain
This work sought to investigate the performance of synthetic MRI(Sy-MRI) and MUSE-DWI in differentiating progressive disease (PD) from pseudo-progression (PsP). It was concluded that the pre-contrast T1(T1-pre) and post-contrast T1(T1-Gd) from synthetic MRI can be used as novel quantitative imaging biomarkers for discriminating PD from PsP. The combination of T1-pre, T1-Gd and ADC may explore as an effective strategy to improve the ability for discriminating PD from PsP, and provide a basis for clinical follow-up diagnosis and treatment.Introduction
Glioblastoma is the most common intracranial primary malignant tumor in adults, with a high recurrence rate and poor prognosis [1]. The current standard of treatment is surgical resection within the maximum safe range and concurrent postoperative chemoradiotherapy [2].Upon completion of chemoradiotherapy, new intensified lesions appear on T1WI-enhanced images on imaging follow-up, possibly progressive disease (PD) and pseudo-progression (PsP) [3]. The time window of abnormal intensification is similar, it is difficult to identify, and the misdiagnosis rate in clinical diagnosis and treatment is high, which is a major challenge in the follow-up of glioma surgery, so it is necessary to accurately distinguish them at an early stage. Therefore, the purpose of this study is to investigate and compare the diagnostic performance of synthetic MRI and MUSE-DWI and their combination in the diagnosis of PD and PsP, aiming to provide a basis for clinical diagnosis and treatment.Methods
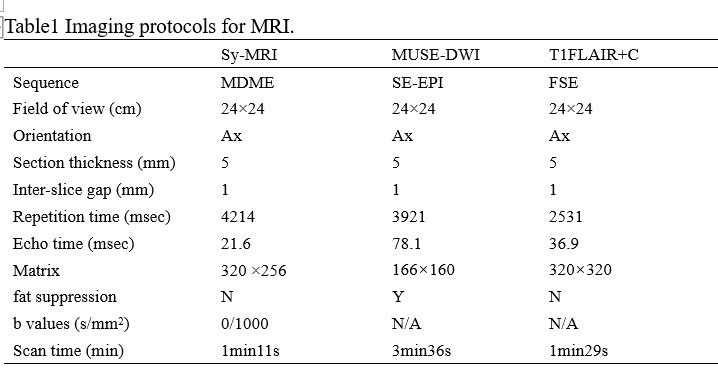
Forty-two patients were eligible between August 2020 and August 2022 according to the inclusion and exclusion criteria. The patients were classified into two groups according to mRANO[4]: the glioblastoma PD group (n=24) and the PsP group (n=18). All patients underwent MR exams with a 3.0T MR scanner (SIGNATM Architect, GE Healthcare, USA) equipped with a 48-channel head-neck unite coil. The scan sequences included synthetic MRI, MUSE-DWI and contrast-enhanced T1FLAIR (T1FLAIR+C). The detailed parameters for imaging sequences are shown in Table 1. Post-contrast MAGiC sequence (MAGiC+C) acquisition was initiated 90s after contrast agent injection. Synthetic relaxometry T1 and T2 maps, were generated from the raw data produced by MAGIC sequence using a vendor-provided program (MAGiC, v.100.1.1). Two physicians with unknown follow-up results outline region of interest (ROI). For synthetic MRI, three ROIs (25-35mm2) were manually drawn on the largest area of the enhancement lesion. The ROIs were then mapped to the ADC images. Finally, the mean values of ROIs for ADC value, pre-contrast T1, T2 value (T1-pre, T2-pre) and post-contrast T1, T2 value (T1-Gd, T2-Gd) of each ROI were calculated. The Student’s t-test, Mann-Whitney U-test or Fisher’s exact test was used to compare the parameters between PD and PsP. Receiver operating characteristic (ROC) curves (AUC) were also evaluated to assess the diagnostic value of parameters for discrimination.Results
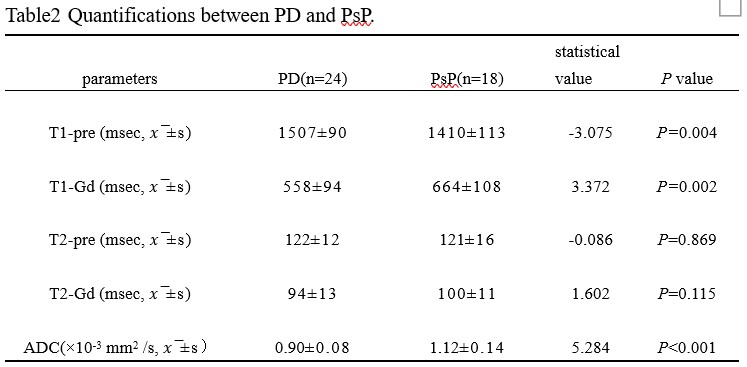
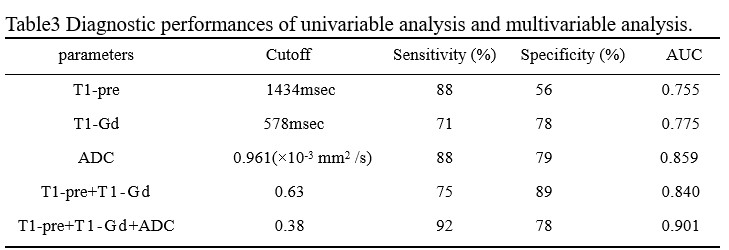
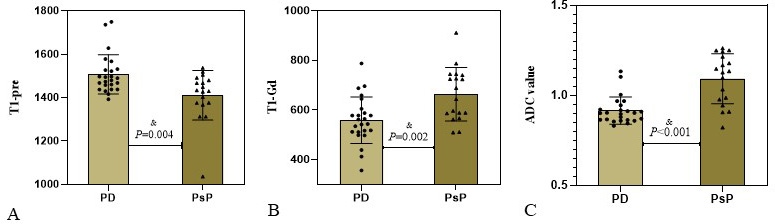
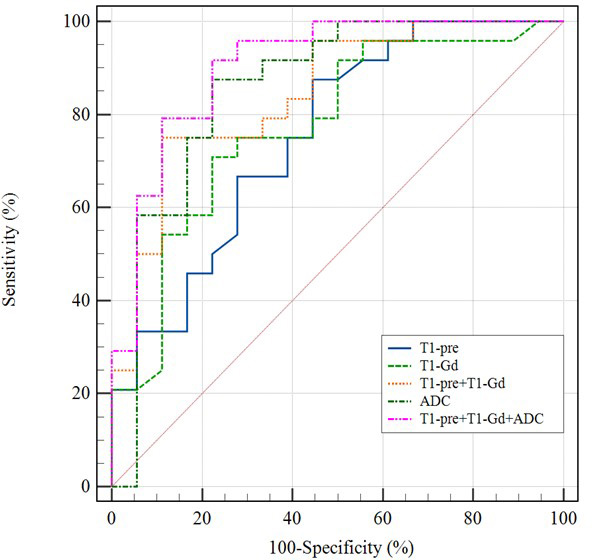
The differences of T1, T2, ADC between PD and PsP are summarized in Table 2. There are significant differences in T1-pre, T1-Gd, ADC values between PD and PsP group (all P<0.05, Figure1.). ROC analysis is showed in Figure2.The ADC presented the largest AUC of 0.859 for identifying PsP, followed by T1-Gd (AUC=0.775) and T1-pre (AUC=0.755). Combination of three parameters (T1-pre+T1-Gd+ADC) have the highest AUC (0.901) among all combined parameters.Discussion
The results revealed that high T1-Gd, ADC as well as higher T1-pre in PsP than PD, furthermore, quantitative multi-parameters of T1-pre+T1-Gd+ADC improved the differentiation performance. The synthetic relaxometry represent the inherent properties of matter and the ADC show microstructural differences at the cellular level. T1relaxometry may reflect the inherent properties of matter and hence have the potential to serve as novel noninvasive biomarkers for different pathological properties. T1 relaxometry before and after enhancement can quantify signal changes in different tissues. T1-Gd was higher in PD group, possibly due to the different pathological tissue components. PsP may be due to tissue damage and inflammation caused by chemoradiotherapy, pathologic manifestations include cellular edema, vascular endothelial cell damage, and transient disruption of the blood-brain-barrier (BBB)[5], and recurrent pathology manifests as rapid proliferation of tumor cells and neovascularization. T1 relaxometry is an intrinsic property of the substance, which is related to the density of tissue cells, the degree of angiogenesis [6]. The microstructure of PD may be more complex, and PD has higher cell density, water content, microvascular proliferation [3]. Stephanie’s organization used enhanced pre-quantitative T1 (QT1) scanning to detect QT1 prolongation in patients with recurrent glioblastoma [7]. T1-Gd was lower in PD group. The reason for this may be PD is accompanied by increased immature microvessels, increased local water content, and prolonged retention time of gadolinium, which is a paramagnetic substance that can shorten the T1 relaxation time of tissues [8], and the T1-Gd value of PD decreases more. In addition, tumor cells invade the BBB, and the vascular permeability increases, which in turn causes blood and other components to penetrate into the extravascular or extracellular space, and the gadolinium injection leaks significantly, and T1-Gd quantifies the degree of destruction of the BBB [9]. The ADC value reflects the ability of water molecules to diffuse in different tissues, and the stronger the diffusion ability, the higher the ADC value. In PD, tumor cells are enlarged, densely arranged, and the diffusion movement of water molecules inside and outside the cell is limited, and ADC values decrease. PsP of intracellular and extracellular water molecule diffusion is not as limited as PD, and ADC values are higher [10].Conclusion
We have demonstrated that relaxometry parameters derived from synthetic MRI contributed to the discrimination of PsP from PD. The combination of MUSE-DWI is more effective in differentiating glioma PD from PsP.Acknowledgements
Thanks to the General Hospital of Ningxia Medical University.References
[1] Louis D N, Perry A, Wesseling P, et al. The 2021 WHO Classification of Tumors of the Central Nervous System: a summary[J]. Neuro-Oncology, 2021,23(8):1231-1251.DOI:10.1093/neuonc/noab106.
[2] Qin D, Yang G, Jing H, et al. Tumor Progression and Treatment-Related Changes: Radiological Diagnosis Challenges for the Evaluation of Post Treated Glioma[J]. Cancers, 2022,14(15): 3771.DOI:10.3390/cancers14153771.
[3] Wu X, Liang X, Wang X, et al. Differentiating high-grade glioma recurrence from pseudoprogression: Comparing diffusion kurtosis imaging and diffusion tensor imaging[J]. European Journal of Radiology, 2021,135: 109445.DOI:10.1016/j.ejrad.2020.109445.
[4] Ellingson B M, Wen P Y, Cloughesy T F. Modified Criteria for Radiographic Response Assessment in Glioblastoma Clinical Trials[J]. Neurotherapeutics, 2017,14(2):307-320.DOI:10.1007/s13311-016-0507-6.
[5] Lee J, Wang N, Turk S, et al. Discriminating pseudoprogression and true progression in diffuse infiltrating glioma using multi-parametric MRI data through deep learning[J]. Scientific Reports, 2020,10(1).DOI:10.1038/s41598-020-77389-0.
[6] Dastmalchian S, Kilinc O, Onyewadume L, et al. Radiomic analysis of magnetic resonance fingerprinting in adult brain tumors[J]. European Journal of Nuclear Medicine and Molecular Imaging, 2021,48(3): 683-693.DOI:10.1007/s00259-020-05037-w.
[7] Lescher S, Jurcoane A, Veit A, et al. Quantitative T1 and T2 mapping in recurrent glioblastomas under bevacizumab: earlier detection of tumor progression compared to conventional MRI[J]. Neuroradiology, 2015,57(1): 11-20.DOI:10.1007/s00234-014-1445-9.
[8] Müller A, Jurcoane A, Kebir S, et al. Quantitative T1‐mapping detects cloudy‐enhancing tumor compartments predicting outcome of patients with glioblastoma[J]. Cancer medicine (Malden, MA), 2017,6(1):89-99.DOI:10.1002/cam4.966.
[9] Hattingen E, Muller A, Jurcoane A, et al. Value of quantitative magnetic resonance imaging T1-relaxometry in predicting contrast-enhancement in glioblastoma patients[J]. Oncotarget, 2017,8(32): 53542-53551.DOI:10.18632/oncotarget.18612.
[10] Werner J, Stoffels G, Lichtenstein T, et al. Differentiation of treatment-related changes from tumour progression: a direct comparison between dynamic FET PET and ADC values obtained from DWI MRI[J]. European Journal of Nuclear Medicine and Molecular Imaging, 2019,46(9): 1889-1901.DOI:10.1007/s00259-019-04384-7.
Figures