1571
Relative CBV Combined with Mean ADC in Assessing the Differential Between Glioblastoma and Primary Cerebral Lymphoma1Department of Radiology, Longyan First Hospital, Longyan, China, 2Philips Healthcare, Guangzhou, China, 3Philips Healthcare, Shanghai, China
Synopsis
Keywords: Tumors, Cancer
To further evaluate the efficacy of MRI in the differential diagnosis of glioblastoma (GBM) and primary cerebral lymphoma (PCL), this study retrospectively analysed rCBV and mADC-related data from patients with GBM and PCL and performed a quantitative comparison. The rCBV and mADC values were found to be significantly higher in the GBM group than in the PCL group. We diagnosed GBM when rCBV >23.2900 ml/100g or mADC >0.6550×10⁻³mm2/s, and the corresponding sensitivity, specificity, and predictive values were all high. This demonstrates the important clinical value of the combined application of mADC and rCBV for the definitive diagnosis of brain tumours.Objective
Glioblastoma (GBM) and primary cerebral lymphoma (PCL) are partially similar in MRI morphology, but the treatment and prognosis for the two tumors are different [1-3]. The treatment of GBM is preferred to surgical resection at maximum safety, followed by radiotherapy, whereas PCL is usually treated with chemotherapy and whole-brain radiotherapy [3]. The use of non-invasive magnetic resonance for accurate imaging of both tumors is therefore of great clinical value in determining subsequent treatment options and assessing prognosis. In this study, MRI data from GMB and PCL patients were collected, and quantitative analyses of relative cerebral blood volume (rCBV) and mean apparent diffusion coefficient (mADC) were performed to investigate the utility of these two parameters in the assessment of GBM and PCL. The difference between the combination of these two parameters in the assessment of GBM and PCL was investigated. It was intended to improve the differential diagnosis of GBM and PCL through MRI functional imaging.Materials and methods
Patients diagnosed with GMB (24 cases) and PCL (27 cases) from November 2009 to February 2020 were enrolled in this retrospective study. All patients underwent whole brain MRI including axial T1WI, T2WI, T2FLAIR, DWI, DSC-PWI using a Philips Achieva 3.0T MR scanner and a 16-channel head coil. ADC maps and DSC-PWI images were transported to Philips Intelli-Space Portal Workstation (version 7.5.6) for analysis: (1) Three regions of interest (ROIs) were taken in each of the parenchymal regions of the tumor and the maximum, minimum, and mean values (in 10-3mm2/s) of the ADC maps were measured. (2) Compute the DSC-weighted cerebral perfusion scan parameters: rCBV (in ml/100g), relative cerebral blood flow (rCVF), mean transit time (MTT), and time to peak (TTP), and obtain the corresponding perfusion pseudo-color maps. The ROIs were copied from the ADC maps, and the maximum value of rCBV was taken. The relevant data obtained were statistically analyzed using SPSS 20.0 software, and the rCBV and mADC of GBM and PCL were compared using the Mann-Whitney U test. receiver operating characteristic (ROC) curves and logistic regression were used to assess their diagnostic performance. A p-value < 0.05 was considered statistically significant.Results
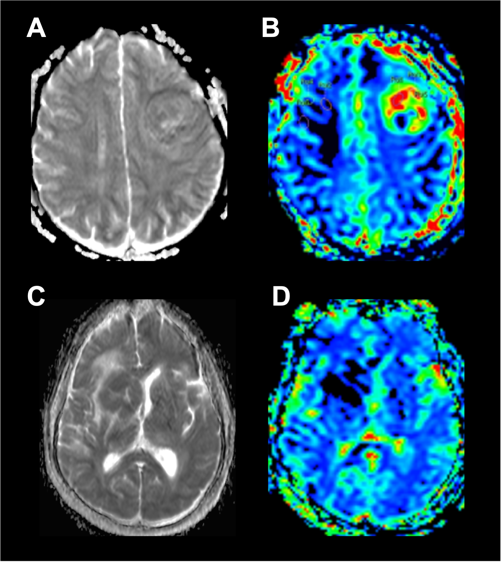
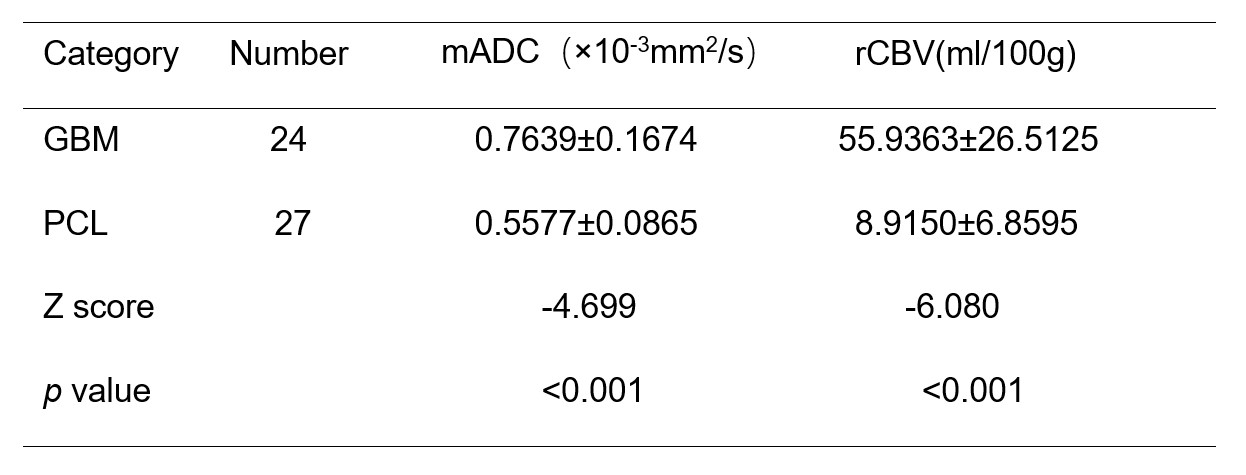
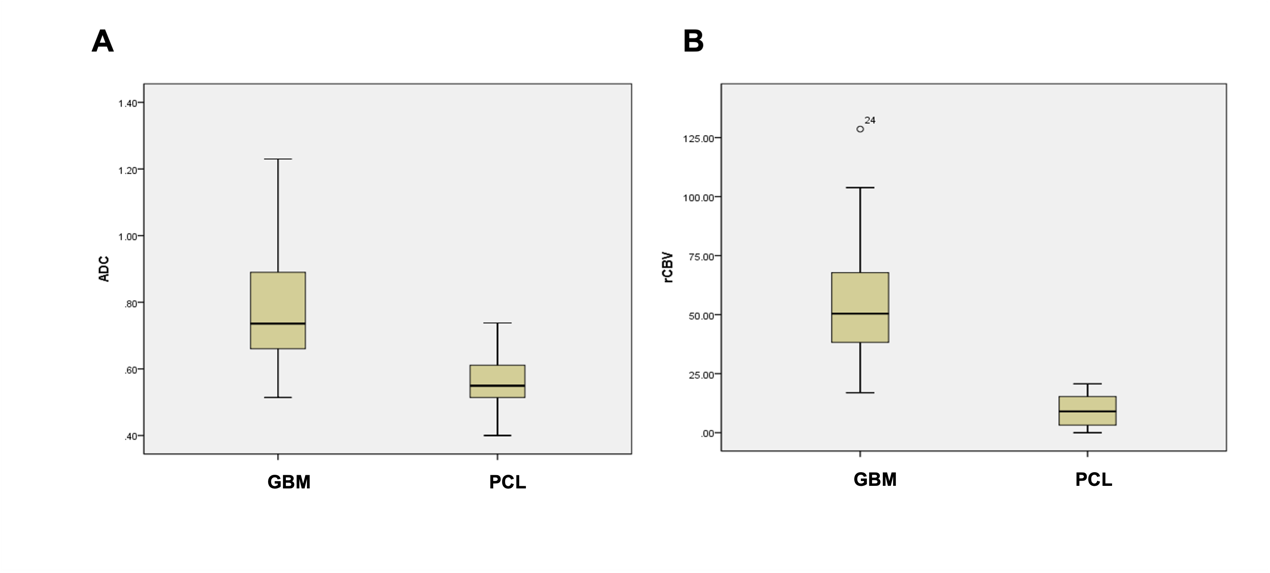
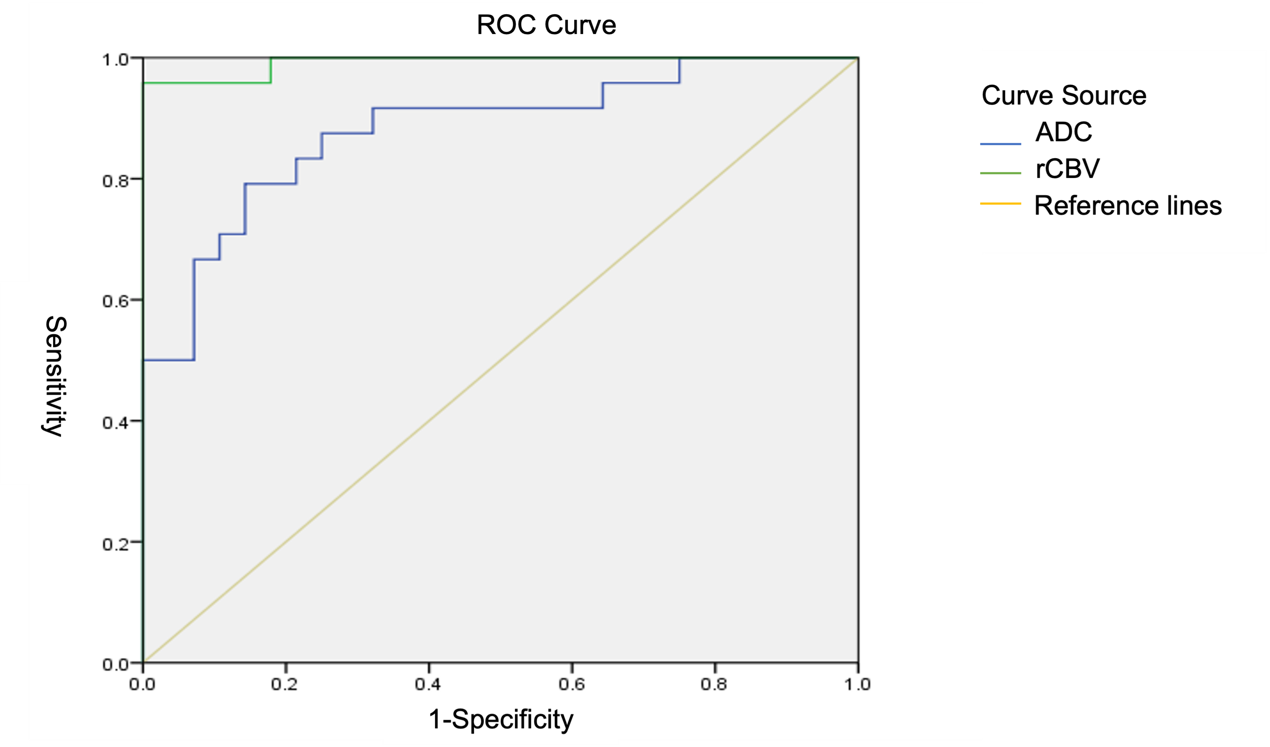
The GBM and PCL groups behaved differently in ADC and DSC-DWI images (Figure 1), and the differences were statistically significant (all p<0.01). rCBV was significantly higher in the GBM group than in the PCL group (Z=-6.080, p<0.001), and mADC was higher in the GBM group than in the PCL group (Z=-4.699, p< 0.001) (Table 1, Figure 2). A binary logistic regression model was constructed for the GBM and PCL groups, with mADC and rCBV as covariates, and the model chi-squared value was 63.976 with a p-value < 0.001, Hosmer-Lemeshow test p=0.999>0.05, which represented a good fit. In terms of discriminating GBM group from PCL group using rCBV, a cutoff value of >23.2900 ml/100g resulted in a sensitivity of 95.8%, specificity of 100%, a positive predictive value of 100%, a negative predictive value of 96.6%, and an accuracy of 98.1%. To discriminate GBM group from PCL group using mADC, a cutoff value of >0.6550 x 10⁻³ mm2/s resulted in a sensitivity of 79.2%, a specificity of 85.7%, a positive predictive value of 82.6%, a negative predictive value of 82.8% and an accuracy of 82.7% (Figure 3).Disscuion
In this study, the mADC value was significantly higher in the GBM group than in the PCL group, mADC>0.6550×10⁻³mm2/s were diagnostic of GBM. This difference was due to the combination of differences in the morphological size, arrangement, and intercellular space of the two tumors [4]. PCL is predominantly a mounding growth with clear demarcation between the tumor margin and normal tissue, whereas GBM is predominantly an infiltrative growth with unclear demarcation between the tumor margin and normal tissue [4]. Additionally, rCBV>23.2900 ml/100g was indicative of GBM. This is because GBM is a vascular-rich tumor compared with PCL, which is a less vascular tumor. Its pathological histology shows marked necrosis and microvascular proliferation in the "glomerular plexus", and the proliferation of endothelial cells in the basement membrane is intact [5], as shown by the marked increase in perfusion and rCBV values in the DSC-PWI. This is consistent with the previous findings of Wu et al [6]: rCBV values were positively correlated with the microvessel density and vascular endothelial growth factor expression of the tumor.Previous studies have shown that mean ADC and mean rCBV values show the best diagnostic performance in diagnosing patients with glioblastoma and PCNSL [2,7,8]. After further fitting analysis of the binary logistic regression models constructed for the GBM and PCL groups (p=0.999), our conclusions showed that the combined application of DWI and DSC-PWI improved the diagnostic efficacy of GBM and PCL, which is consistent with the findings of Choi et al [9]. The combined application of techniques can effectively improve the deficiencies in diagnostic efficacy caused by the shortcomings of a single technique.
Conclusions
mADC and rCBV can yield high sensitivity, specificity, positive predictive values, and negative predictive values in assessing the differential between GBM and PCL and can be used as important reference markers for non-invasive imaging.Acknowledgements
No acknowledgement found.References
1. Louis DN,Perry A,Reifenberger G,et al. The 2016 World Health Organization Classification of Tumors of the Central Nervous System:a summary.Acta Neuropathologica ,2016,131(6):803-820.
2. Kickingereder P,Wicstler B, Sahm F, et al.Primary central nervous system lymphoma and atypical gliobastoma:multiparametric differentiation by using diffusion-,perfusion-,and susceptibility-tibilityweighted MR imaning.Radilolgy,2014,272(3):843-850.
3. The value of apparent diffusion coefficient in the diferentiating diagnosis between primary central nervous system lympgoma and glioblastoma.Chin J Magn Reson Imaging,2018,9(5):334-339.
4. Lu S,Weng S,Gao Q,et al.Quantitative Evaluation of Diffusion and Dynamic contrast-Enhanced Magnetic Resonance Imaging for Differentiation Between Primary Central Nervous System Lymphoma and Glioblastoma. J Comput Assist Tomogr. 2017,41(6):898-903.
5. LIN Qi,DENG Yanfang,QIU Qingxiang,et al.Clinical value of dynamic sueceptibility-weghted contrast-enhanced MR perfusion-weighted imaging in brain astrocytoma grading,Funct Mol Imaing,2016,5(2):9-12.
6. WU Honglin,QIAN Nong, CHEN Junkun,et al.Comparative study among prefusion MR imaging and molecular pathological findings of gliomas. Journal of clinical radiology,2006,25(2):112-116.
7. Ji xueman,LU Guangming,AHANG Zongjun,et al.Comparative study of perfusion MR imaging in primary cerebral lymphomas and high grade gliomas. Journal of clinical radiology,2008,27(9):1155-1158.
8. LI Xingyu. Contrast study of MR perfusion imaging between primary brain lymphoma and advanced brain glioma,Modern medical imaging,2017,26(5):1302-1303.
9. Choi YS,Lee HJ,Ahn SS,et al.Primary central nervous system lymphoma and atypical glioblastoma:differentiation using the initial area under the curve derived from dynamiccontrast-enhancecd MR and the apparent diffusion coefficient,Eur Radiology,2017,27(4):1344-1351.
Figures