1566
Ternary plot method for presenting information acquired by OGSE and PGSE sequences: Evaluation of the peritumoral area in malignant glioma1Department of Innovative Biomedical Visualization (iBMV), Nagoya University, Nagoya, Japan, 2Radiology, Nagoya University, Nagoya, Japan, 3Division of Radiology, Nagoya University Hospital, Nagoya, Japan, 4Canon Medical Systems Corporation, Otawara, Japan, 5SORD Corporation, Chiba, Japan
Synopsis
Keywords: Tumors, Diffusion/other diffusion imaging techniques, OGSE
The characteristics of tissue structures can be estimated by comparing images with different diffusion times acquired using the OGSE and PGSE methods. However, for multiple images, it is difficult to make pixel-by-pixel comparison. We attempted a method for integrating the pixel values of these images using ternary plotting for malignant glioma cases. Tumor areas with abnormal enhancement, peritumoral abnormal signal areas, and distant edematous areas were evaluated. The ternary plot provided immediate visual information. It also highlighted similarities in the tissue characteristics of the tumor, with enhancement to the peritumoral area showing abnormal signals.Purpose
This study evaluated the usefulness of a method to integrate and present the pixel value of oscillating gradient spin-echo (OGSE) images, pulsed gradient spin-echo (PGSE) images, and b=0 images using ternary plots for malignant glioma cases. The three axes of the ternary plot were (1) apparent diffusion coefficient (ADC) by OGSE images (OGSE-ADC), which reflects substrate viscosity; (2) signal ratio of PGSE and OGSE images (PGSE/OGSE ratio), which reflects the degree of spatial diffusion restriction by tissue microstructure; and (3) signal value on b=0 images (b0), which reflects the tissue water content. Integrated information of the ROIs in the tumor areas with abnormal enhancement (TCE), the peritumoral abnormal signal areas (PT), and distant edematous areas (DE) were presented and evaluated in the location within the ternary plots in comparison with the normal thalamus (Th) and lateral ventricle (LV). On the ternary plots, similarities of the tissue characteristics of the PT to the TCE and DE were evaluated by distribution and overlapping of the groups of plots.Subjects and Methods
This retrospective study was approved by the institutional review board of our hospital. This study included 12 patients with malignant glioma (6 men, 6 women; age range, 7–84 years). In addition to conventional images including FLAIR and contrast-enhanced T1 weighted images, OGSE and PGSE images were acquired using a 3 T clinical scanner (Vantage Centurian, Canon Medical Systems, Tochigi, Japan). The images were obtained using echo planar imaging (TR = 6200 ms, TE = 120 ms, motion-probing gradient = monopolar type, b value = 0 and 1000 s/mm2, slice thickness = 5 mm, FOV = 220 mm, and matrix = 128 × 160). For PGSE, the diffusion time (Tdiff) was 60 ms. For OGSE, the Tdiff was 6.94 ms, with an oscillation frequency of 44 Hz.From the acquired OGSE and PGSE images, OGSE-ADC images and PGSE/OGSE ratio images were calculated (Figure 1). The b0 images were loaded to the "RIAA tool", an in-house software that generated ternary plots from DICOM images. For the RIAA tool, ROIs were placed in the TCE, PT, DE, Th, and LV. On the ternary plots generated by the RIAA tool, the TCE, PT, and DE plots were evaluated for the distribution and existence of overlaps between the groups (Figure 2).
Results
In the ternary plots, each tissue was depicted as a different distribution according to three different parameters, including b0, OGSE-ADC, and PGSE/OGSE ratio. In all cases, the PGSE/OGSE ratio showed higher values in the order of TCE, PT, and DE. Conversely, the OGSE-ADC values showed lower values in the order of TCE, PT, and DE. Overlapping of the ternary plots was seen in 5 of the 12 cases for TCE and PT, and in 4 of the 12 cases for PT and DE. In contrast, there were no cases with overlapping TCE and DE. The overlap of Th and TCE was seen in two cases; the overlap of Th and PT was seen in one case. Moreover, there were no cases of Th and DE. Furthermore, LV, TCE, PT, and DE overlapped in none of the cases.Discussion
Conventionally, diffusion images are acquired over a relatively long diffusion time using the PGSE method. Recently, the OGSE method, an imaging technique that can achieve a short diffusion time, has attracted attention. The OGSE method can be used to observe the motion of water molecules within a shorter diffusion time than the conventional PGSE method. The combination of OGSE and PGSE diffusion images is useful for distinguishing between the slow diffusion of water molecules owing to the viscous nature of the substrate and spatially restricted diffusion owing to the narrow space in which water molecules can diffuse. Tissue characteristics can be estimated by comparing the OGSE and PGSE diffusion images. However, it is not easy to compare multiple images pixel-by-pixel. We attempted to integrate the pixel value of the OGSE-ADC, PGSE/OGSE, and b=0 images using the ternary plot method to evaluate tissue characteristics, including the viscous nature of the substrate, spatial restriction of diffusion, and water content.In the current study, each tissue was depicted as a different distribution according to the three different parameters as follows. b0 reflects the water content of the tissue. OGSE-ADC reflects the viscosity of the substrate. The PGSE/OGSE ratio reflects the degree of spatial diffusion restriction in the tissue. Overlapping plots were observed between tissues that appeared to have similar characteristics, such as TCE and PT or PT and DE. In contrast, there was no overlap between TCE and DE. This is because TCE and DE are considered to exhibit different histological characteristics.
Conclusion
We evaluated the usefulness of a method for integrating the pixel value of oscillating gradient spin-echo (OGSE) images, pulsed gradient spin-echo (PGSE) images, and b=0 images using ternary plots for malignant glioma cases. In the ternary plots, tissues including the tumor areas with contrast enhancement, the peritumoral abnormal signal areas, and distant edematous regions were depicted as a different distribution according to the three different parameters, namely, b0, OGSE-ADC, and PGSE/OGSE ratio. These parameters highlighted the characteristics and structural similarities of the tissues.Acknowledgements
No acknowledgement found.References
1. Ichikawa K, Taoka T, Ozaki M, Sakai M, Yamaguchi H, Naganawa S. Impact of tissue properties on time-dependent alterations in apparent diffusion coefficient: a phantom study using oscillating-gradient spin-echo and pulsed-gradient spin-echo sequences. Jpn J Radiol. 2022 Sep;40(9):970-978.
2. Maekawa T, Hori M, Murata K, Feiweier T, Fukunaga I, Andica C, Hagiwara A, Kamagata K, Koshino S, Abe O, Aoki S. Changes in the ADC of diffusion-weighted MRI with the oscillating gradient spin-echo (OGSE) sequence due to differences in substrate viscosities. Jpn J Radiol. 2018 Jul;36(7):415-420.
Figures
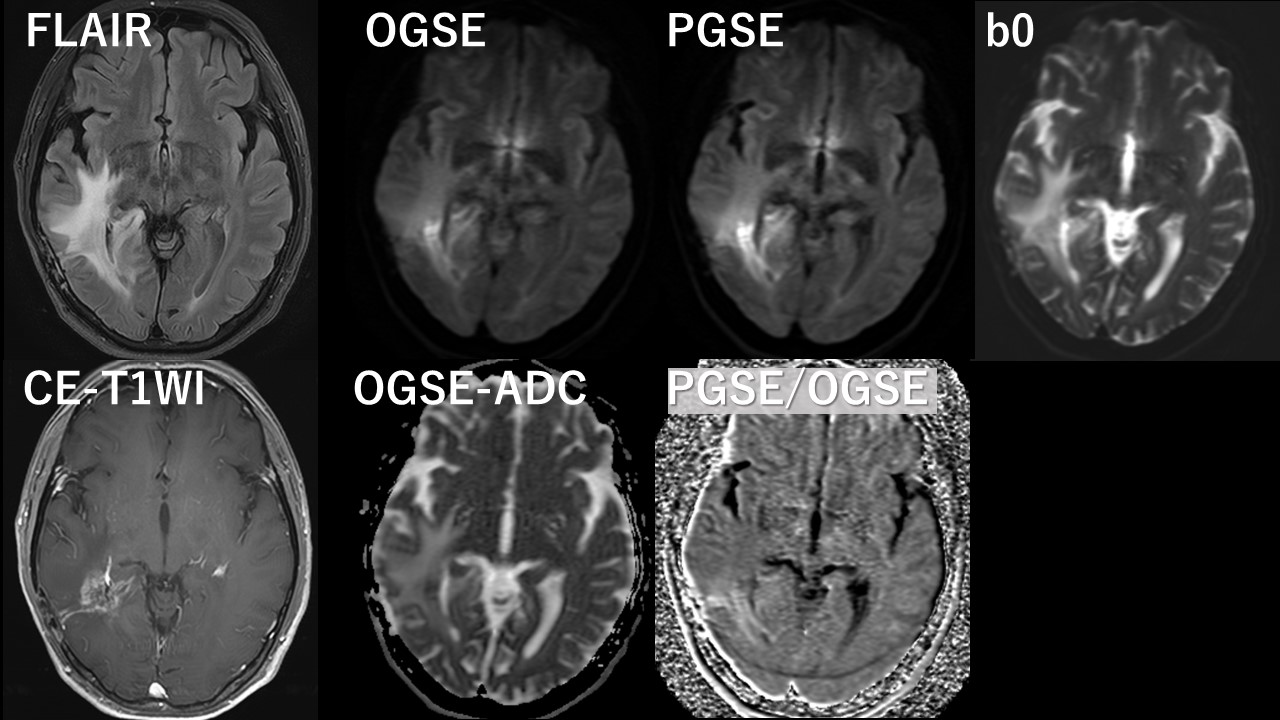
Figure 1: Acquired images and calculated images
FLAIR and contrast-enhanced T1-weighted images depict a malignant glioma with edema in the right occipital lobe. OGSE images (44 Hz, Tdiff = 6.94 ms) and PGSE images (Tdiff = 60 ms) with b = 0 (B0) are shown. From the OGSE and PGSE images, the apparent diffusion coefficient (ADC) of the OGSE images (OGSE-ADC) and the signal ratio of the PGSE and OGSE images (PGSE/OGSE) were calculated. OGSE-ADC reflects the viscosity of the substrate, and PGSE/OGSE reflects the degree of spatial diffusion restriction by the tissue microstructure.
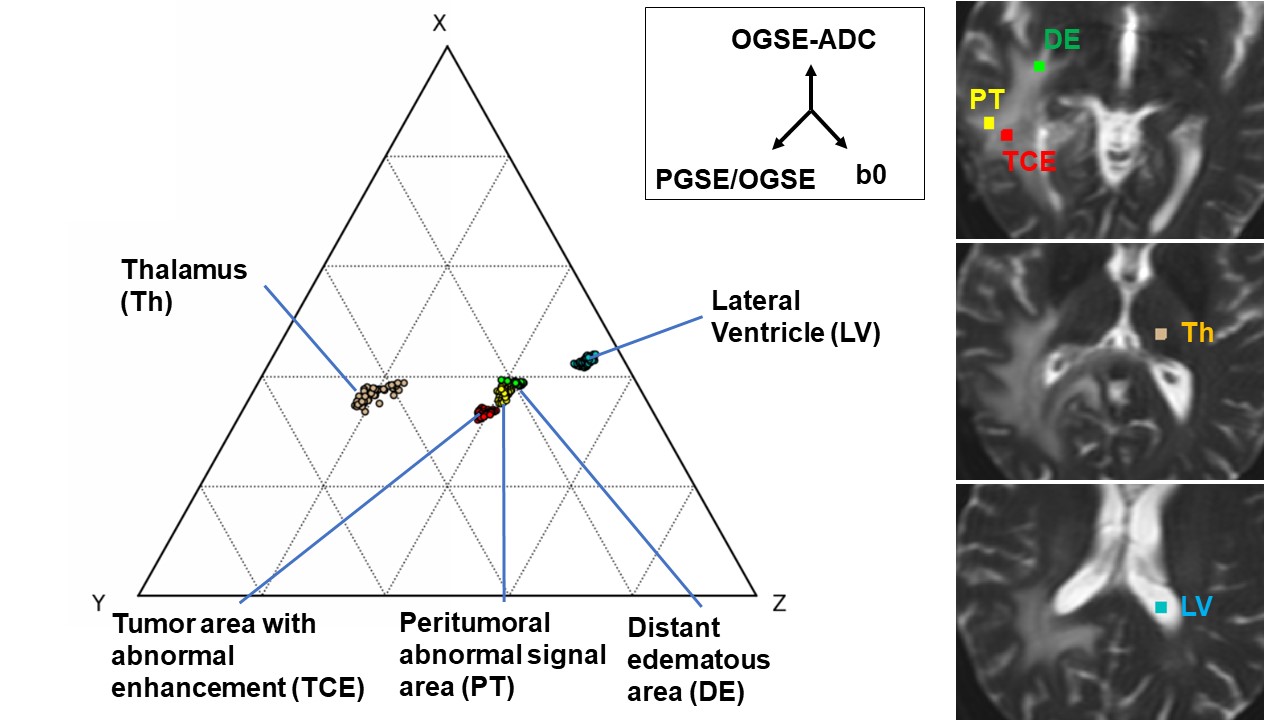
Figure 2: A ternary plot of the OGSE-ADC, PGSE/OGSE, and b0 images.
The ternary plot with the axes of OGSE-ADC, PGSE/OGSE, and b0 is shown. The locations of the ROIs are shown in the images on the right.
On the ternary plot, the PGSE/OGSE ratio shows higher values in the order of TCE, PT, and D. The OGSE-ADC values show lower values in the order of TCE, PT, and DE. Overlapping on the ternary plot is seen between TCE and PT and between PT and DE. As shown, there is no overlap between TCE and DE.