1565
Histogram analysis of Intravoxel incoherent motion (IVIM) in differentiating high-grade glioma and solitary brain metastasis1The Fifth Clinical Medical College of Shanxi Medical University, Taiyuan, China, 2GE Healthcare, MR Research, Beijing, China, 3Department of Neurosurgery, Fifth Hospital of Shanxi Medical University, Taiyuan, China, 4Department of Radiology, Fifth Hospital of Shanxi Medical University, Taiyuan, China
Synopsis
Keywords: Tumors, Cancer, high grade glioma, solitary brain metastasis
We aim to explore the value of intravoxel incoherent motion (IVIM) in differentiating high-grade glioma (HGG) and solitary brain metastasis (SBM) by using histogram and first-order texture analysis in combination with the structural lesion feature. Results showed there were significant higher skewness (Dfast, f) and kurtosis (Dslow, f), and significant lower entropy (Dslow, f) and mean (f) in HGG solid tumor region as well as significant lower mean (f) in HGG peritumoral edema zone. Clear tumor margin in T2-weighted imaging help improve the differentiation when integrated with the IVIM parametric values.INTRODUCTION
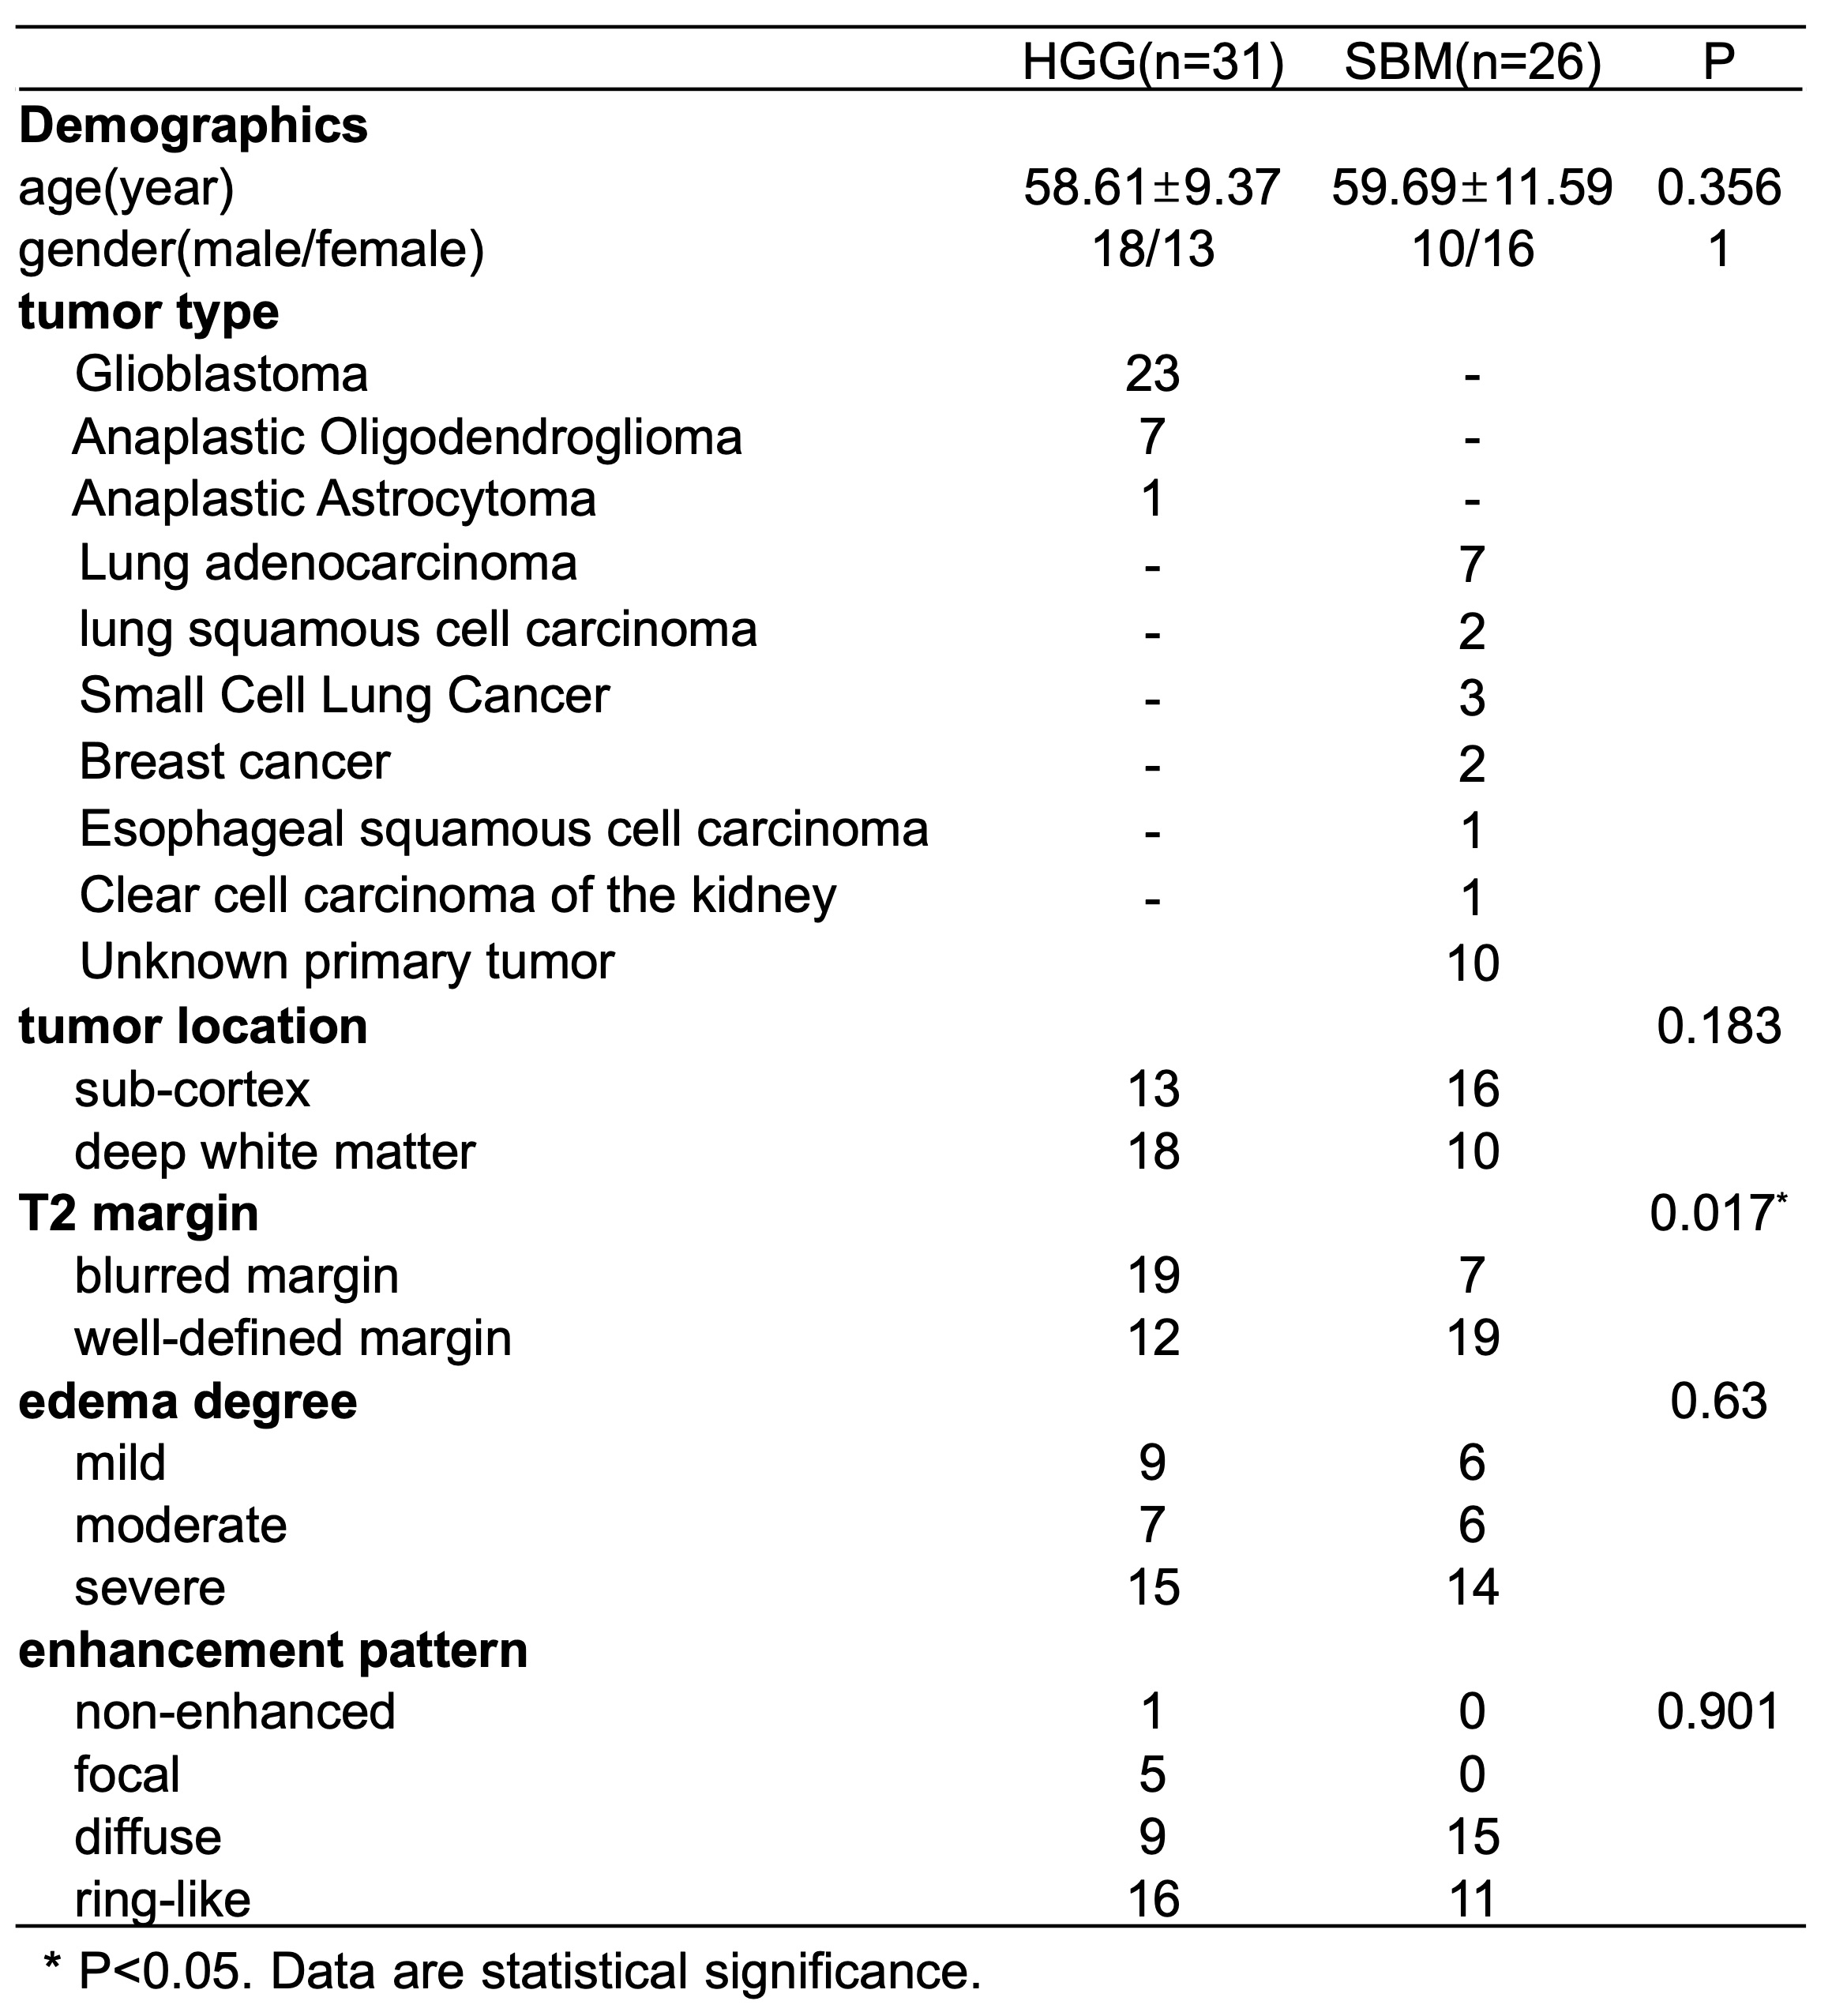
Glioma and brain metastasis are the most common malignant tumors and cause high morbidity and mortality worldwide.1,2 Typically, high-grade glioma (HGG) and solitary brain metastasis (SBM) present as well-defined, ring-enhancing lesions in enhanced T1WI with high signal peritumoral edema in T2WI3. Morphological analysis such as volume of tumor parenchyma or peritumoral edema, midline shift and pattern of the rim in different conventional weighted MR sequences are found to hardly differentiate HGG and SBM.4,5 Histogram and texture analysis based on diffusion-weighted imaging and diffusion kurtosis imaging have shown well performance in differentiating glioblastoma from SBM by measuring the diffusion of water within the tumor region6,7, while few studies focus on the perfusion features. We aim to investigate the value of intravoxel incoherent motion (IVIM) in differentiating these two brain neoplasms in both enhanced tumor region (ETR) and peritumoral edema zone (PTEZ) by using histogram and first-order texture analysis in combination with the morphological features.METHODS
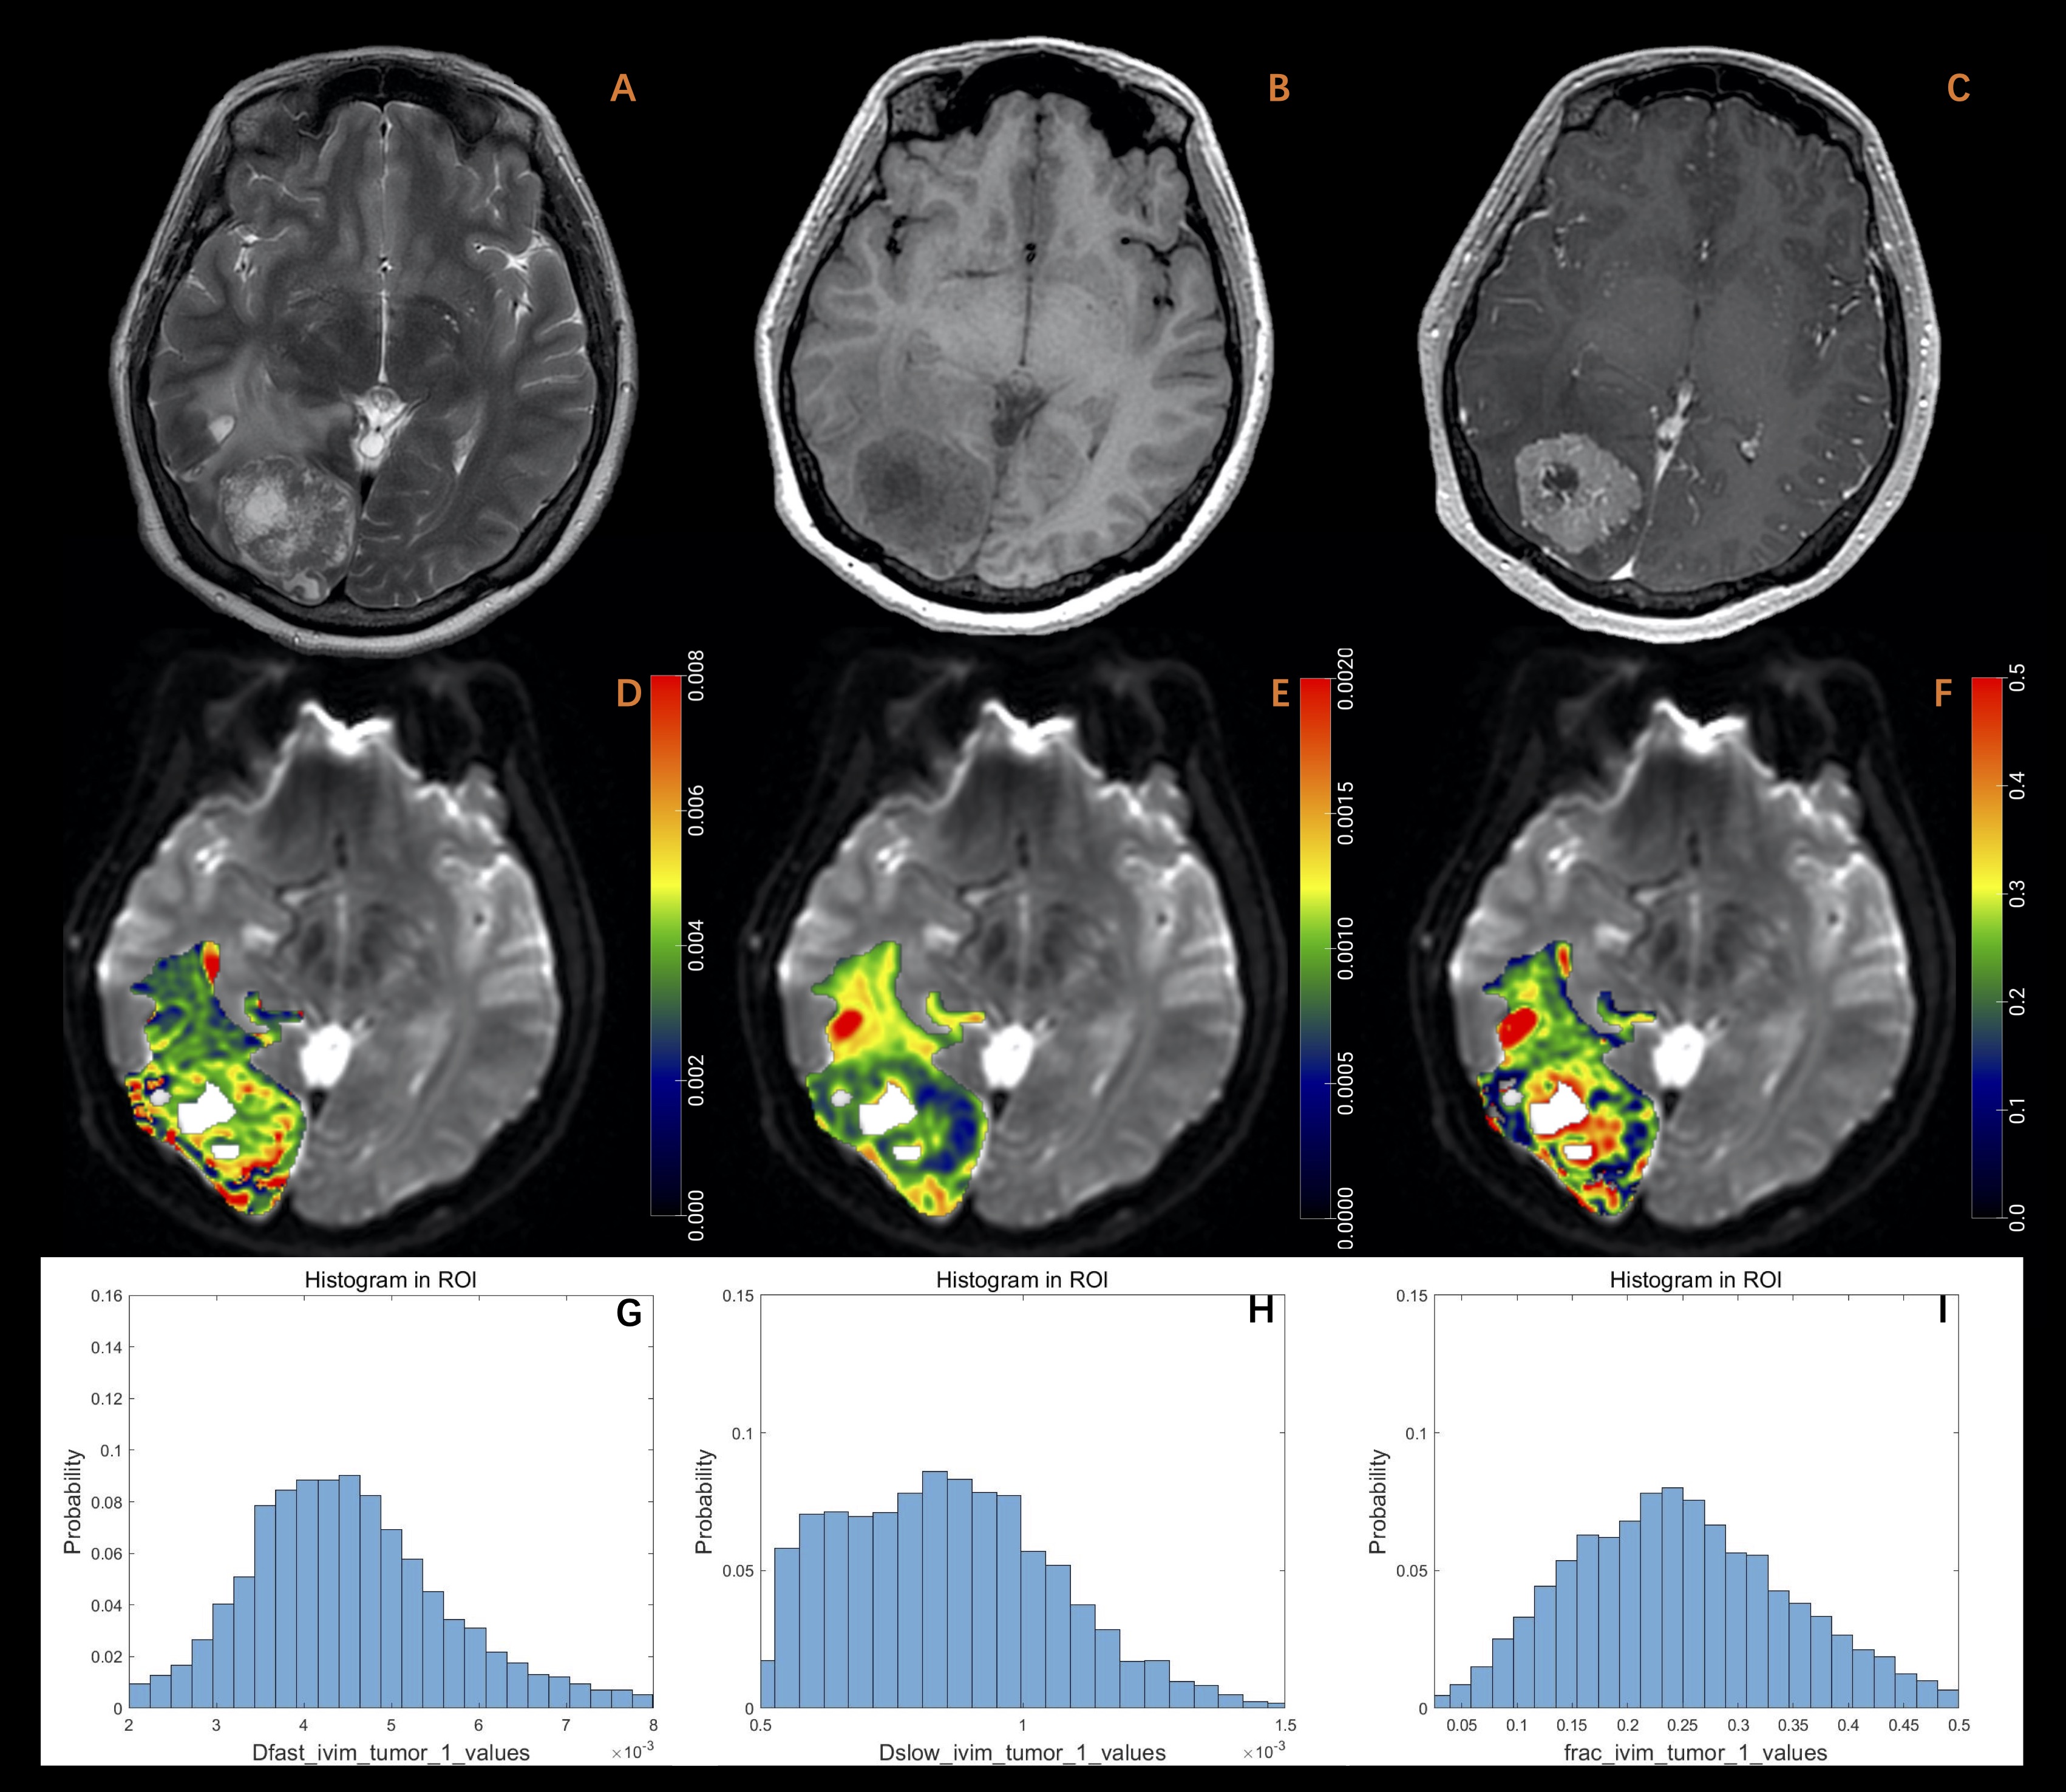
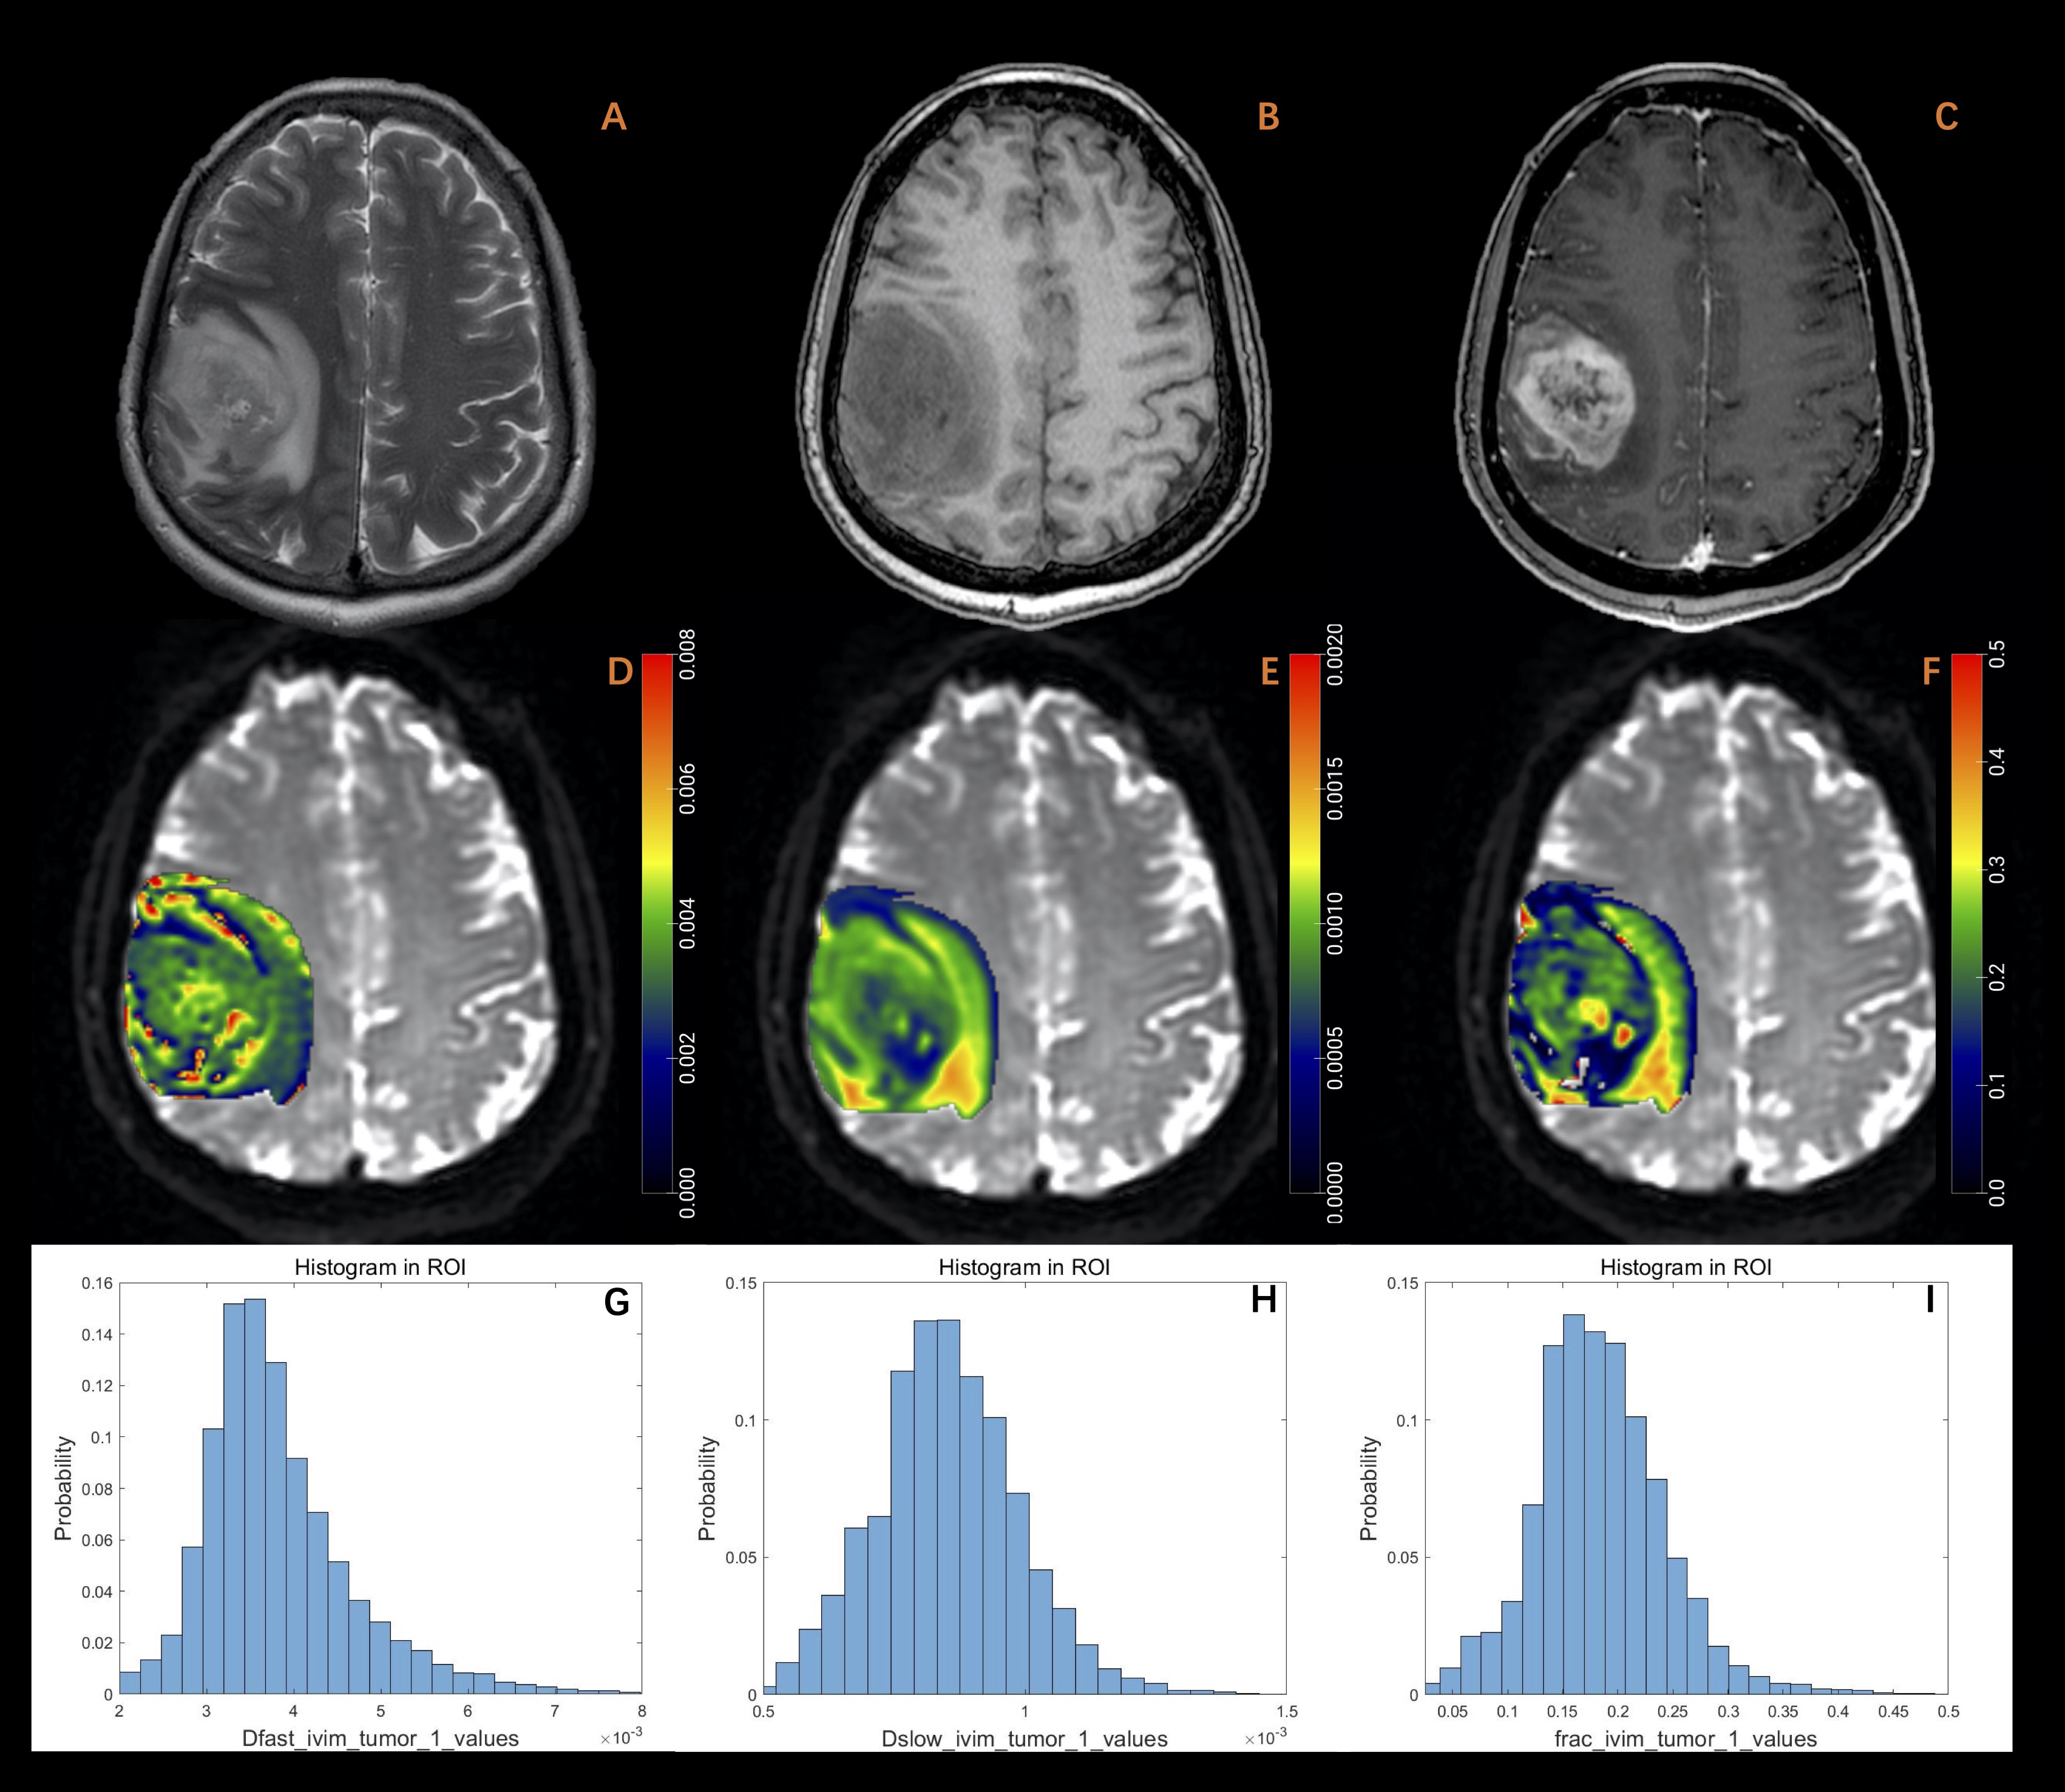
67 patients with newly diagnosed HGG or SBM by pathology ,follow-up or laboratory findings were enrolled and conducted IVIM with 12 b-values (0, 20, 40, 80, 110, 150, 200, 400, 800, 1200, 1500, 2000s/mm2) as well as T1W, T2W, T2FLAIR and enhanced T1W imaging in a 3.0T MR scanner (Discovery MR 750w; GE, Milwaukee, USA) with a 24-channel head neck unit coil. ROIs of PTEZ or ETE were delineated in image of b = 0 s/mm2, using the T2WI and enhanced T1WI as the reference, in 3D-slicer software (https://www.slicer.org/, version 4.10). Structural features such as tumor location, clear tumor margin or not, edema degree and enhancement pattern were all read by the same experienced neuroradiologist. An in-house built program of IVIM bi-exponential fitting in Matlab 2018b was used for the calculation of slow diffusion coefficient (Dslow), fast diffusion coefficient (Dfast) and perfusion fraction (f) within the ROIs. The first-order texture and histogram features of Dslow, f, and Dfast were extracted and compared between HGG and SBM both in the tumor parenchyma and peritumoral edema zone. Receiver operator curves (ROC) analysis was done for diagnostic performance evaluation. R packages were used for all the statistics (version 4.0.0) and P < 0.05 indicated the significant differenceRESULTS
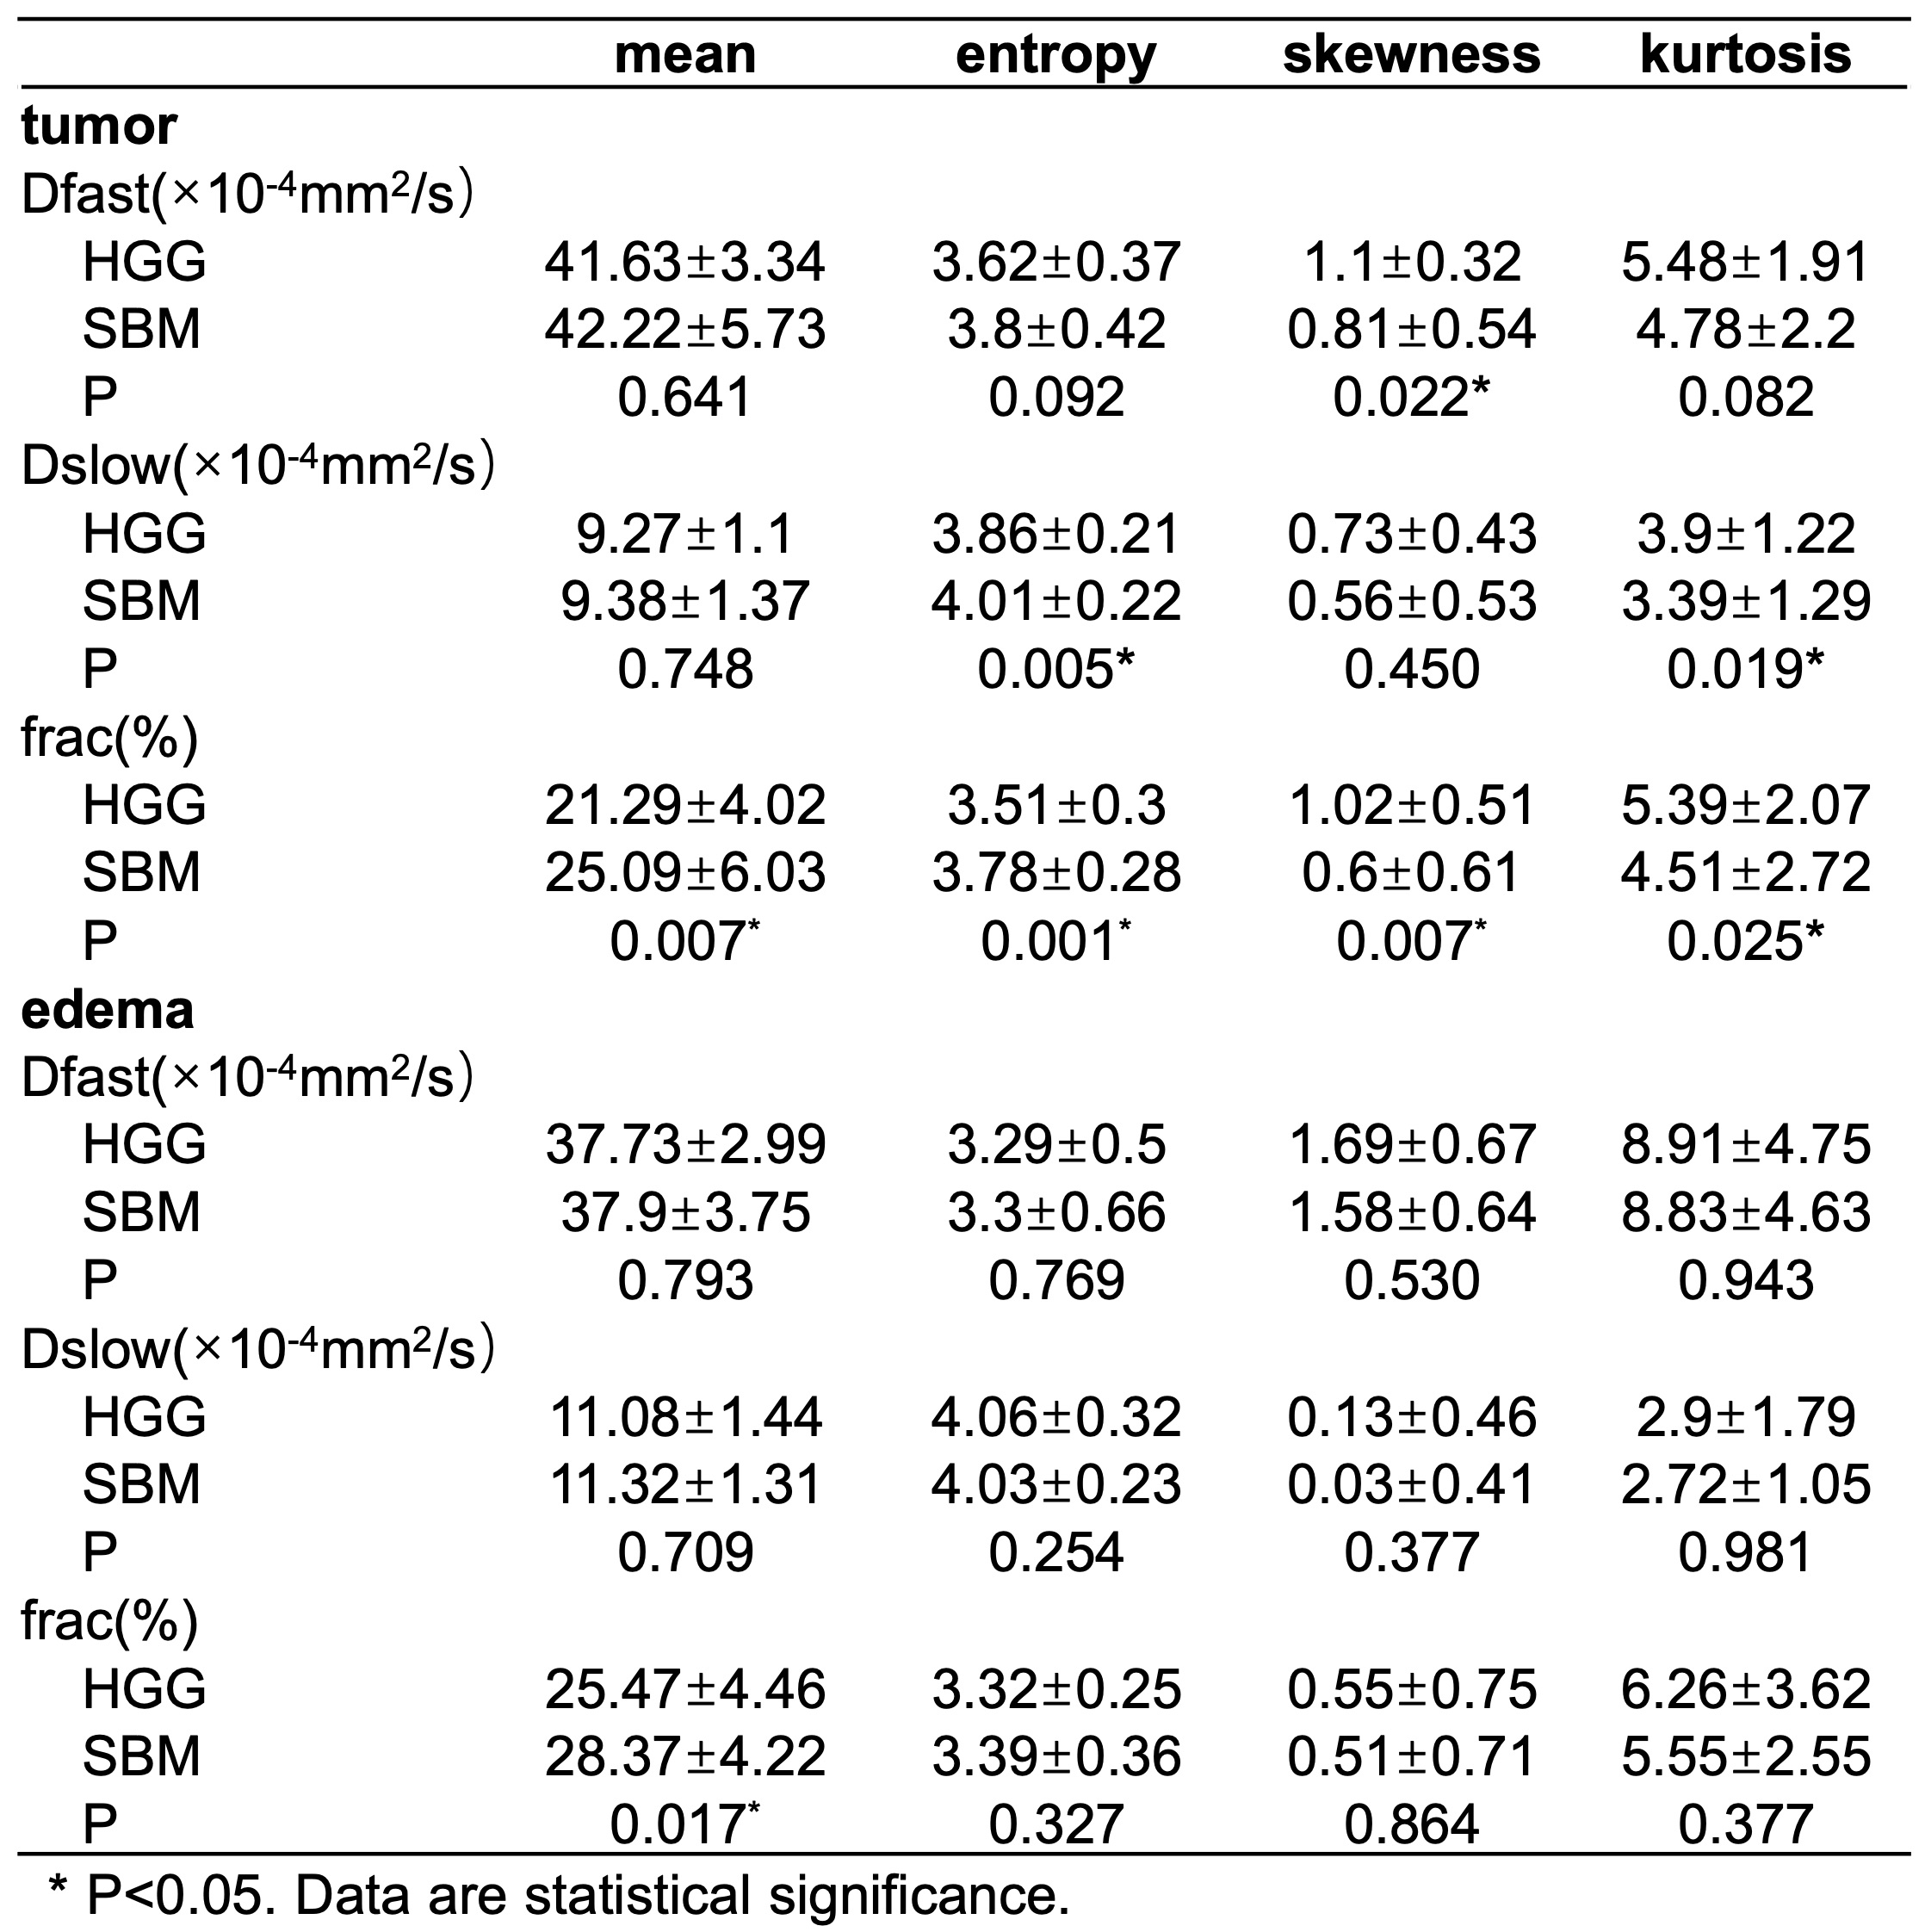
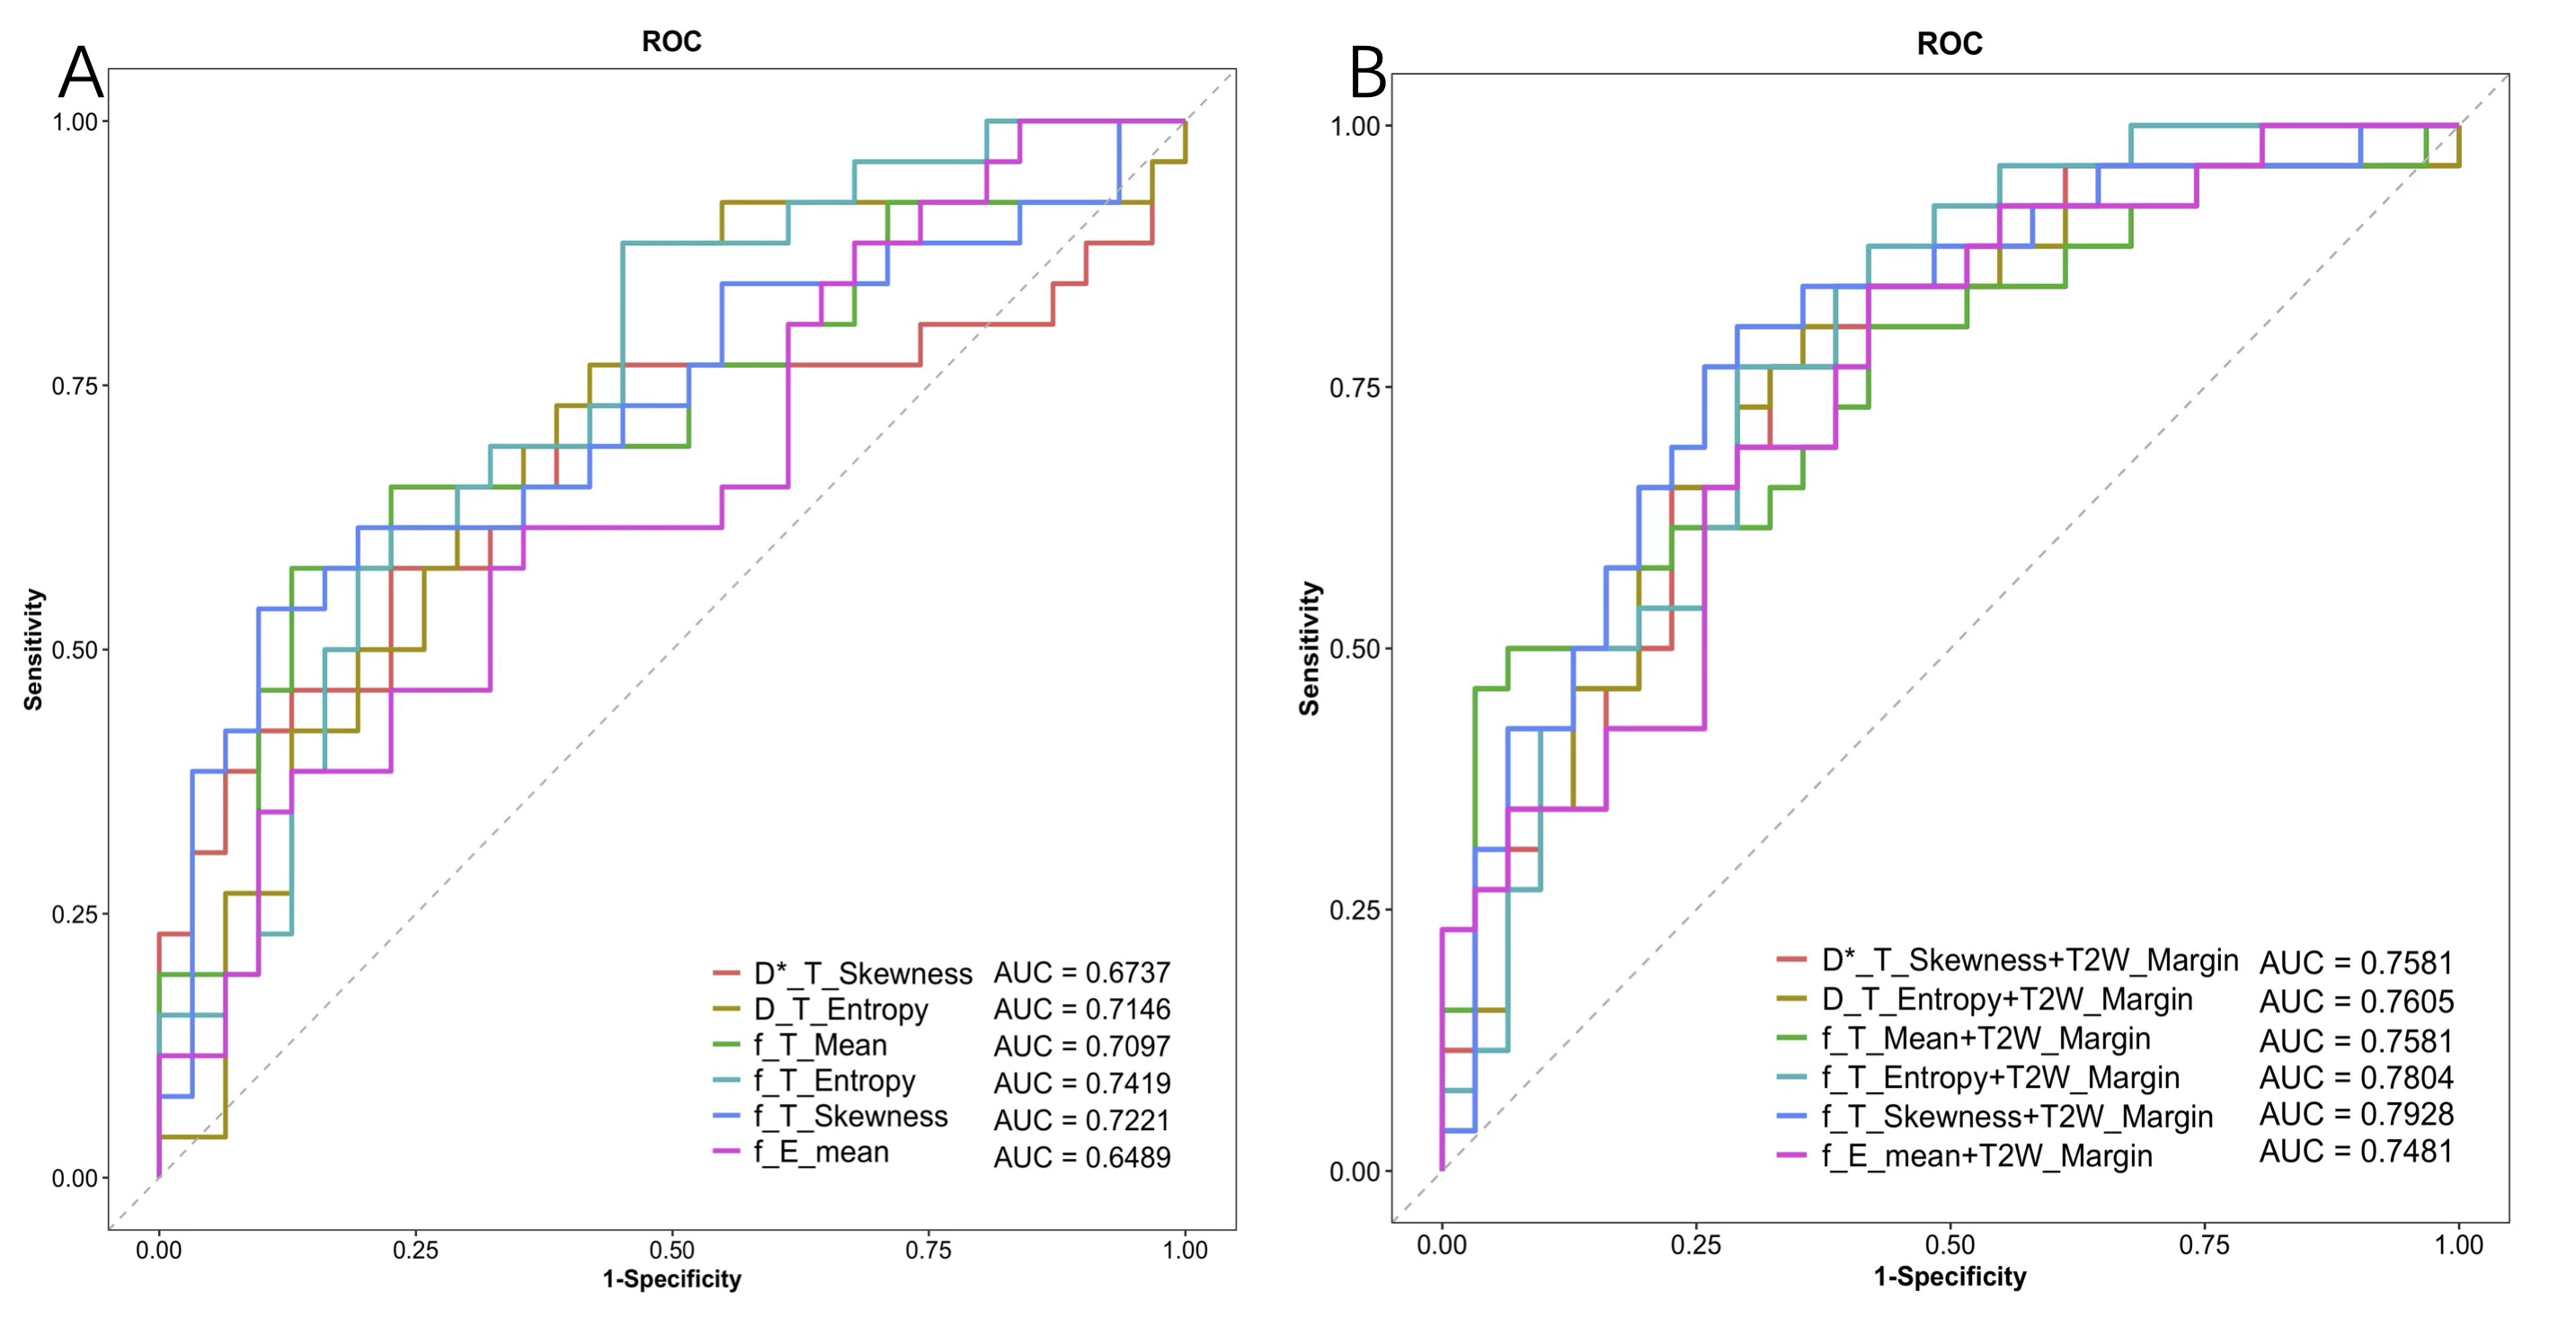
In comparison, clearer tumor margin can be found in SBM in compared with HGG (P=0.017, Table 1). Significant higher skewness of Dfast (P=0.022) and f (P=0.077), kurtosis of Dslow (P=0.019) and f (P=0.025), and significant lower entropy of Dslow (P=0.005) and f (P=0.001) in ETR, and significant lower mean of f in both ETR (P=0.007) and PTEZ (P=0.017) were shown for HGG (Table 2, Figure 1 & 2). Entropy of f in ETR presented the optimal differentiation performance with AUC 0.7419 (Sentivity = 0.88, Specificity = 0.55) in ROC analysis (Figure 3 A). Clear tumor margin help improve the performance with optimal AUC 0.7928 (Sensitivity = 0.81, Specificity = 0.71) when integrated with skewness of f in ETR (Figure 3 B).DISCUSSION
The significant difference in the histogram features (kurtosis, skewness, and entropy) between the IVIM parameters of HGG and SBM enhanced tumor region indicates the differentia of diffusion and perfusion heterogeneity of the two tumors, which provid more valuable information than mean value. Higher Dfast, Dslow, and f kurtosis and skewness in HGG ETR indicate that the distribution of diffusion and perfusion in the tumor region is more concentrated than that of SBM, as can be observed from the histograms in Figure 1 (SBM) and Figure 2 (HGG), which also corresponds to the lower entropy of Dslow and f of HGG. Only mean of f showed a difference between HGG and SBM in PTEZ, but the differential performance was lower than that of ETR. Finally, we found that combining clear margin on the T2W image and f of the tumor area obtained the best HGG and SBM differentiation performance.CONCLUSION
Histogram features, including skewness, kurtosis and entropy of IVIM diffusion and perfusion quantification in enhanced tumor region provided valuable information for differentiation of high-grade glioma from solitary brain metastasis. And a clear tumor margin on T2WI helps improving the diagnostic performance.Acknowledgements
This study was funded by The 5G big Data Analysis and Artificial Intelligence Engineering Research Center for stroke in Shanxi and the Basic Research Plan of Shanxi Province in 2021(No.20210302123428).References
1. K.D. Miller, Q.T. Ostrom, C. Kruchko, et al. Brain and other central nervous system tumor statistics, 2021, CA Cancer J Clin 71(5) (2021) 381-406.
2. P. Sacks, M. Rahman, Epidemiology of Brain Metastases, Neurosurg Clin N Am 31(4) (2020) 481-488.
3.J. Faehndrich, S. Weidauer, U. Pilatus, et al. Neuroradiological viewpoint on the diagnostics of space-occupying brain lesions, Clin Neuroradiol 21(3) (2011) 123-39.
4. K.M. Schwartz, B.J. Erickson, C. Lucchinetti, Pattern of T2 hypointensity associated with ring-enhancing brain lesions can help to differentiate pathology, Neuroradiology 48(3) (2006) 143-149.
5.M.M. Baris, A.O. Celik, N.S. Gezer, et al, Role of mass effect, tumor volume and peritumoral edema volume in the differential diagnosis of primary brain tumor and metastasis, Clinical Neurology and Neurosurgery 148 (2016) 67-71.
6.E. Gao, A. Gao, W. Kit Kung, et al. Histogram analysis based on diffusion kurtosis imaging: Differentiating glioblastoma multiforme from single brain metastasis and comparing the diagnostic performance of two region of interest placements, Eur. J. Radiol. 147 (2022) 110104.
7. G. Zhang, X. Chen, S. Zhang, et al. Discrimination Between Solitary Brain Metastasis and Glioblastoma Multiforme by Using ADC-Based Texture Analysis: A Comparison of Two Different ROI Placements, Acad. Radiol. 26(11) (2019) 1466-1472.
Figures