1561
Quantitative Magnetic Resonance Imaging to Quantify the Macro and Microstructural Changes in Normal and Pediatrics with Spinal Cord Injury
Shiva Shahrampour1, Mahdi Alizadeh1, Devon Middleton1, Benjamin De Leener2, Laura Krisa1, Adam E. Flanders3, Scott H. Faro3, Julien Cohen-Adad2, MaryJane Mulcahey1, and Feroze B. Mohamed1
1Thomas Jefferson University, Philadelphia, PA, United States, 2Polytechnique Montréal, Montreal, QC, Canada, 3Thomas Jefferson University Hospital, Philadelphia, PA, United States
1Thomas Jefferson University, Philadelphia, PA, United States, 2Polytechnique Montréal, Montreal, QC, Canada, 3Thomas Jefferson University Hospital, Philadelphia, PA, United States
Synopsis
Keywords: Spinal Cord, Pediatric
Spinal Cord Injury (SCI) in the pediatric population is relatively rare but carries significant psychological and physiological consequences. Advanced qMRI techniques has shown promising results to evaluate spinal cord integrity at a macro and microstructural level.Introduction:
Lack of clarity about the neurological consequence of spinal cord injury (SCI) in children causes speculation about diagnoses and treatment effectiveness. This study aims to compare macrostructural and microstructural neurodegenerative changes remote from a spinal cord injury lesion in children with SCI using quantitative magnetic resonance imaging (qMRI). In this work, various measures including diffusion metrics, whole cord cross sectional area (CSA), white matter (WM) CSA, gray matter (GM) CSA, and T2* WM/GM intensity ratios were assessed and compared between patients and typically developing (TD) population. We hypothesize that the observed macro and microstructural changes in those regions of the cord can provide insights into the full extent of injury.Methods:
Fifteen SCI patients (AIS A-D, mean age of 12.8 ± 3.1) and fifteen TD children (mean age 13.4 ± 2.3) were recruited. The scans were obtained using a 3T Verio MRI scanner (Siemens). To scan both cervical and thoracic spinal cord, all subjects underwent T2-w (SPACE; Siemens) and T2*-w (MEDIC, Siemens) scans followed by axial diffusion-weighted scans. Imaging parameters for each sequence is as follows: T2-w sequence: voxel size = 1 × 1 × 1 mm3, TR = 1500 ms, TE = 122 ms, flip angle = 140°, number of averages = 2, and acquisition time = 3 minutes and 17 seconds (for each overlapping slab). T2*-w sequence: FOV= 159 × 159 mm2, Matrix size=384 × 384, TR= 878 ms, TE=7.8 ms , flip angle=25°, read-out bandwidth= 280 Hz per pixel and the acquisition time = 2 minutes and 7 seconds. The diffusion scan parameters: FOV = 164 mm, phase FOV = 28.4% (47 mm), 3 averages of 20 diffusion directions, 6 b = 0 acquisitions, b = 800 s/mm2, voxel size = 0.8 × 0.8 × 6 mm3, number of slices = 40, TR = 7900 ms, TE = 110 ms, acquisition time = 8 minutes and 49 seconds per slab. All patients underwent clinical assessments including the International Standards for Neurological Classification of Spinal Cord Injury (ISNCSCI) protocol for motor score, light-touch, pinprick score and neurological completeness(1). Diffusion tensor imaging (DTI) metrics of FA, MD, RD and AD along with the CSA of the whole cord, WM and GM were quantified at C2-C3 and T2-T3 levels using spinal cord toolbox (SCT)(2). An atlas-based approach was used to extract the DTI metrics in 7 selected WM tracts (right/left corticospinal tract (CST), right/left fasciculus cuneatus (FC), right/left fasciculus gracilis (FG), white matter (WM)). To examines the difference between the two populations, diffusion metrics as well as T2* WM/GM intensity ratios are demonstrated for the tracts using scatter plots. CSA measurements of the WM, GM and the whole cord are shown using violin plots. A two-sample t-test was used to test the effect of all the aforementioned imaging metrics between SCI and TD subjects. Relationships between all the metrics and clinical scores were assessed using Pearson correlation and are presented in correlation matrix.Results:
Results of t-tests showed significant decrease in FA measurements of all the 7 WM tracts in SCI patients when compared to TDs. However MD, AD and RD metrics showed significant increase in SCI subjects (p<0.05) (Figure 1). Significant atrophy was observed in the whole cord, WM and GM of the patients compared to TDs in both upper cervical and upper thoracic measurements (p<0.05) (Figure 2). A significant decrease was also found in T2* WM/GM intensity ratio measurements of the SCI subjects in comparison to TDs (Figure 3). Results of Pearson correlation at C2-C3 level (Figure 4-a), revealed moderate correlation between T2* WM/GM ratio and WM-CSA (r=0.55, p=0.035). FA correlated fairly well with GM-SCA (r=0.59, p=0.019), WM-CSA (r= 0.58, p=0.023) and Cord-CSA (r=0.56, p=0.030). Total motor score showed moderate correlation with GM-CSA (r=0.41, p>0.05), WM-CSA (r=0.52, p=0.049), Cord-CSA (r= 0.40, p> 0.05), RD (r= -0.41, p> 0.05) and MD (r= -0.42, p>0.05). Total light touch sensory scores revealed a positive correlation with AD (r= 0.43, p> 0.05) and total motor scores (r= -0.41, p> 0.05). At the T2-T3 level (Figure 4-b), T2* WM/GM ratio showed positive correlation with total light touch sensory score (r=0.48, p=0.049) and WM-CSA (r= -0.49, p=0.05).Conclusion:
This study shows the feasibility of utilizing advanced qMRI protocols that are sensitive to spinal cord pathology and have the potential to predict outcomes in children with SCI. When comparing normal and SCI pediatrics, DTI was sensitive in detecting functional changes of the spinal cord in chronic SCI. Atrophy measurements also showed potential to become a powerful clinical tool in SCI. The findings for T2* WM/GM intensity ratio are encouraging and indicate the use of this potential biomarker to quantify WM injury.Acknowledgements
This work was supported by the National Institute of Neurological Disorders of the National Institutes of Health under award Nos. R01NS079635 and R01NS111113.References
1- Kirshblum SC, Burns SP, Biering-Sorensen F, et al. International standards for neurological classification of spinal cord injury (revised 2011). J Spinal Cord Med 2011;34:535-546.2- De Leener B, Levy S, Dupont SM, Fonov VS, Stikov N, Louis Collins D, Callot V, Cohen-Adad J. SCT: Spinal Cord Toolbox, an open-source software for processing spinal cord MRI data. Neuroimage 2017.
Figures
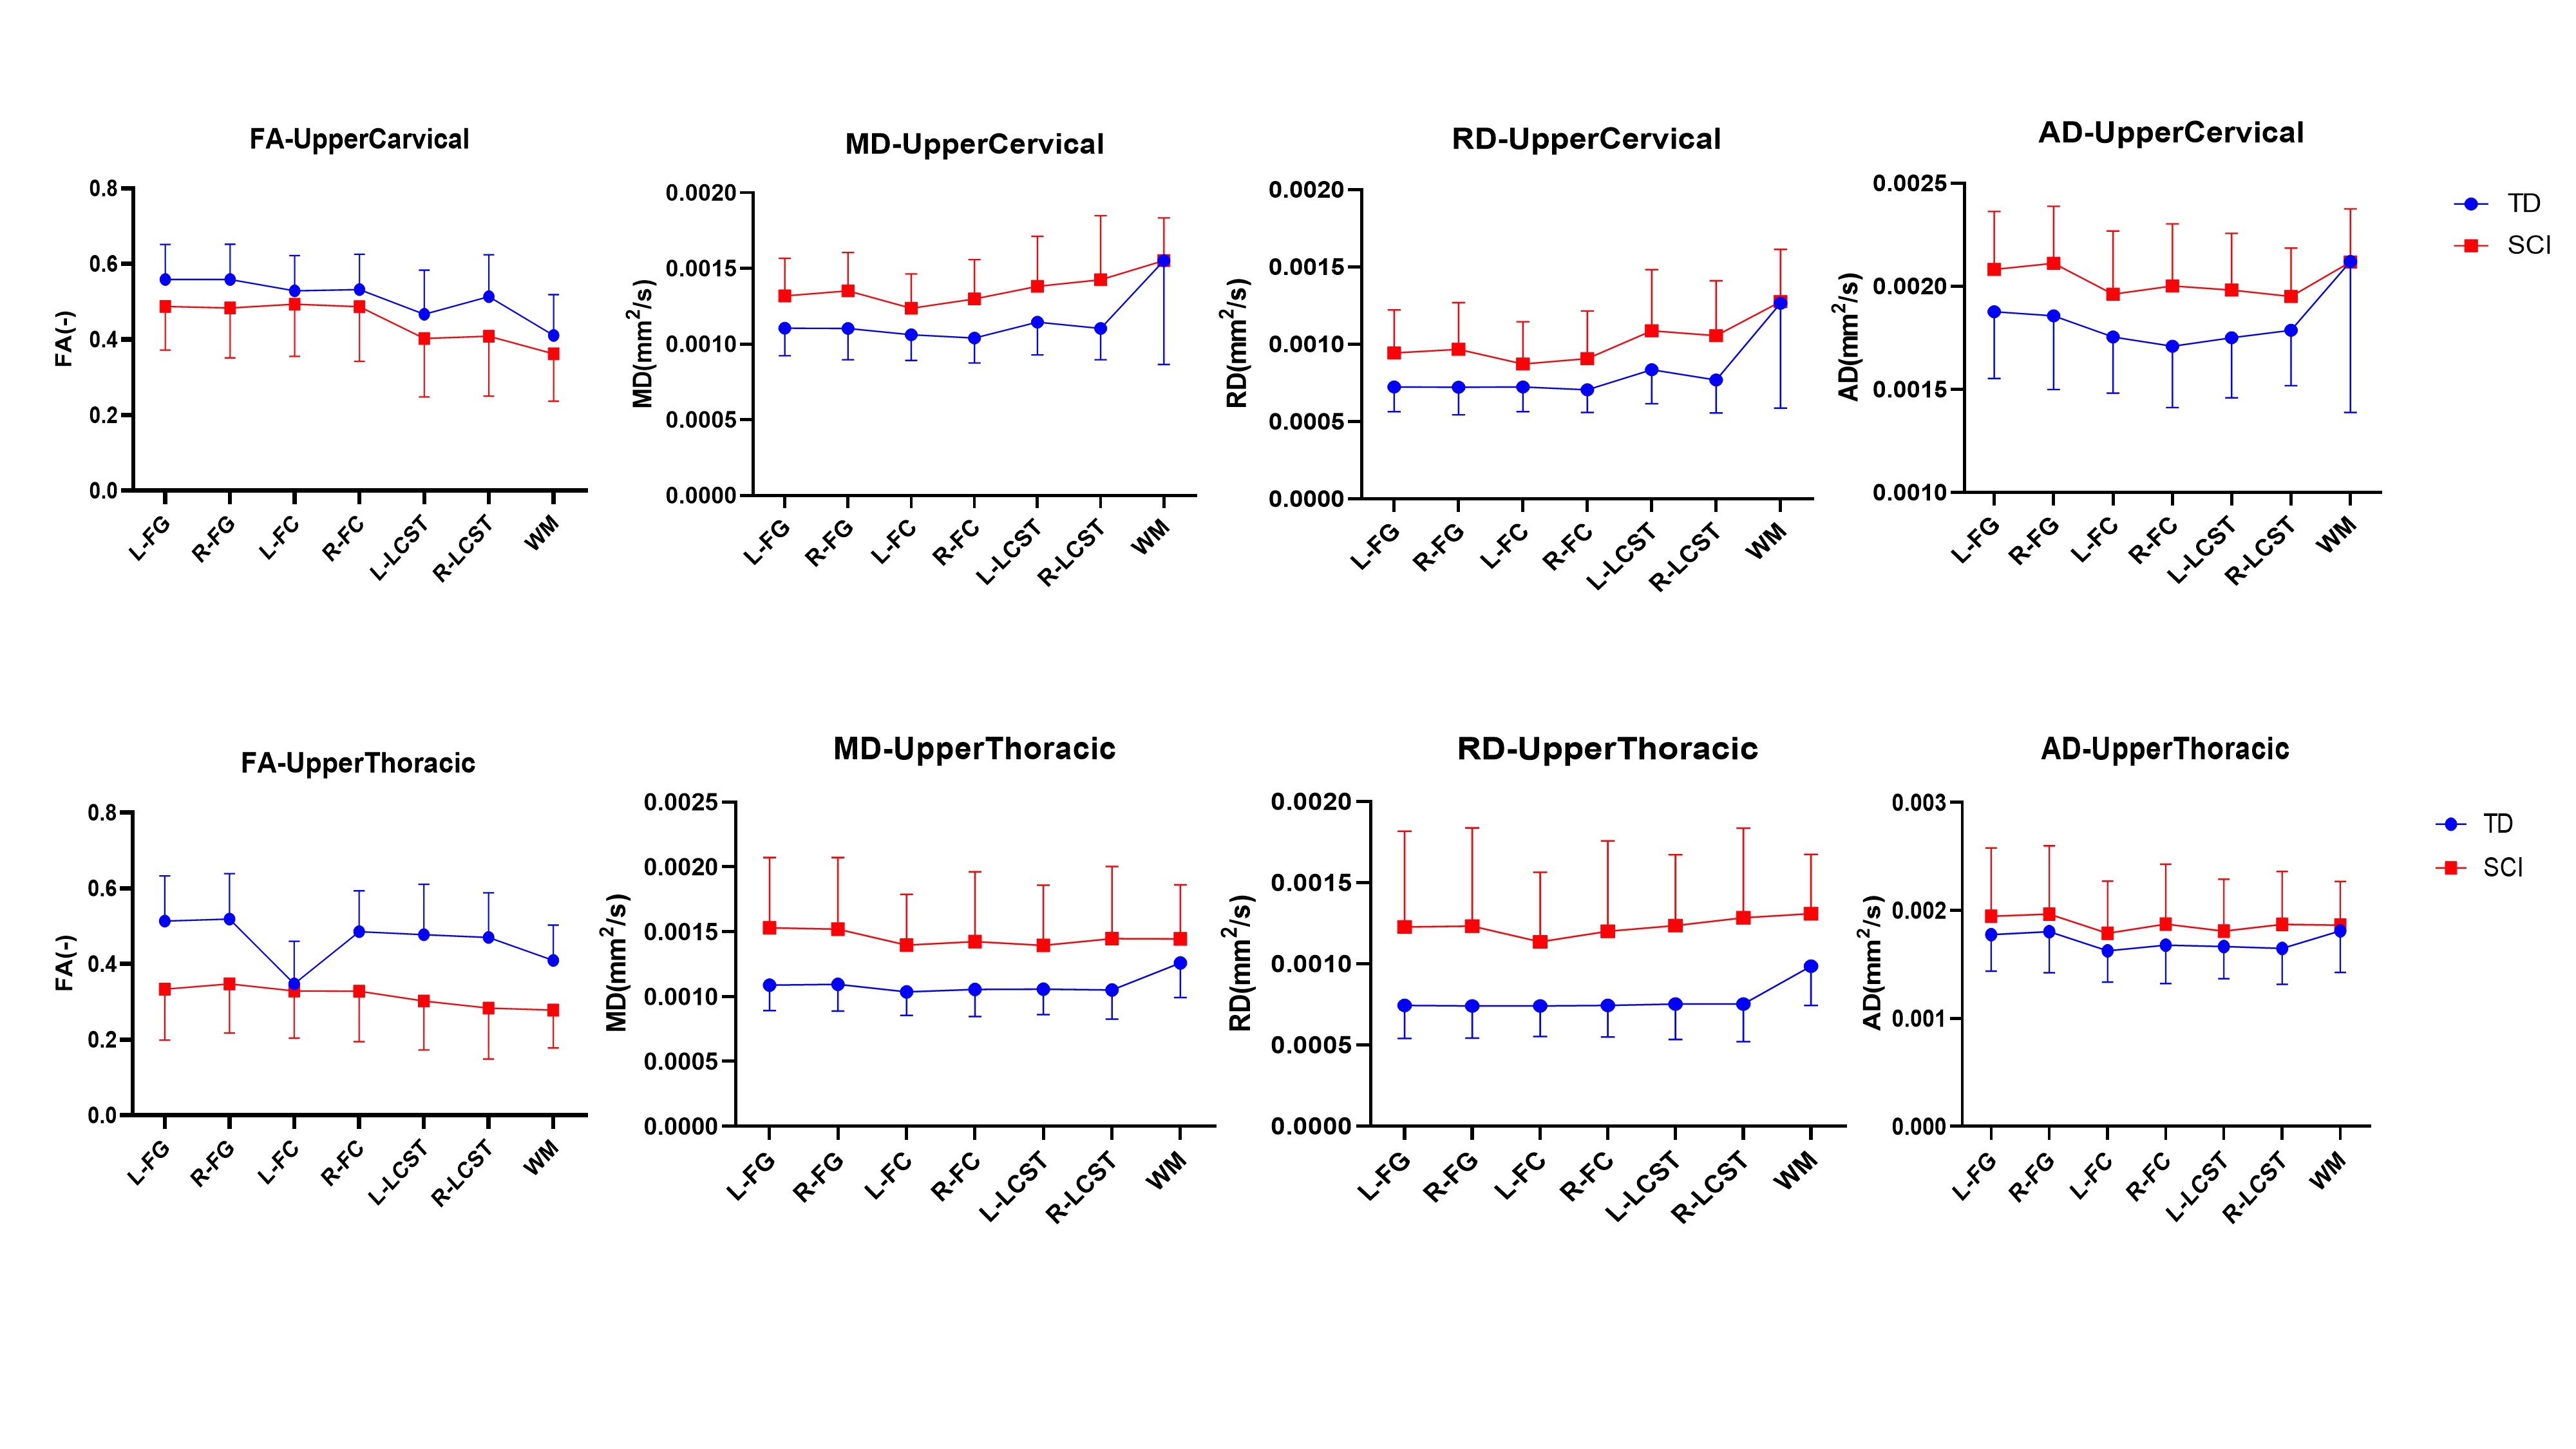
Figure 1: Scatter plots showing mean FA, MD, RD and AD measurements for the 7 WM tracts (right/left fasciculus gracilis (FG), fasciculus cuneatus (FC), lateral corticospinal tract (LCST) and white matter(WM)) at two levels (C2-C3/ upper cervical and T2-T3/ upper thoracic) for TD subjects and subjects with chronic SCI.
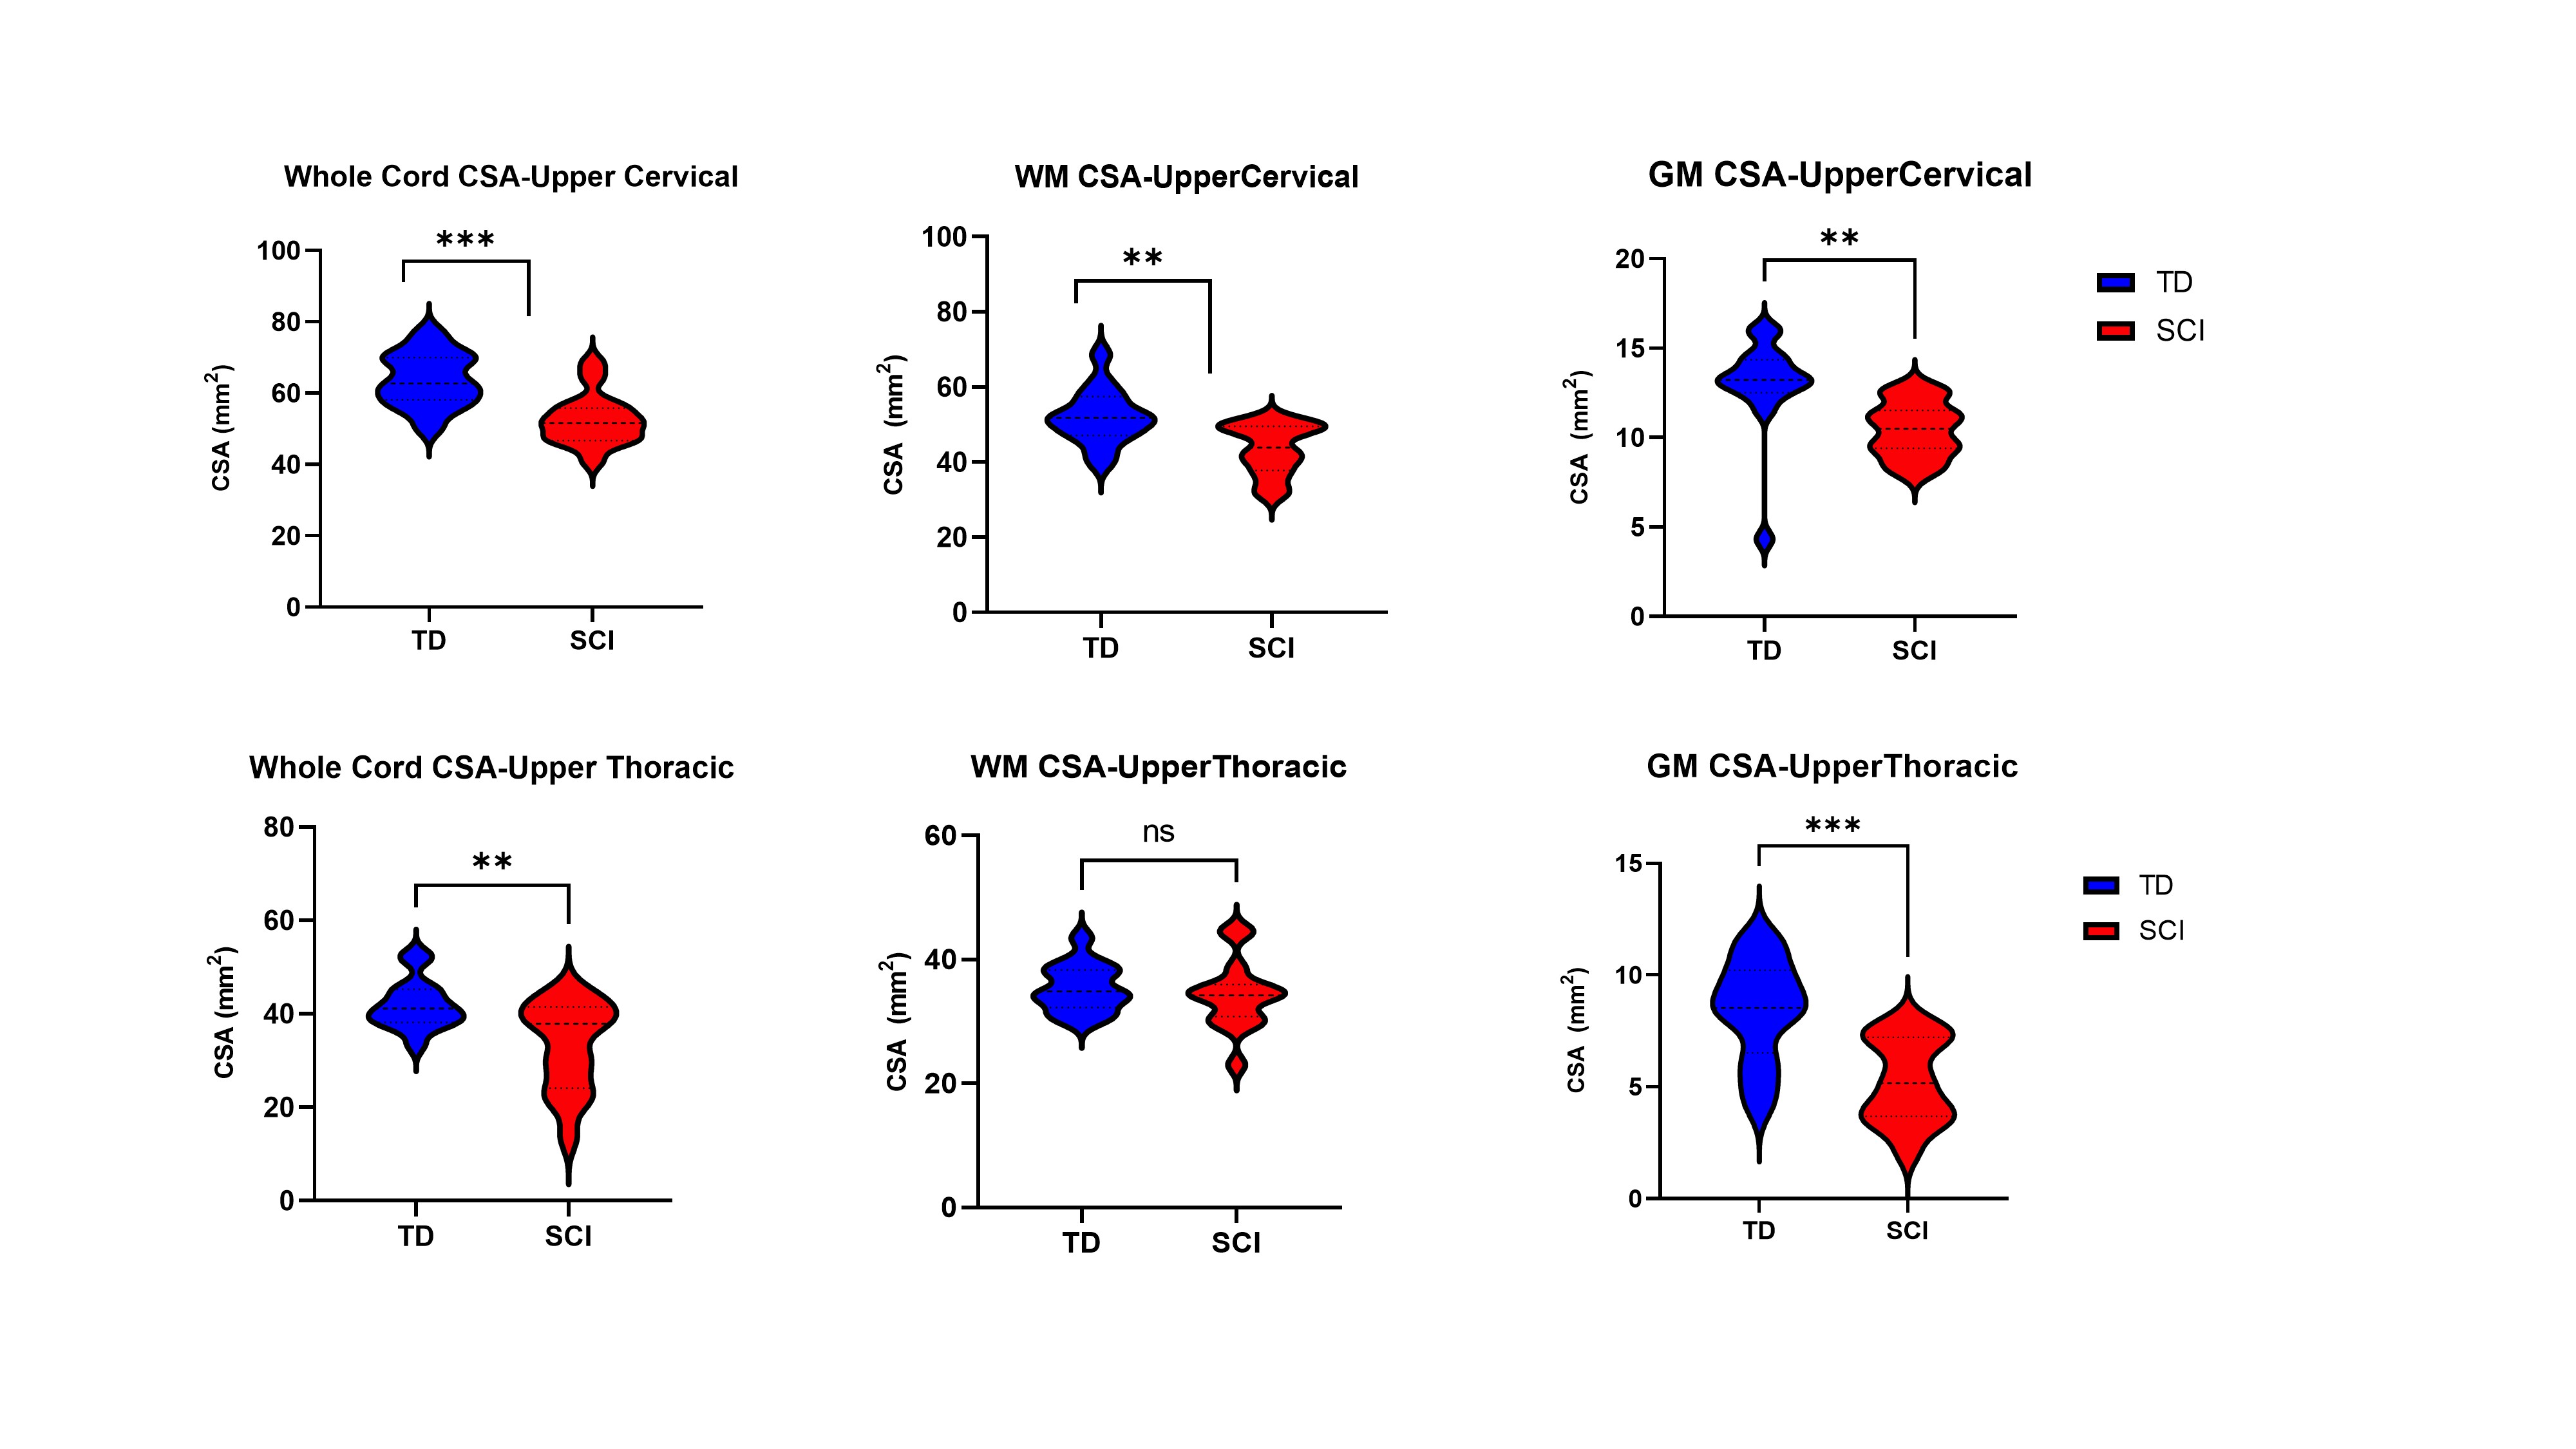
Figure 2: Violin plots showing atrophy of the cord when comparing SCI patients with TD. cross sectional area (CSA) measurements of the whole cord, WM and GM is shown at two upper cervical (top row) and upper thoracic (bottom row) levels for TD subjects and subjects with chronic SCI. The asterisk denotes P < .05 with t tests between WM, GM and whole cord among SCI vs TD.
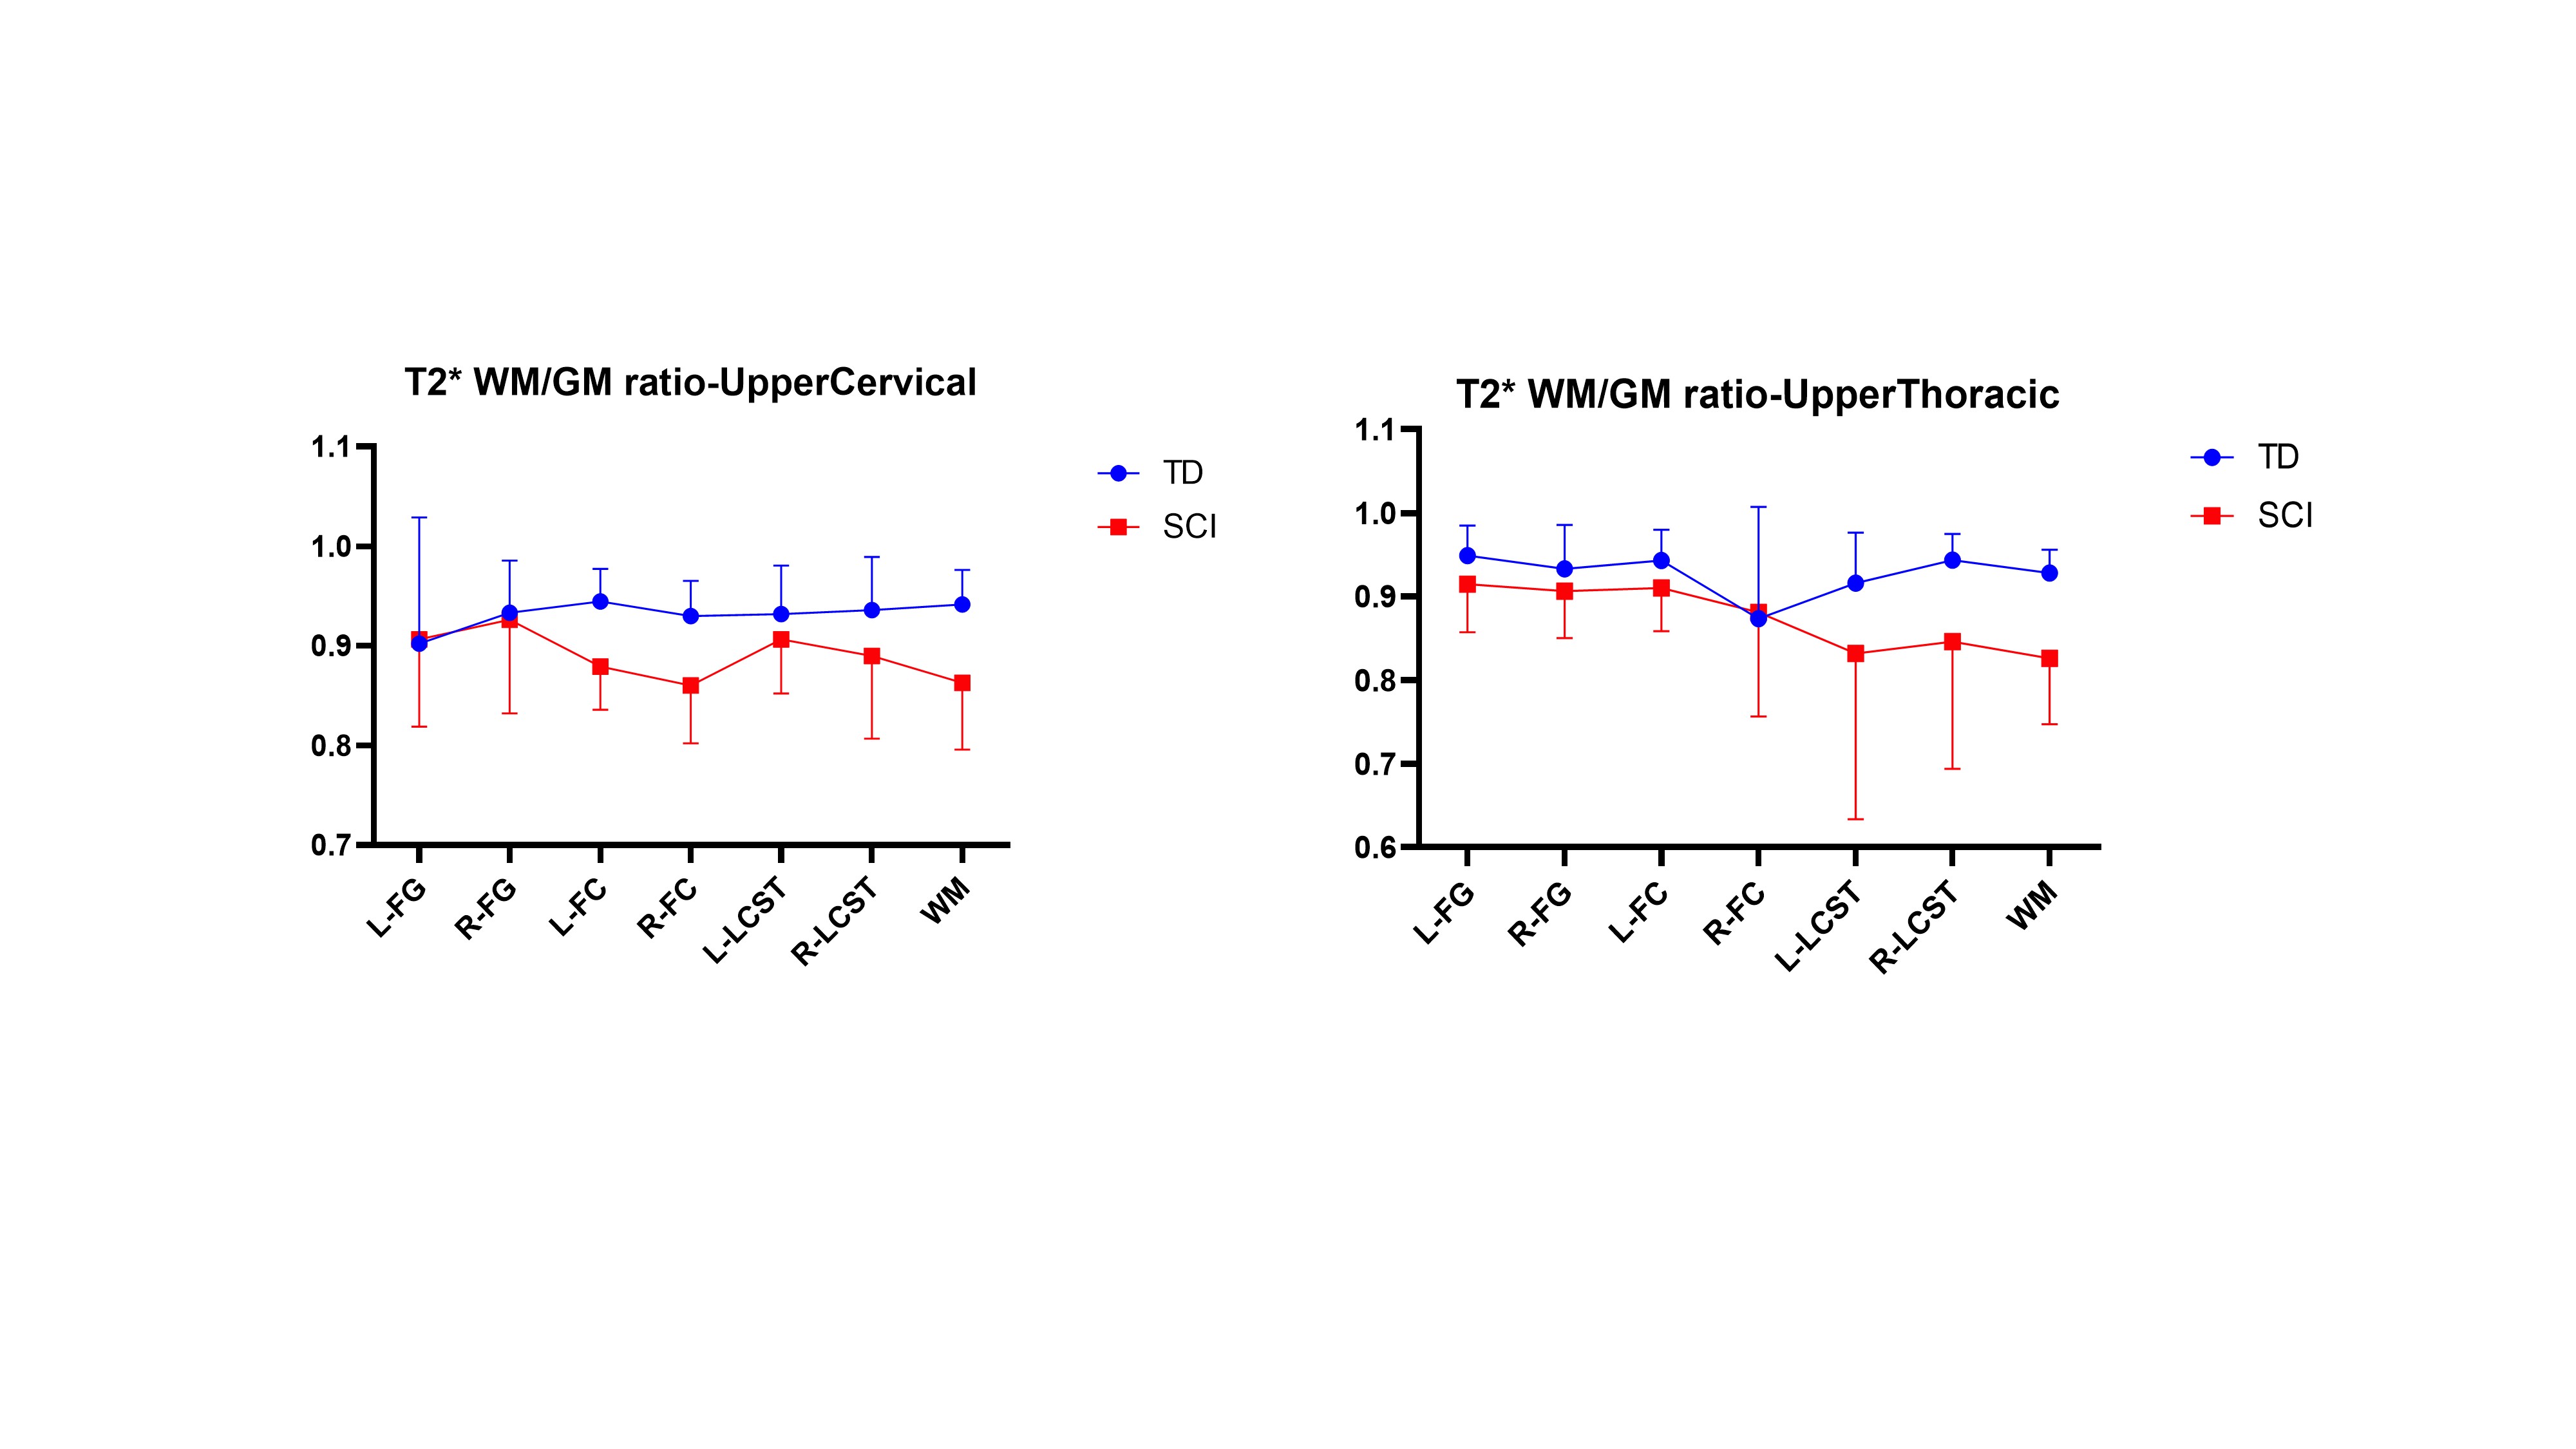
Figure 3: Scatter plots showing T2* WM/GM intensity ratio measurements for the selected tracts. This ratio showed strong differences between normal and SCI subjects (p<.05)
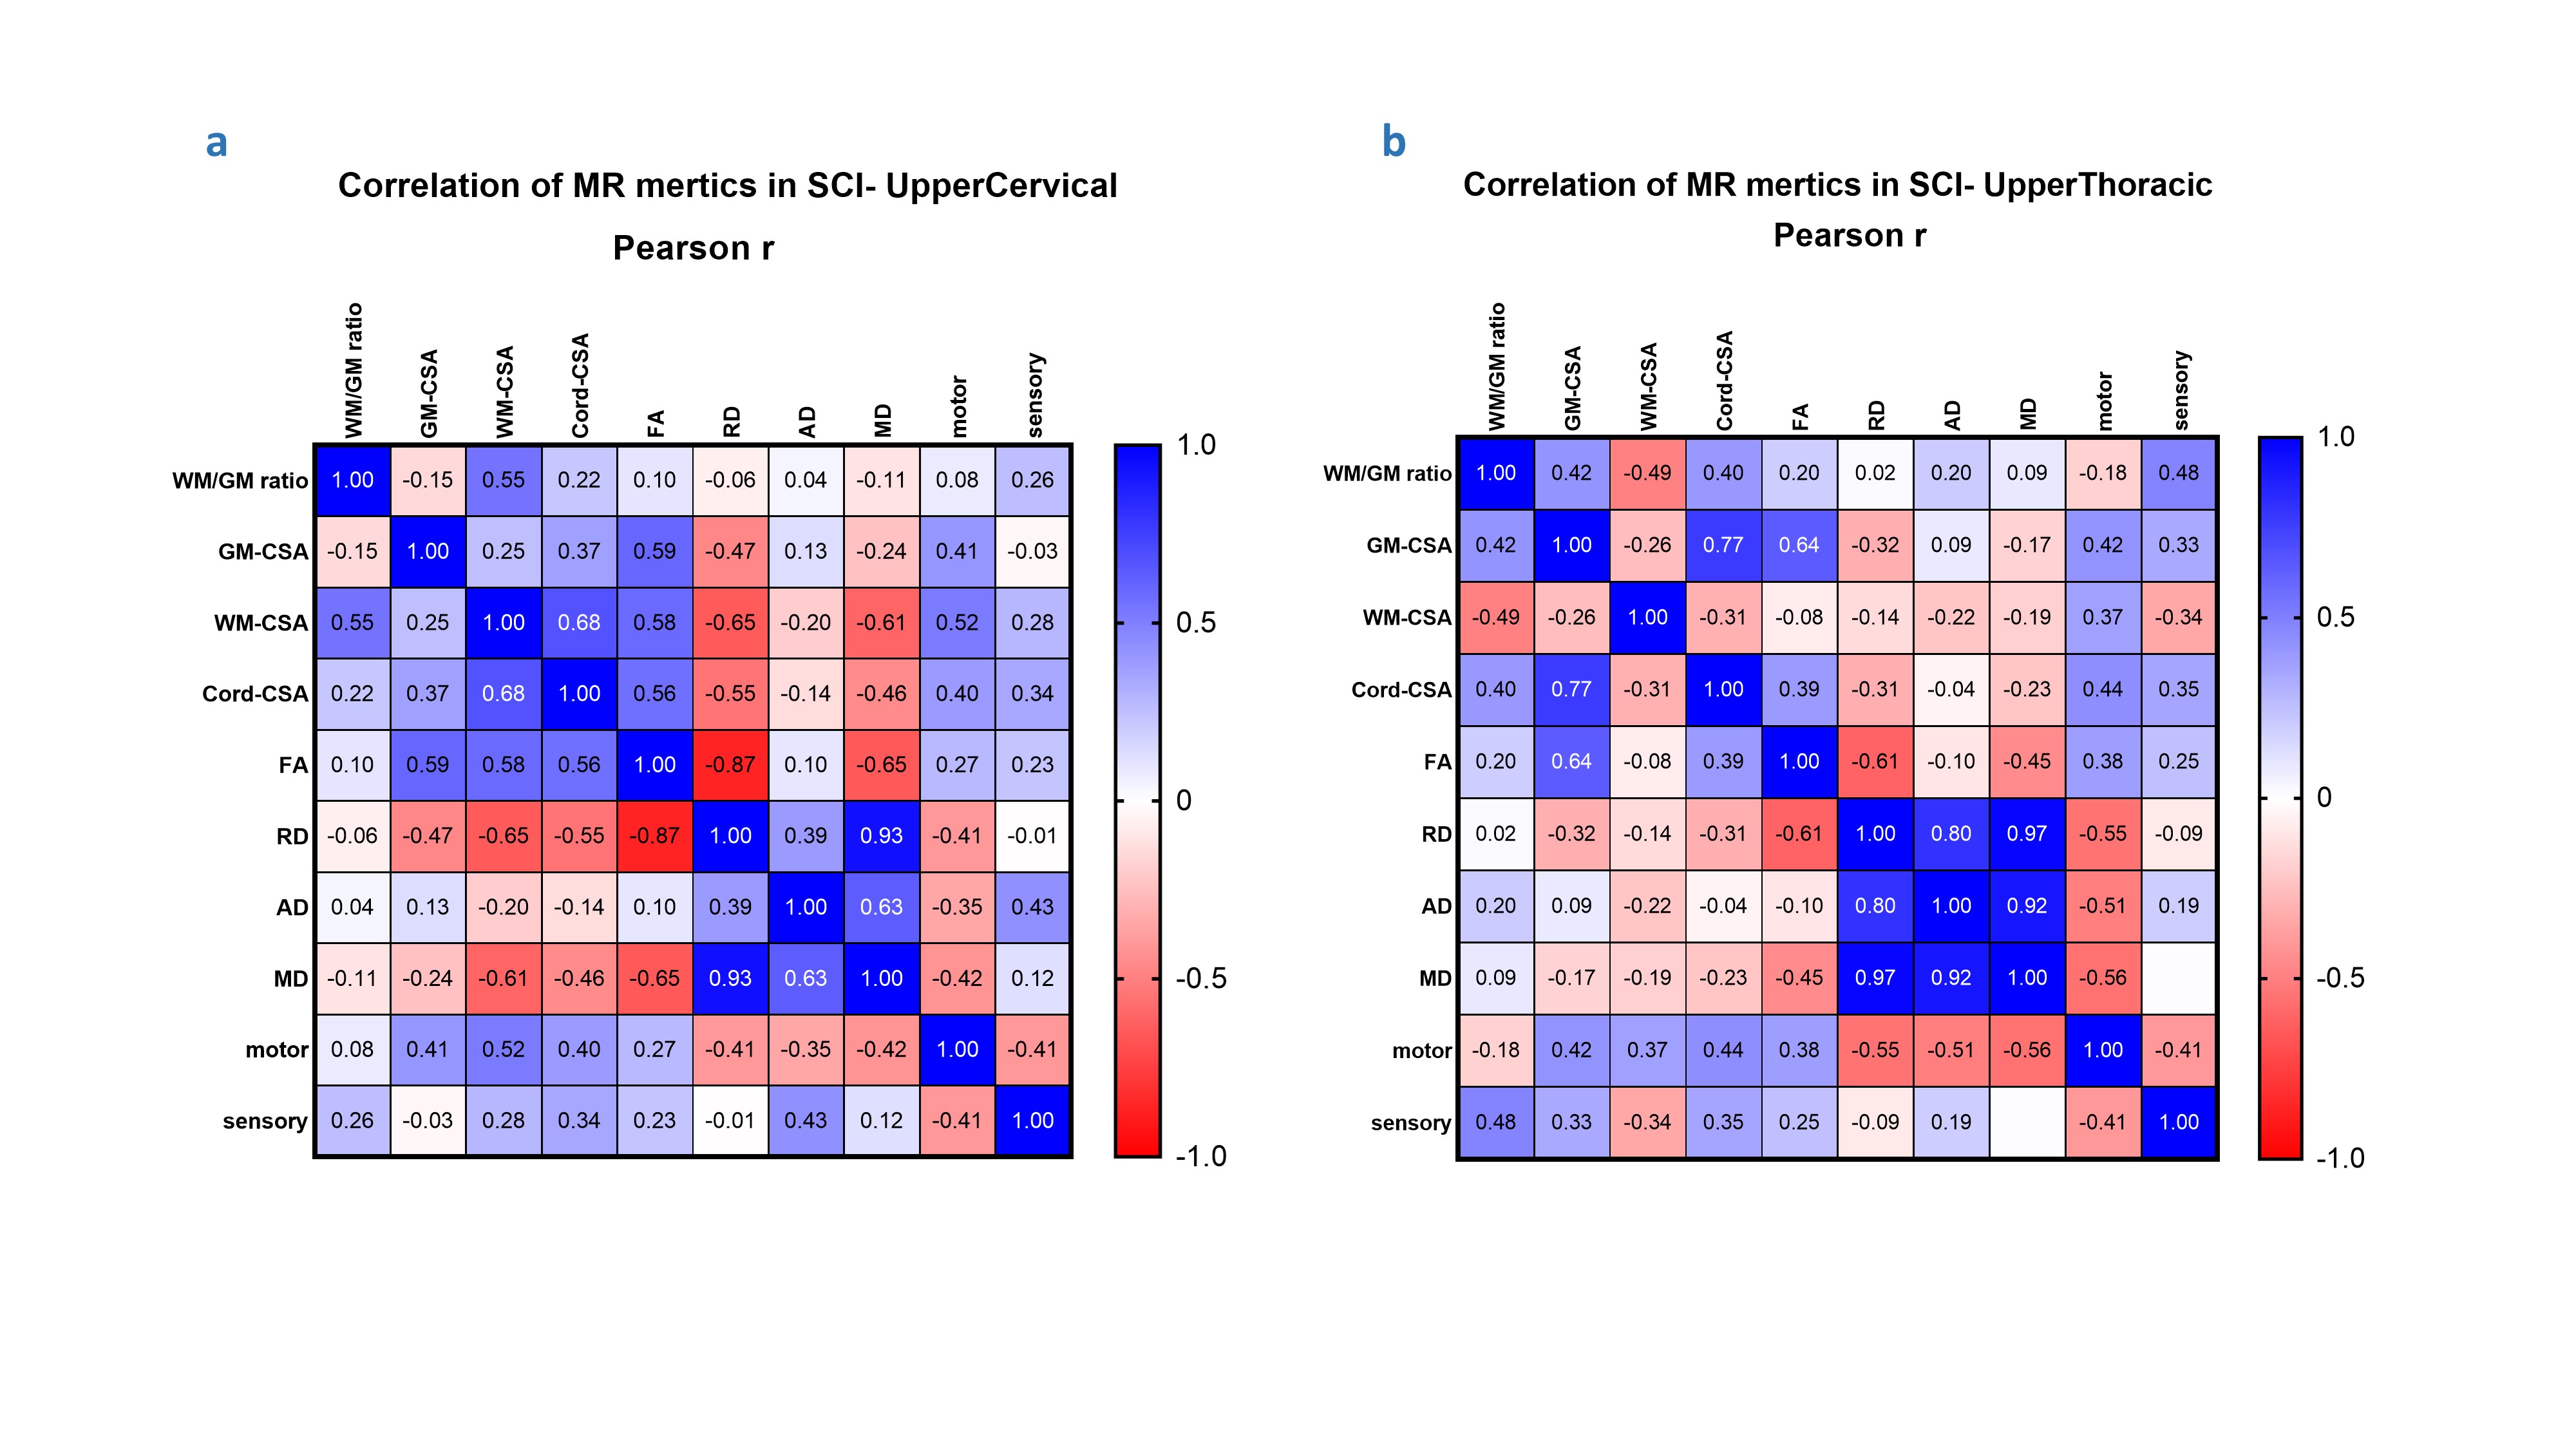
Figure 4: Correlation Matrix demonstrating the relationships between all the qMRI metrics and clinical scores using Pearson correlation. a) upper cervical matrix, b) upper thoracic matrix
DOI: https://doi.org/10.58530/2023/1561