1558
An automatic tool for lumbar deformities and intervertebral disc degeneration using deep-learning based 3D segmentation1Department of Biomedical Engineering, National Yang Ming Chiao Tung University, Taipei, Taiwan, 2Department of Neurosurgery, Neurological Institute, Taipei Veterans General Hospital, Taipei, Taiwan, 3Ph.D. Program for Neural Regenerative Medicine, Taipei Medical University, Taipei, Taiwan
Synopsis
Keywords: Spinal Cord, Machine Learning/Artificial Intelligence
Degenerative alterations are the most common cause of lumbar spinal stenosis (LSS) in seniors. LSS is detected more often due to enhanced imaging technology and an aging population. Imaging data help individuals with chronic symptoms considering invasive therapy. This study combined the approach of assessing disc degeneration with stenosis assessment, using a deep learning-based segmentation module and a home-made autonomous measuring system.
Introduction
The most frequent cause of lumbar spinal stenosis (LSS) in elderly people is degenerative changes, and the common symptoms of LSS patient were reported with previous studies[1-5]. ith the advanced imaging technology and the aging society, LSS can be diagnosed in the earlier stage[6, 7]. However, most of the treatment decision planning on the LSS patients still relied on the patient’s self-report and physical examination findings, because of the symptoms of each individual might differ from asymptomatic to severely affected daily living[8]. In order to have a precise individual treatment decision planning, the quantification analysis of the imaging results was essential in the treatment planning of LSS patients. Whereas the measurement of the imaging results was time-consuming, labor-intensive and required proficient domain knowledge[9]. Recently, artificial intelligence assisted LSS analysis were reported to have the ability of reducing the cumbersome measurement in the clinical assessment[10-12]. In this study, we have implemented the residual U-Net deep learning model [13, 14] for lumbar spine MRI images segmentation task. The segmentation output was categorized to vertebrate, disc and dura sac, and were used for the afterwards quantification analysis, which including disc geometry, disc herniation, disc stenosis and disc degeneration. The quantification results were then compared with the manual measurement by the expert.Methods
1. Open-source lumbar MRI datasetAn open-source lumbar spine MRI dataset comprising sagittal and axial orientations was used in this investigation [15]. The overall dataset was included 515 patients, and were splitted into training dataset, validating dataset and testing dataset. The training dataset was first augmented by geometry and imaging contrast adjustment.
2.Architecture of the residual (Res) -Unet
Res-UNet was utilized as a deep learning segmentation module, the structure of the Res-Unet shown in Fig.1. The training images were resized to the size of 320 x 320 as the input layer, after the calculation inside the Res-UNet, and the segmentation mask result of the disc, dura sac, and lamina in axial direction and the disc, vertebrate and dura sac in sagittal orientation was output, respectively.
3. Disc geometry index measurement
Based on the output from the Res-Unet, geometry processing was used to determine the disc height, width, height-width ratio, area, and disc volume in the sagittal orientation.
4. Landmark based analysis of disc stenosis and herniation
The disc stenosis and herniation were quantified with measuring the diameter of dura sac in the sagittal and axial orientation, respectively. In the sagittal orientation, the diameters of dura sac at the corresponding disc location were calculated. To consider all the condition of stenosis, the processed discs ranged from L34 to L5S1, and the dura sac diameters were exported with a sweep of ± 30 degrees in axial orientation.
5. Histogram curve fitting of disc degeneration analysis
The following Equation 1 could be used to compute the ΔSI:
Equation 1: ΔSI = (SI1-SI2)/SICSF
Where SICSF stands for the signal intensity corresponding to the peak of the histogram for the CSF area, SI1 and SI2, respectively, represent the signal-intensity values for the first and second peaks of the histogram for the discs[16].
6. Verification of the quantification analysis result
The result of verification included 10 patients’ T1W MR images from the database. The radiologist measured the dura sac diameter and compared the measurement result with the autonomous measuring system measurement. The evaluation of all accuracies for all samples were calculated for the mean and standard deviation.
Result
The results of Res-Unet segmentation represented in the Fig.2. The target part were extracted in both axial and sagittal orientation . And the intersection over union (IoU) were 0.862 and 0.834 in sagittal and axial orientation, respectively. Fig.3 showed the measurement of geometry in sagittal and axial orientation, respectively. Especially, the intensities of disc were also calculated to quantify the degeneration of the discs in the middle slice of sagittal orientation (Fig.4). To verify the robustness of the geometry measurement, Table 1 showed the accuracies calculated by expert. In axial orientation, the average outcome of all results is 0.9323 ± 0.0654. The lower bound of 95% confidence interval is 0.8015, while the average outcome of all results is 0.9671 ± 0.0303. The lower bound of 95% confidence interval is 0.9065 in sagittal orientation. Both lower bound of 95% confidence interval were all above 0.80, which indicated that geometry measurement passed the acceptance test.Disscussion
While several quantitative methods have been established for diagnosing LSS and disc degeneration[10-12, 16], symptoms can range from being asymptomatic to severely interfering with daily life, and a neurological examination may not be conclusive in the early stage of the disease. Therefore, it is important to consider a variety of quantitative indices to satisfy the diagnostic needs of medical professionals. Future research should clarify the correlation between observed ΔSI parameters, LSS, disc degeneration, and symptom severity in various individuals.Conclusion
In this study, we proposed an automated stenosis detection approach based on deep-learning segmentation was created to perform precise segmentation using lumbar areas from T1W MR images. According to the results of verification, we assume that the designed automatic measurement system could be a useful tool for massive measurement of stenosis patients.Acknowledgements
This work is financially supported by National Science and Technology Council under Contract numbers of MOST111-2221-E-A49-049-MY2.References
- Fanuele, J.C., et al., The impact of spinal problems on the health status of patients: have we underestimated the effect? Spine (Phila Pa 1976), 2000. 25(12): p. 1509-14.
- Kalichman, L., et al., Spinal stenosis prevalence and association with symptoms: the Framingham Study. Spine J, 2009. 9(7): p. 545-50.
- Yabuki, S., et al., Prevalence of lumbar spinal stenosis, using the diagnostic support tool, and correlated factors in Japan: a population-based study. J Orthop Sci, 2013. 18(6): p. 893-900.
- Ishimoto, Y., et al., Prevalence of symptomatic lumbar spinal stenosis and its association with physical performance in a population-based cohort in Japan: the Wakayama Spine Study. Osteoarthritis Cartilage, 2012. 20(10): p. 1103-8.
- Jarvik, J.J., et al., The Longitudinal Assessment of Imaging and Disability of the Back (LAIDBack) Study: baseline data. Spine (Phila Pa 1976), 2001. 26(10): p. 1158-66.
- Deyo, R.A., S.J. Bigos, and K.R. Maravilla, Diagnostic imaging procedures for the lumbar spine. Annals of internal medicine, 1989. 111(11): p. 865-867.
- Ciricillo, S.F. and P.R. Weinstein, Lumbar spinal stenosis. West J Med, 1993. 158(2): p. 171-7.
- Lyle, M.A., et al., Relationship of physical examination findings and self-reported symptom severity and physical function in patients with degenerative lumbar conditions. Physical therapy, 2005. 85(2): p. 120-133.
- Statistics., N.O.f., NHS Imaging and Radiodiagnostic activity [Internet]. 2014.
- Konno, S., et al., Development of a clinical diagnosis support tool to identify patients with lumbar spinal stenosis. Eur Spine J, 2007. 16(11): p. 1951-7.
- Zhu, Y., et al., Artificial Intelligence Algorithm-Based Lumbar and Spinal MRI for Evaluation of Efficacy of Chinkuei Shin Chewan Decoction on Lumbar Spinal Stenosis. Contrast Media & Molecular Imaging, 2021. 2021: p. 2700452.
- Ren, G., et al., Differentiation of lumbar disc herniation and lumbar spinal stenosis using natural language processing–based machine learning based on positive symptoms. Neurosurgical Focus, 2022. 52(4): p. E7.
- Wang, Z., Y. Zou, and P.X. Liu, Hybrid dilation and attention residual U-Net for medical image segmentation. Computers in Biology and Medicine, 2021. 134: p. 104449.
- Kolařík, M., et al., Optimized high resolution 3D dense-U-Net network for brain and spine segmentation. Applied Sciences, 2019. 9(3): p. 404.
- Sudirman, S.A.K., Ala; Natalia, Friska; Meidia, Hira; Afriliana, Nunik; Al-Rashdan, Wasfi; Bashtawi, Mohammad, Lumbar Spine MRI Dataset. Mendeley Data, 2019.
- Zheng, H.-D., et al., Deep learning-based high-accuracy quantitation for lumbar intervertebral disc degeneration from MRI. Nature communications, 2022. 13(1): p. 1-12.
Figures
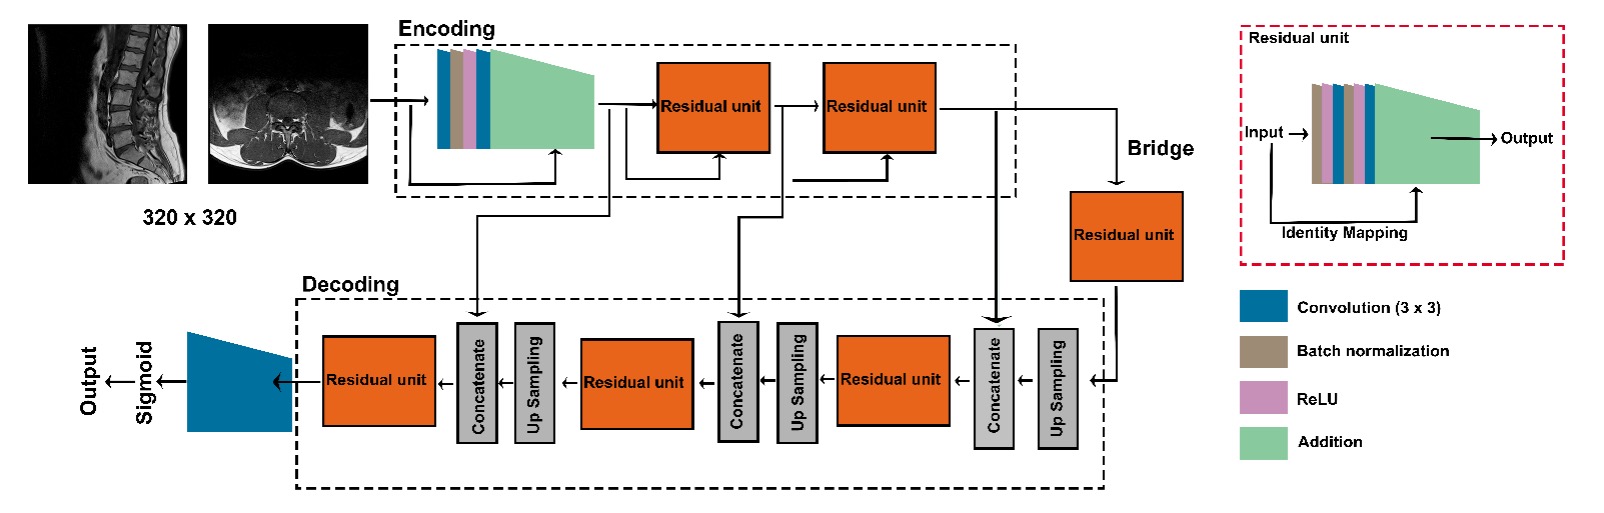
Figure 1. The structure of Res-Unet. Res-Unet has three layers of feature extraction residual blocks, a bridge, and three levels of upsampling residual blocks. Each block comprises batch normalization, convolution, and residual factor addition. Between the feature extraction and upsampling residual blocks, shortcuts were developed.
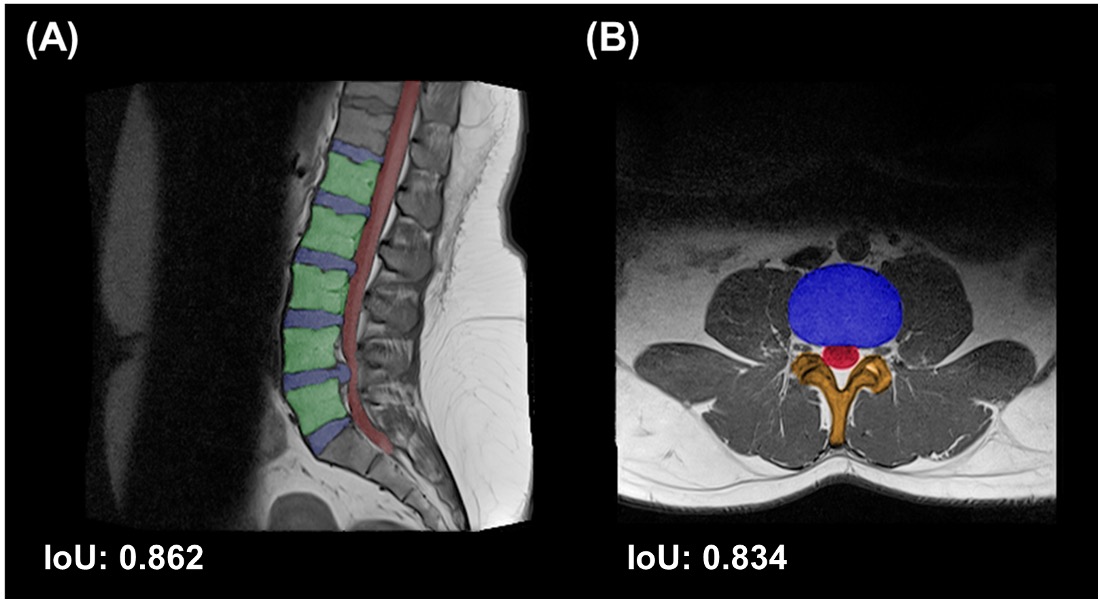
Figure 2. The segmentation result of Res-Unet. (A) The disc (blue), vertebrate (green), and dura sac (red) were separated apart from other tissue in the sagittal orientation. The intersection over union (IoU) were 0.862, compared with the results and the labels using testing trial. (B) In the axial orientation, the part of disc (blue), dura sac (red), and lamina (orange) were extracted. Compared with the results and labels, the IoU were 0.834 in this orientation.
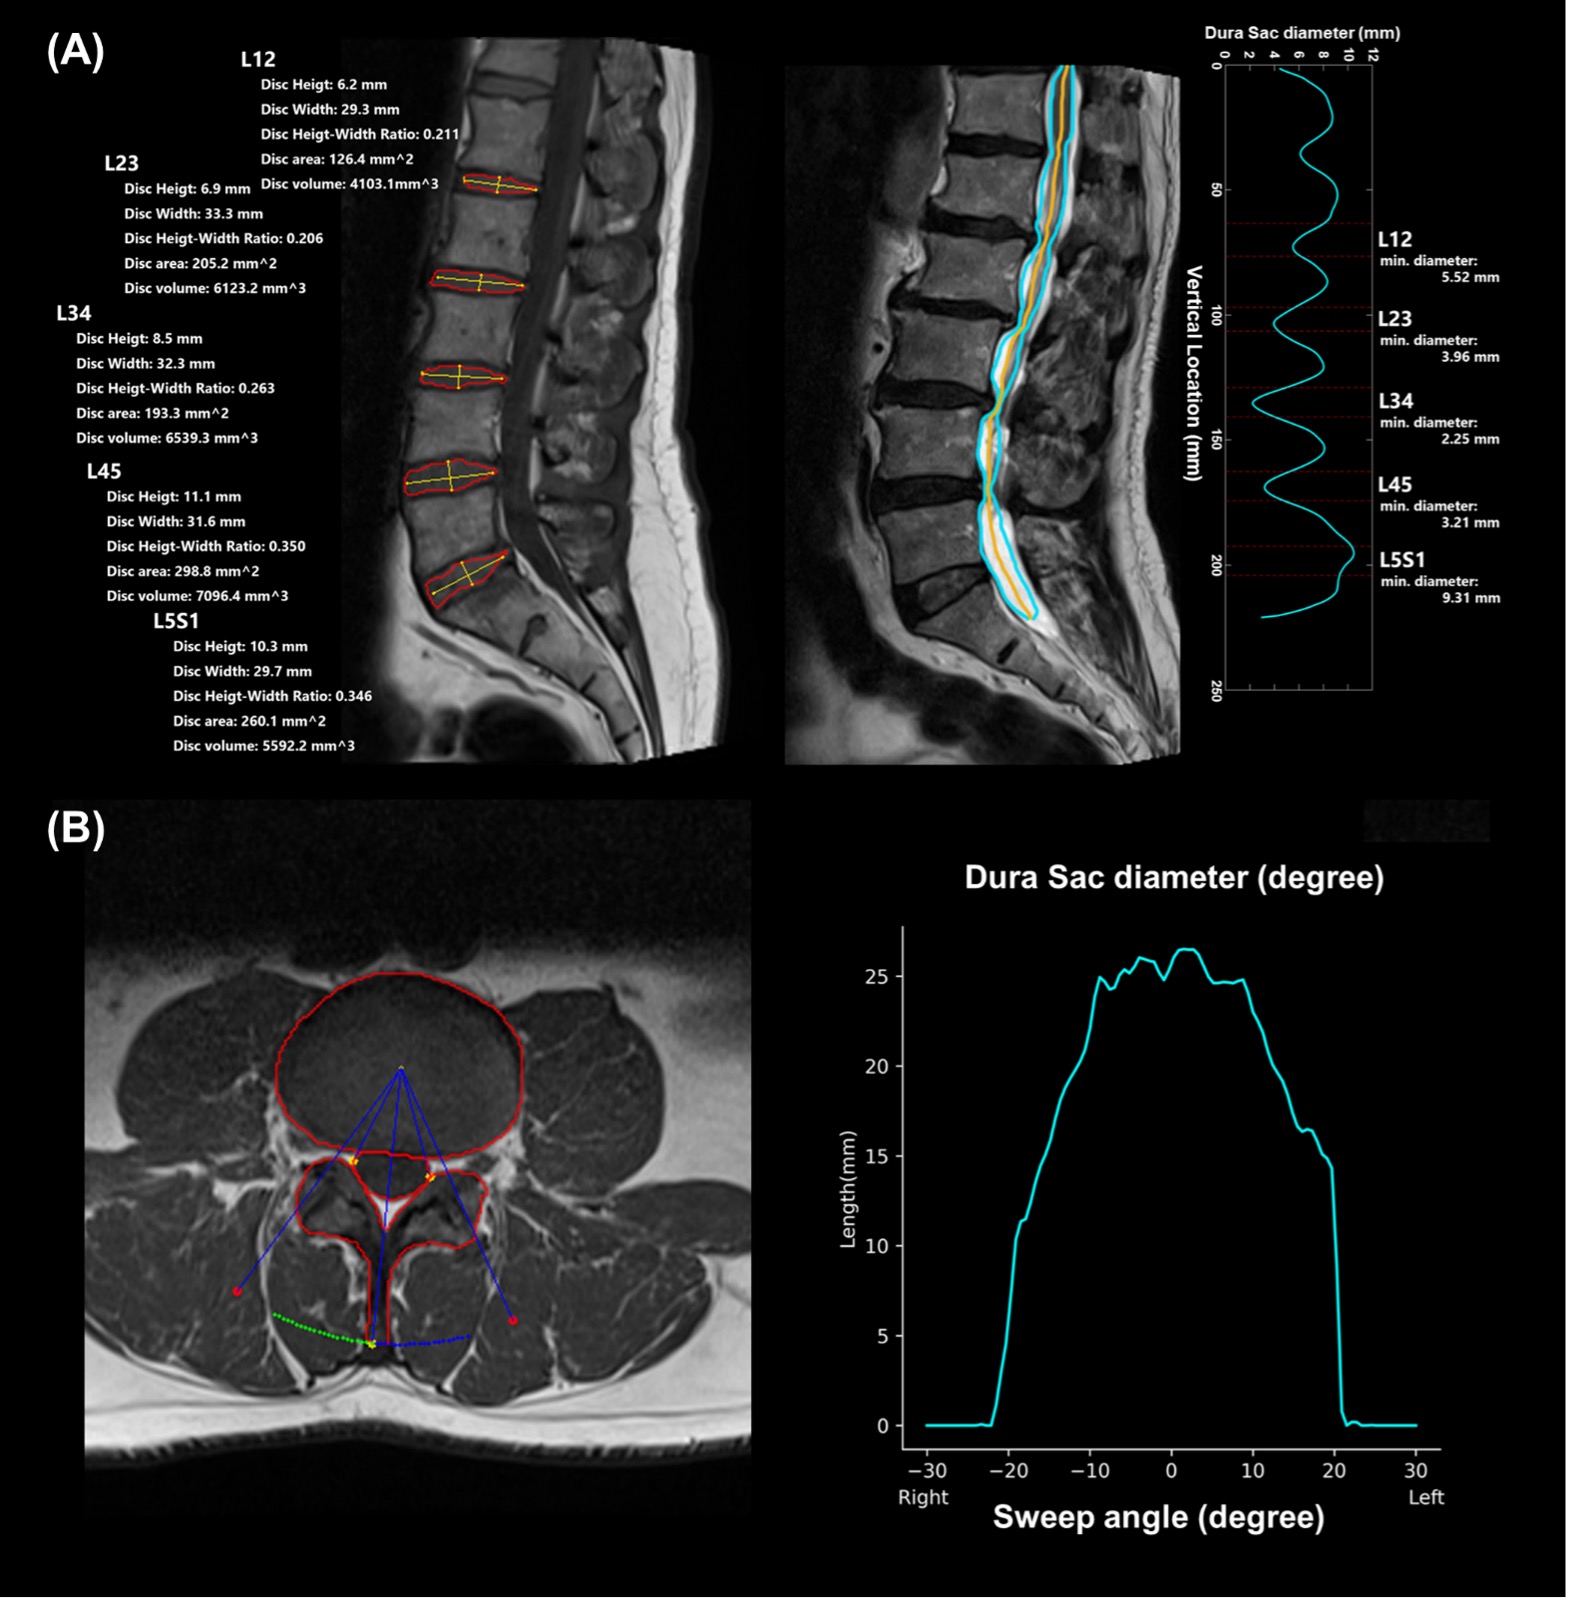
Figure 3. The visualization of the result from autonomous measurement system. (A) The result of disc height, disc width, disc height-width ratio, and disc volume were demonstrated on the left. The cyan line on the right represented the dura sac of diameter form the range of T12-L1 to L5S1 on the right. (B) On the left, the result of Res-Unet segmentation contour and autonomous measurement system swept ± 30 degrees to calculate the diameter of dura sac. The cyan line represented the distribution of the dura sac diameter at the range of ± 30 degrees in the right graph.
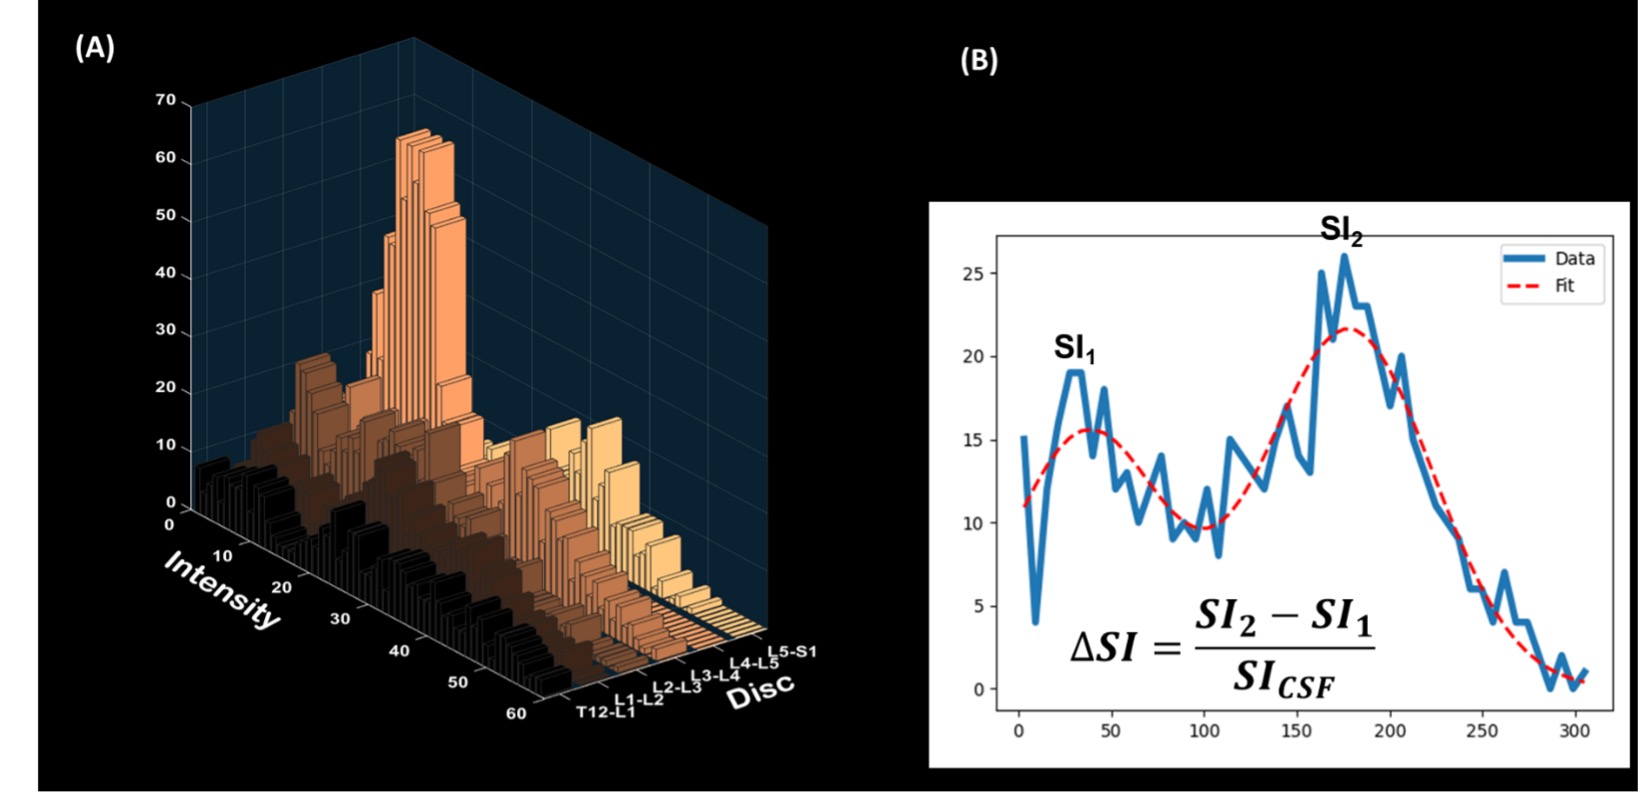
Figure 4. The visualization of the ΔSI and the fitting formula. (A) Intensity from different discs. (B) The formula of ΔSI and the fitting model. SI1 and SI2 represented the signal-intensity values for the first and second peaks of the histogram for the discs, respectively.
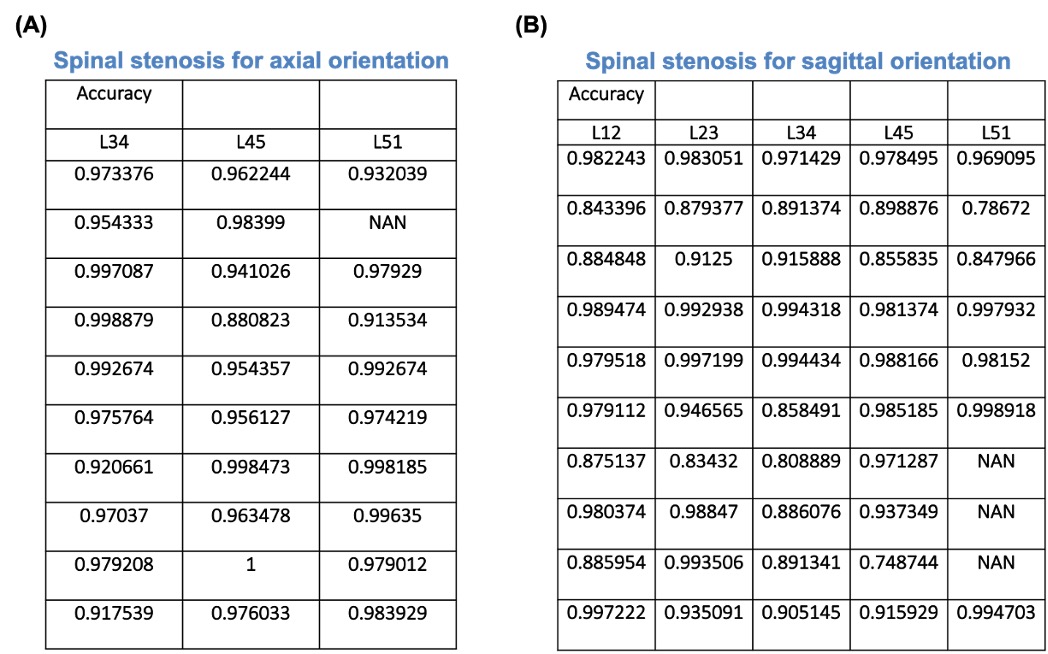
Table 1. The table of verification of autonomous measurement system. (A) The verification of axial orientation. The overall result average is 0.9323 ± 0.0654. The 95 % confidence interval's bottom bound is 0.8015. (B) The verification of sagittal orientation. The overall result average is 0.9671 ± 0.0303. The 95 % confidence interval's bottom bound is 0.9065.