1555
Reliability of spinal cord measures based on Synthetic T1-weighted MRI derived from multi-parametric mapping (MPM)1Spinal Cord Injury Center, Balgrist University Hospital, Zürich, Switzerland, 2Department of Neurophysics, Max Planck Institute for Human Cognitive and Brain Sciences, Leipzig, Germany, 3Felix Bloch Institute for Solid State Physics, Leipzig University, Leipzig, Germany, 4Wellcome Trust Centre for Neuroimaging, UCL Queen Square Institute of Neurology, London, United Kingdom
Synopsis
Keywords: Spinal Cord, Quantitative Imaging
MRI acquisition time is a main factor for patient's comfort and motion artifacts. To avoid additional time consuming T1-w MPRAGE imaging for measuring spinal cord atrophy, when quantitative multi-parameter maps (MPM) are available, we reconstructed and validated a synthetic T1-w (synT1-w) based on MPMs. Test-retest repeatability was assessed and synT1-w images were compared with T1-w MPRAGE in a longitudinal study following spinal cord injury. Measures derived from synT1-w demonstrated high intra- and inter-site repeatability with only small difference when compared to MPRAGE. The estimated effects of spinal cord atrophy agreed with those obtained from MPRAGE.
Introduction
T1-w 3D Magnetization Prepared Rapid Acquisition Gradient-Echo (MPRAGE) MRI is routinely applied in clinics and research to assess tissue structures such as brain atrophy and changes in the spinal cord cross-sectional area (CSA)1-6. Long MRI acquisition time often leads to potentially increased patient's discomfort and motion artifacts7. Synthetic MRI is a technique that enables to reconstruct multiple contrast weighted images based on quantitative maps of physical tissue properties to shorten the acquisition time8-10.Here, we reconstructed synthetic T1-w (synT1-w) images based on quantitative maps derived from the multi-parameter mapping (MPM) protocol11 of the cervical spinal cord. Test-retest repeatability of CSA measurements within synT1-w images of cervical levels C1 to C3 was assessed (multi-center and multi-vendor study - parts of data already reported)12. Additionally, generated synT1-w images were compared to the gold standard MPRAGE to reliably detect cord atrophy in spinal cord injury (SCI) patients in a longitudinal study (parts of data already reported)1-3,6,13,14.
Methods
This study includes two different MRI data sets acquired, a: The “traveling head study” (THS)12 with 5 healthy subjects that were scanned twice at each of 6 different sites12 for assessing intra- and inter-site repeatability, b: a longitudinal dataset1 of 23 SCI patients and 21 healthy controls to test how the approach generalizes to a patient group. The scanning protocol included a conventional MPRAGE scan and the MPM protocol11.SynT1-w images were reconstructed from the MPM protocol based on the quantitative maps of proton density (PD), longitudinal (R1) and effective transverse (R2*) relaxation rates using the MPRAGE signal equation8,15. Using the Spinal Cord Toolbox16 synT1-w and MPRAGE images were automatically segmented at vertebral levels C1 to C3 and the average CSA was extracted for each vertebral level (C1-C3) separately.
In the THS study, the reliability of the synT1-w MRI was determined by calculating the intra-site and inter-site coefficients of variation (CoV) for CSA measurements of cervical levels C1-C3.
Next, in the longitudinal study, the validity of synT1-w was assessed by comparing CSA measurements of cervical levels C1-C3 obtained from synT1-w and MPRAGE images. The Bland-Altman method was used to assess the agreement between synT1-w and MPRAGE. Linear mixed effect models were created to investigate spinal cord atrophy. Estimates of atrophy rates and CSA at baseline and the 2-year follow-up were compared between synT1-w and MPRAGE. Post-hoc pairwise comparison was performed using Tukey's correction (p<0.05).
Results
CSA measurements based on the synT1-w MRI showed high intra-site (intra-site CoV between 1.43% and 2.71%) and inter-site repeatability (inter-site CoV between 2.90% and 5.76%) (Figure 1). The average CSA for MPRAGE segmentations was 63.63 ± 8.70 mm2 while the mean CSA for synT1-w was 62.04 ± 8.34 mm2 (Figure 2A). The Bland-Altman analysis showed only a small difference of -1.60 mm2 between synT1-w images and MPRAGE (Figure 2B).The linear mixed effect models in longitudinal measurements showed a comparable difference between synT1-w and MPRAGE (controls: -1.66 mm2; patients: -1.86 mm2). Crucially, atrophy rates and group differences (i.e. healthy controls versus SCI patients) at baseline and the 2-year follow-up between the estimates derived from synT1-w MRI from MPRAGE were further diminished (difference atrophy rate: -0.007 mm2/month; difference baseline CSA: 0.02 mm2; difference 2-year follow-up CSA: -0.54 mm2) (Tables 1&2, Figure 3).
Discussion
This study determined the reliability of synT1-w MRI images based on quantitative multi-parameter maps of physical tissue parameters for estimation of spinal cord macrostructural parameters (i.e. CSA). SynT1-w images demonstrated good intra- and inter-site repeatability equal to the repeatability of cord segmentation based on T1-w images in literature17. Direct comparison between synT1-w and MPRAGE images revealed a small CSA difference of -1.60 mm2 only, which is also reflected in the linear mixed effect models. Most relevant for clinical applications, this difference was even smaller when assessing linear atrophy rates (change/time) and comparisons between groups (SCI patients – controls). Moreover, both approaches (synT1-w and MPRAGE) resulted not only in similar estimates of cord atrophy but additionally, the variances of the estimates were comparable, which allowed robust estimation of cord atrophy based on synT1-w images comparable to MPRAGE analysis.Conclusion
Synthetic T1-w MRI showed a good intra- and inter-site repeatability and a high agreement with standard MPRAGE MRI, also in longitudinal analysis. Thus, reliable estimates of macrostructural spinal cord parameters can be obtained from synT1-w derived from MPM images. Thereby the acquisition of MPRAGE becomes obsolete and the total acquisition time may be reduced by approximately 9 minutes1, facilitating the potential use in clinics.Acknowledgements
The authors thank all participants who gave their time and took part in this study, as well as the staff of the collaborating radiology departments at the clinical research site for their help in acquiring the MR data and their contribution to the study. These include the departments of radiology at the Clinica Creu Blanca, Barcelona, Spain, at the University Hospital Basel, Basel, Switzerland, at the University Hospital Heidelberg, Heidelberg, Germany, at the Swiss Paraplegic Center, Nottwil, Switzerland, at the Laboratory for Social and Neural Systems Research, Zurich Center for Neuroeconomics, Zurich, Switzerland, and at the University Hospital Balgrist, Zurich, Switzerland.
Simon Schading was supported by a national MD-PhD scholarship from the Swiss National Science Foundation (grant number: 323530_207038). Maryam Seif received grants from Wings for life charity (No WFL-CH-19/20) and the International Foundation for Research (IRP-158). Nikolaus Weiskopf was supported by the European Research Council under the European Union's Seventh Framework Programme (FP7/2007-2013) / ERC grant agreement n° 616905.; the European Union's Horizon 2020 research and innovation programme under the grant agreement No 681094; the Deutsche Forschungsgemeinschaft (DFG, German Research Foundation) – project no. 347592254 (WE 5046/4-2). Patrick Freund received a personal grant from the Swiss National Science Foundation (SNF, No. 181362).
References
1. Freund P, Weiskopf N, Ashburner J, et al. MRI investigation of the sensorimotor cortex and the corticospinal tract after acute spinal cord injury: a prospective longitudinal study. The Lancet Neurology 2013;12(9):873-881; doi: https://doi.org/10.1016/S1474-4422(13)70146-7
2. Seif M, Curt A, Thompson AJ, et al. Quantitative MRI of rostral spinal cord and brain regions is predictive of functional recovery in acute spinal cord injury. Neuroimage Clin 2018;20(556-563; doi: 10.1016/j.nicl.2018.08.026
3. Ziegler G, Grabher P, Thompson A, et al. Progressive neurodegeneration following spinal cord injury: Implications for clinical trials. Neurology 2018;90(14):e1257-e1266; doi: 10.1212/wnl.0000000000005258
4. Chien C, Juenger V, Scheel M, et al. Considerations for Mean Upper Cervical Cord Area Implementation in a Longitudinal MRI Setting: Methods, Interrater Reliability, and MRI Quality Control. AJNR Am J Neuroradiol 2020;41(2):343-350; doi: 10.3174/ajnr.A6394
5. Lukas C, Bellenberg B, Prados F, et al. Quantification of Cervical Cord Cross-Sectional Area: Which Acquisition, Vertebra Level, and Analysis Software? A Multicenter Repeatability Study on a Traveling Healthy Volunteer. Front Neurol 2021;12(693333; doi: 10.3389/fneur.2021.693333
6. Grabher P, Callaghan MF, Ashburner J, et al. Tracking sensory system atrophy and outcome prediction in spinal cord injury. Ann Neurol 2015;78(5):751-761; doi: 10.1002/ana.24508
7. Oztek MA, Brunnquell CL, Hoff MN, et al. Practical Considerations for Radiologists in Implementing a Patient-friendly MRI Experience. Top Magn Reson Imaging 2020;29(4):181-186; doi: 10.1097/rmr.0000000000000247
8. Nöth U, Hattingen E, Bähr O, et al. Improved visibility of brain tumors in synthetic MP-RAGE anatomies with pure T1 weighting. NMR in Biomedicine 2015;28(7):818-830; doi: https://doi.org/10.1002/nbm.3324
9. Tanenbaum LN, Tsiouris AJ, Johnson AN, et al. Synthetic MRI for Clinical Neuroimaging: Results of the Magnetic Resonance Image Compilation (MAGiC) Prospective, Multicenter, Multireader Trial. AJNR Am J Neuroradiol 2017;38(6):1103-1110; doi: 10.3174/ajnr.A5227
10. Gracien R-M, van Wijnen A, Maiworm M, et al. Improved synthetic T1-weighted images for cerebral tissue segmentation in neurological diseases. Magnetic Resonance Imaging 2019;61(158-166; doi: https://doi.org/10.1016/j.mri.2019.05.013
11. Weiskopf N, Suckling J, Williams G, et al. Quantitative multi-parameter mapping of R1, PD(*), MT, and R2(*) at 3T: a multi-center validation. Front Neurosci 2013;7(95; doi: 10.3389/fnins.2013.00095
12. Leutritz T, Seif M, Helms G, et al. Multiparameter mapping of relaxation (R1, R2*), proton density and magnetization transfer saturation at 3 T: A multicenter dual-vendor reproducibility and repeatability study. Human Brain Mapping 2020;41(15):4232-4247; doi: https://doi.org/10.1002/hbm.25122
13. Azzarito M, Seif M, Kyathanahally S, et al. Tracking the neurodegenerative gradient after spinal cord injury. Neuroimage Clin 2020;26(102221; doi: 10.1016/j.nicl.2020.102221
14. Seif M, Ziegler G and Freund P. Progressive Ventricles Enlargement and Cerebrospinal Fluid Volume Increases as a Marker of Neurodegeneration in Patients with Spinal Cord Injury: A Longitudinal Magnetic Resonance Imaging Study. J Neurotrauma 2018;35(24):2941-2946; doi: 10.1089/neu.2017.5522
15. Deichmann R, Good C, Josephs O, et al. Optimization of 3D MP-RAGE sequence for structural brain imaging. NeuroImage 2000;12(112-127; doi: 10.1006/nimg.2000.0601
16. De Leener B, Lévy S, Dupont SM, et al. SCT: Spinal Cord Toolbox, an open-source software for processing spinal cord MRI data. Neuroimage 2017;145(Pt A):24-43; doi: 10.1016/j.neuroimage.2016.10.009
17. Cohen-Adad J, Alonso-Ortiz E, Abramovic M, et al. Open-access quantitative MRI data of the spinal cord and reproducibility across participants, sites and manufacturers. Sci Data 2021;8(1):219; doi: 10.1038/s41597-021-00941-8
Figures
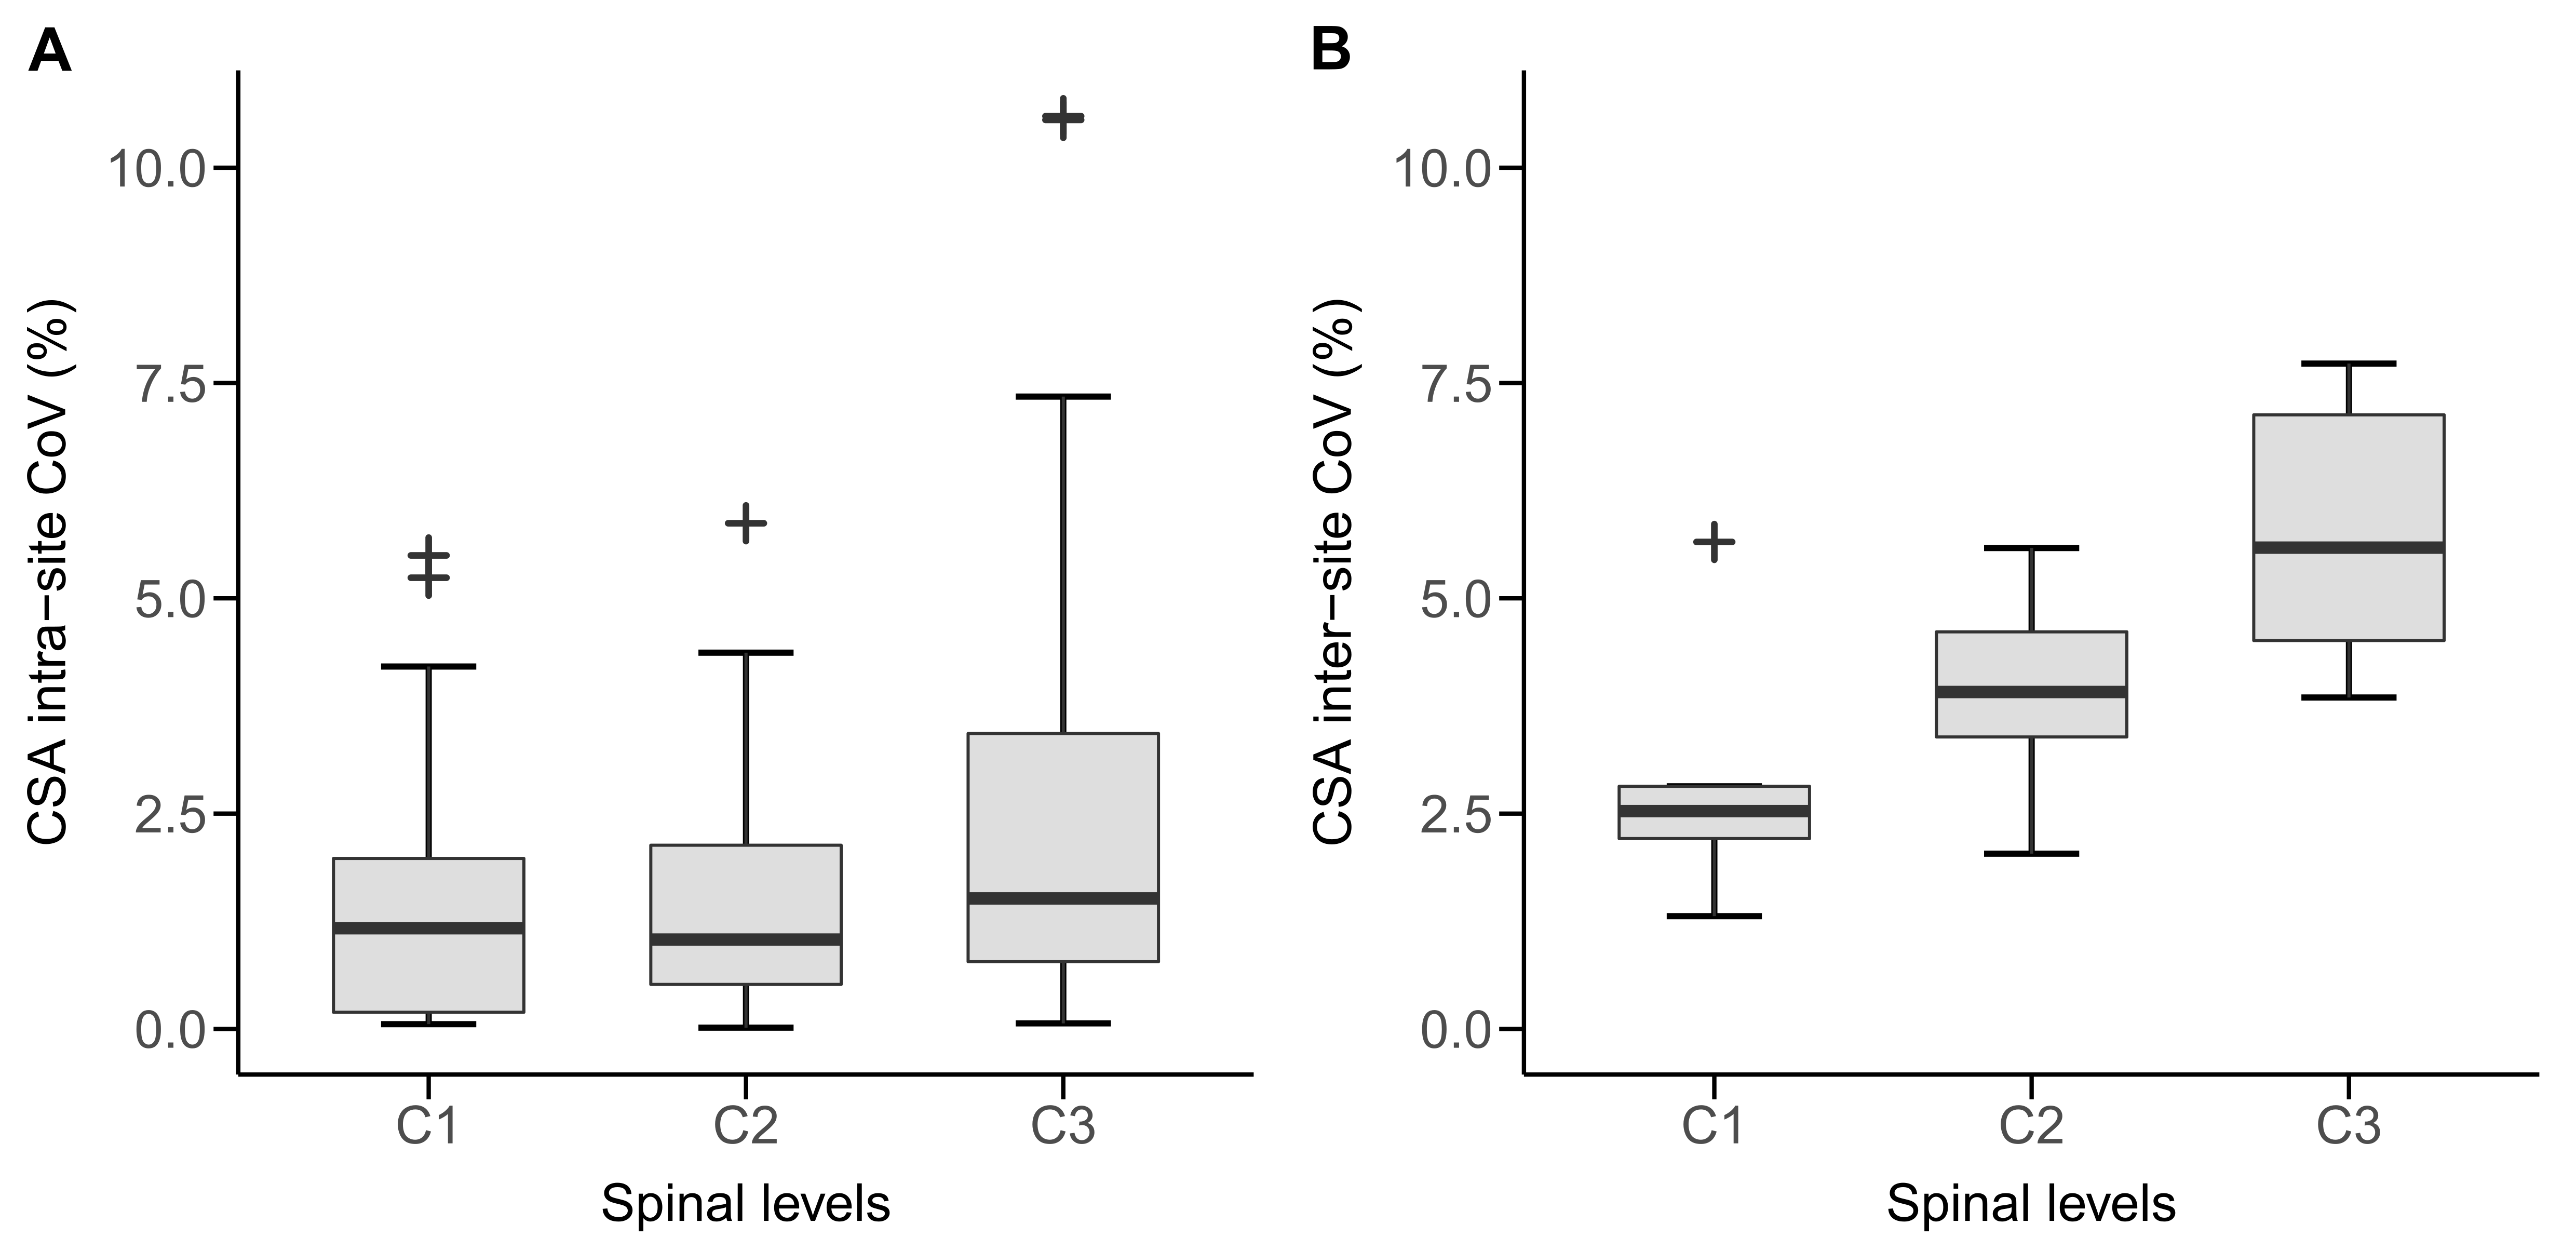
Figure 1 Spinal cord cross-sectional area (CSA) measurements based on the synT1-w MRI: intra-site coefficient of variation (A) and inter-site coefficient of variation (B) of CSA estimates at cervical levels C1-C3.
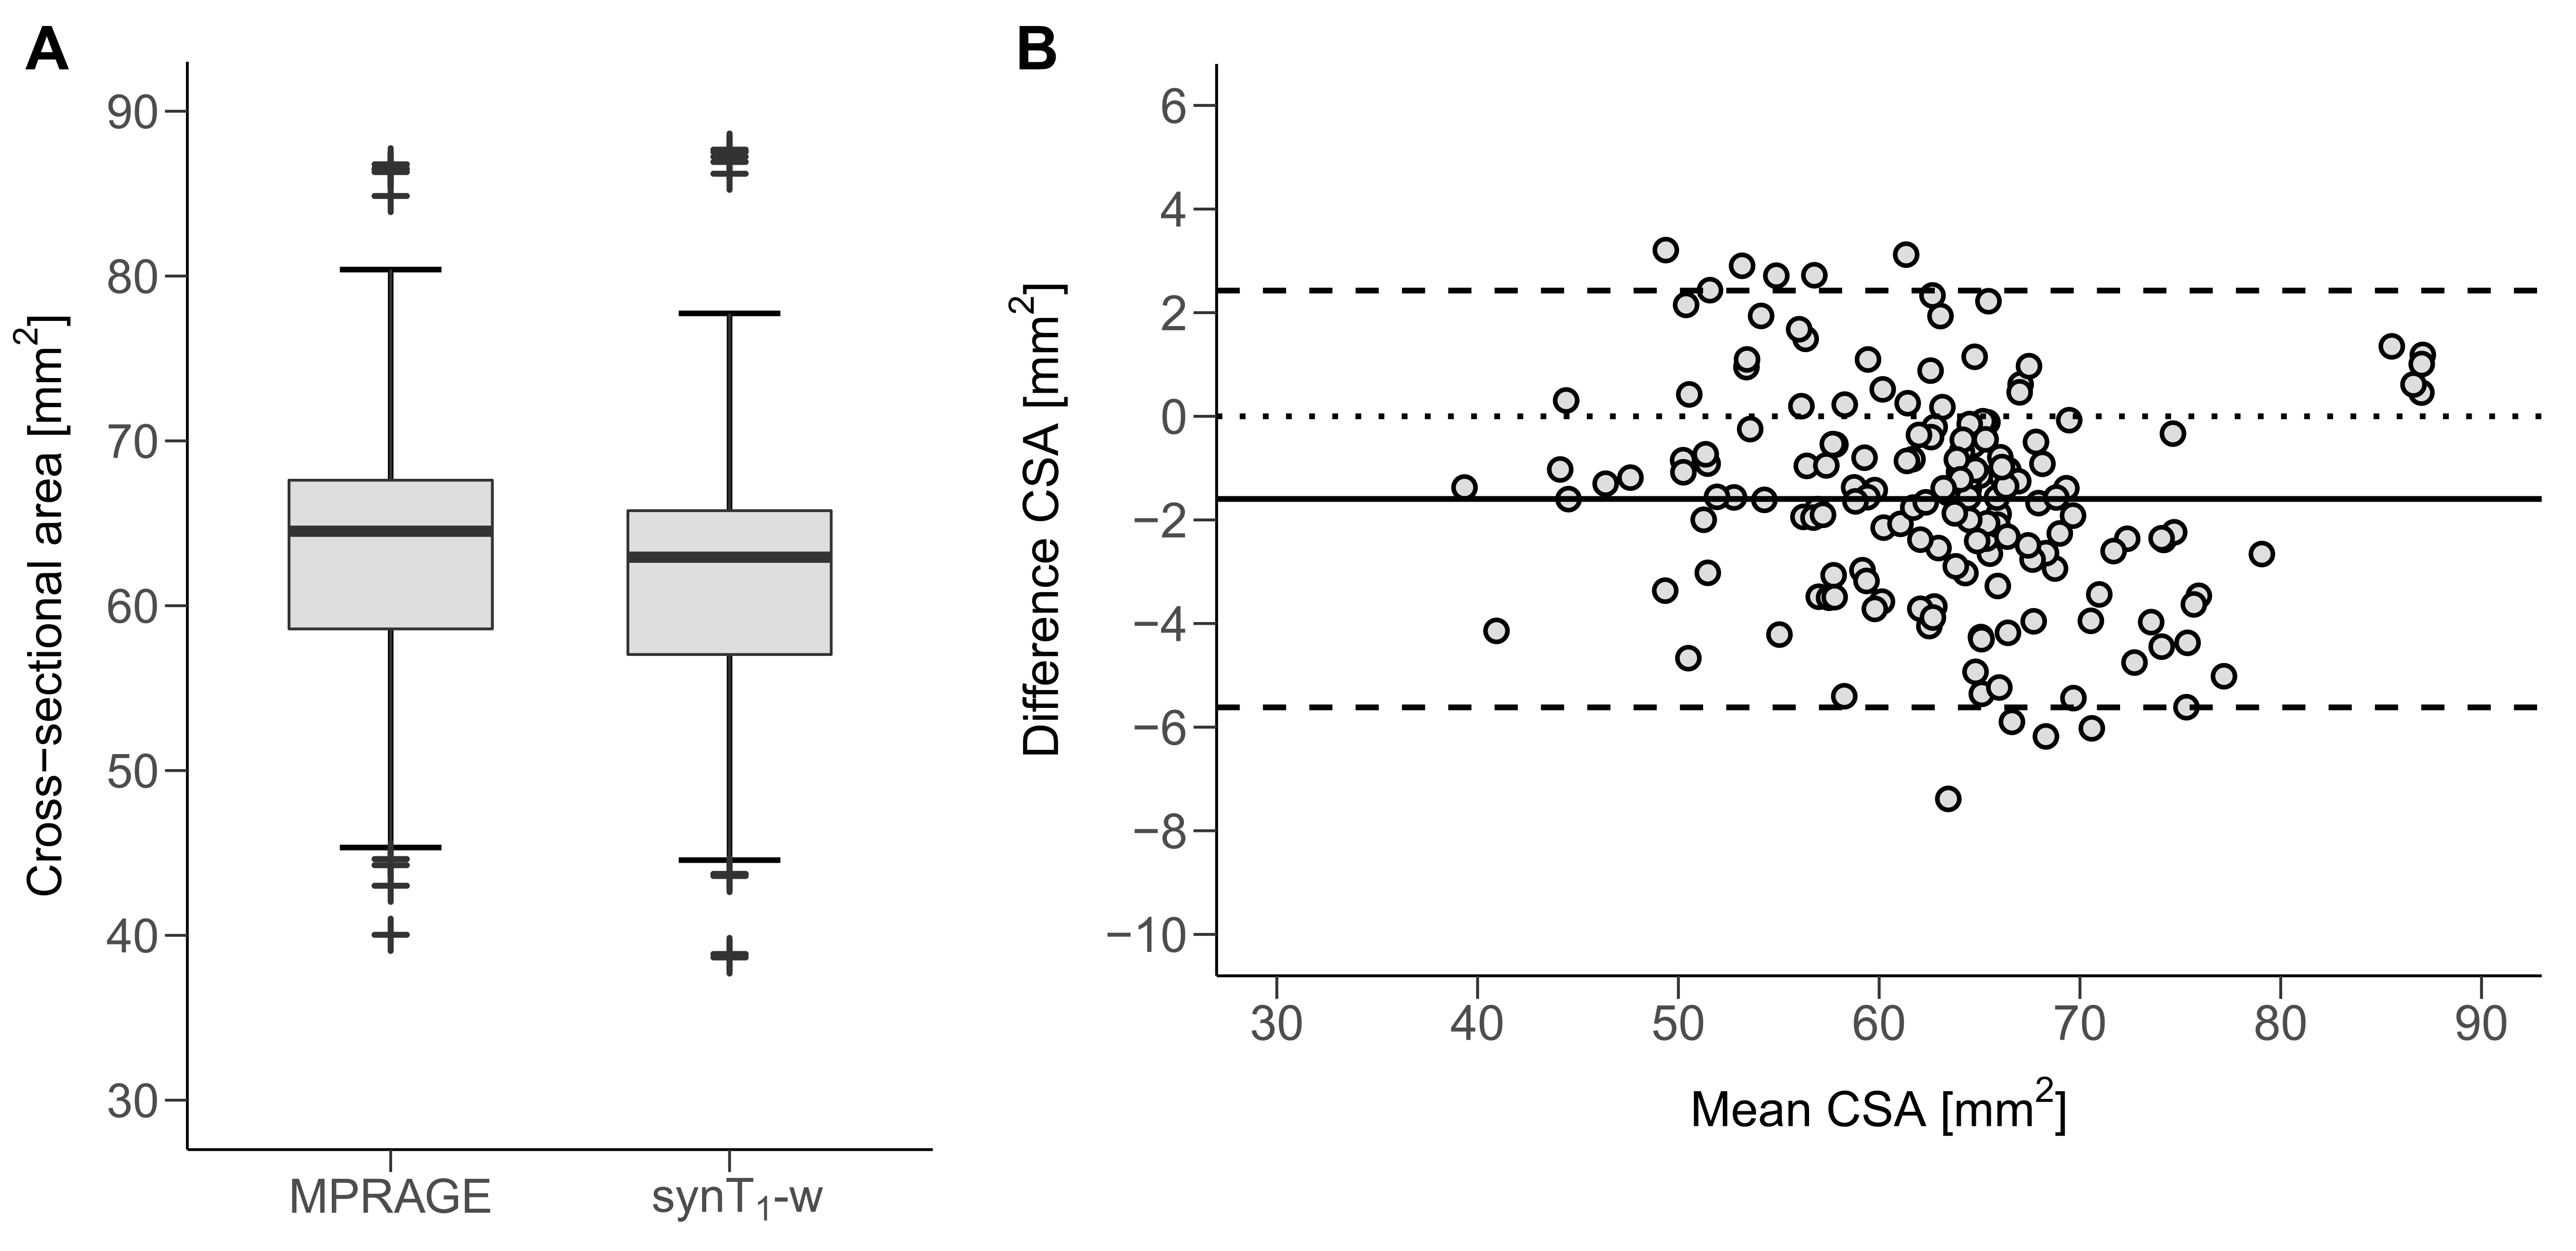
Figure 2 Average spinal cord cross-sectional area (CSA) across C1-C3 for MPRAGE and synT1-w (A). Bland-Altman plot for CSA derived from MPRAGE and synT1-w (B).
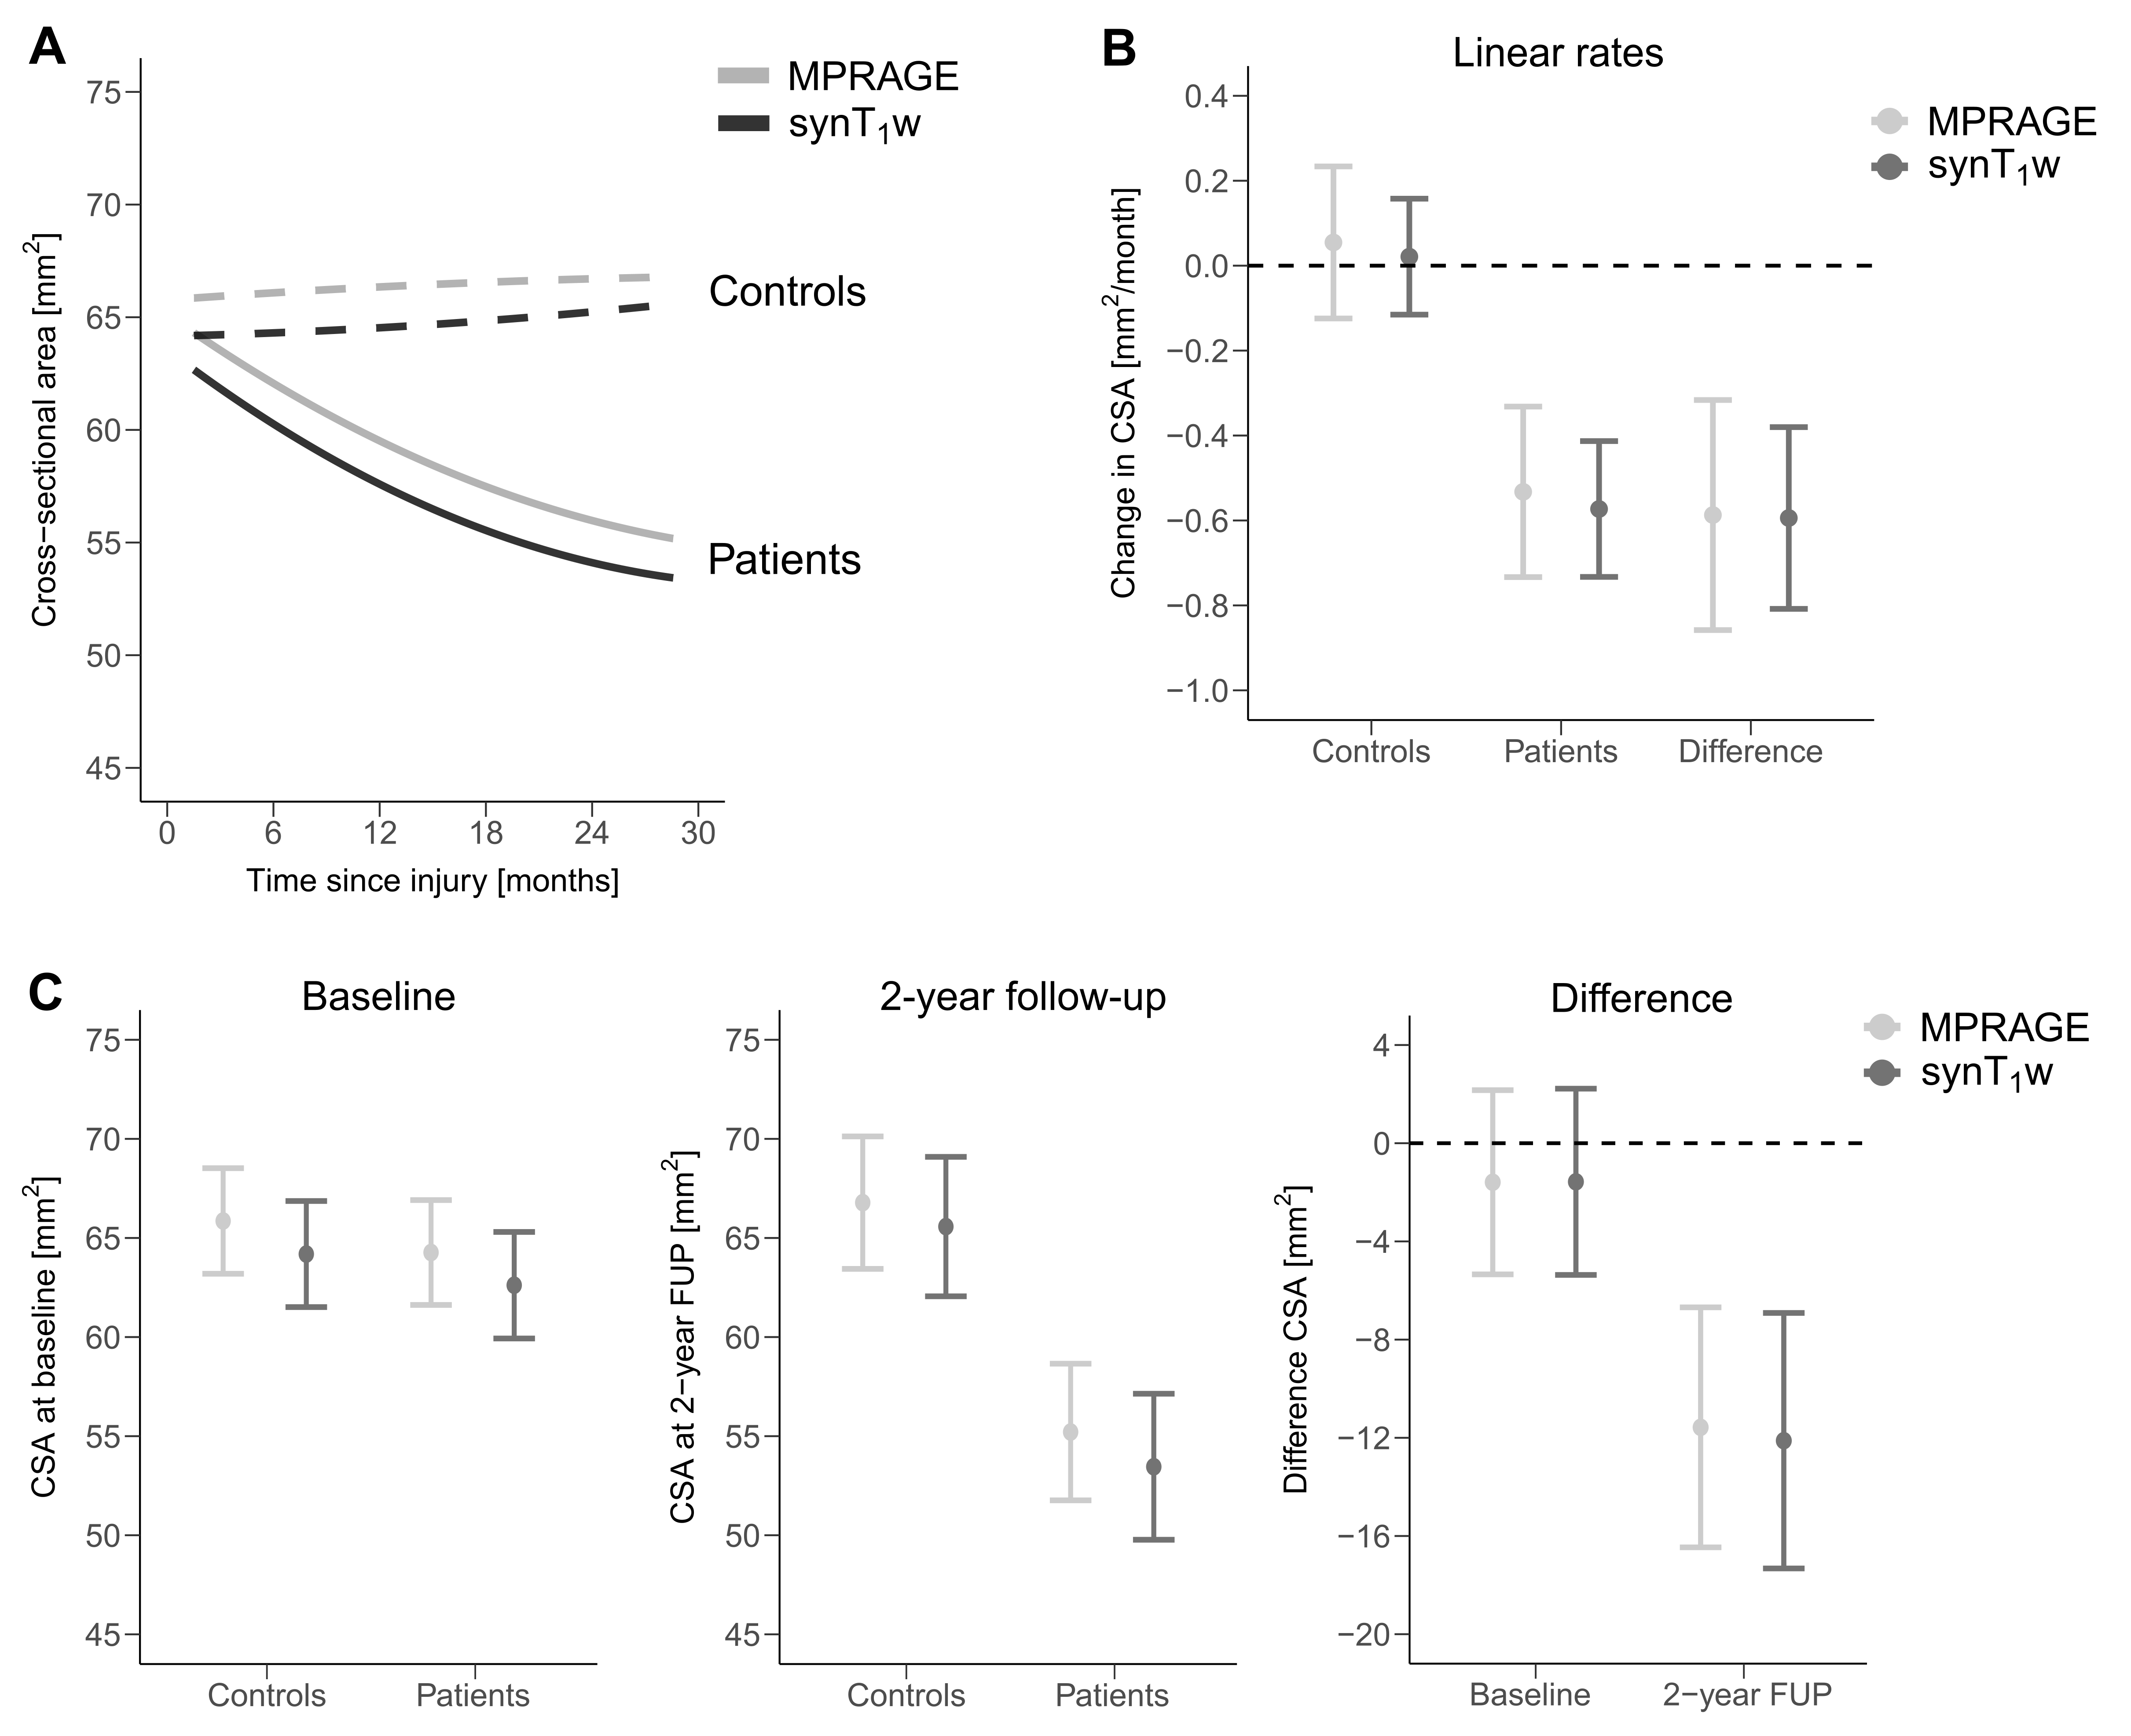
Figure 3 Change in CSA over 2 years for healthy controls and SCI patients estimated based on MPRAGE (light gray) and synT1-w (dark gray) across C1-C3 (A). Linear rates of controls, SCI patients and the difference between groups (B). Average CSA at baseline and 2-year follow up (FUP) for controls, patients, and the difference between groups (C). MPRAGE - light gray; synT1-w - dark gray
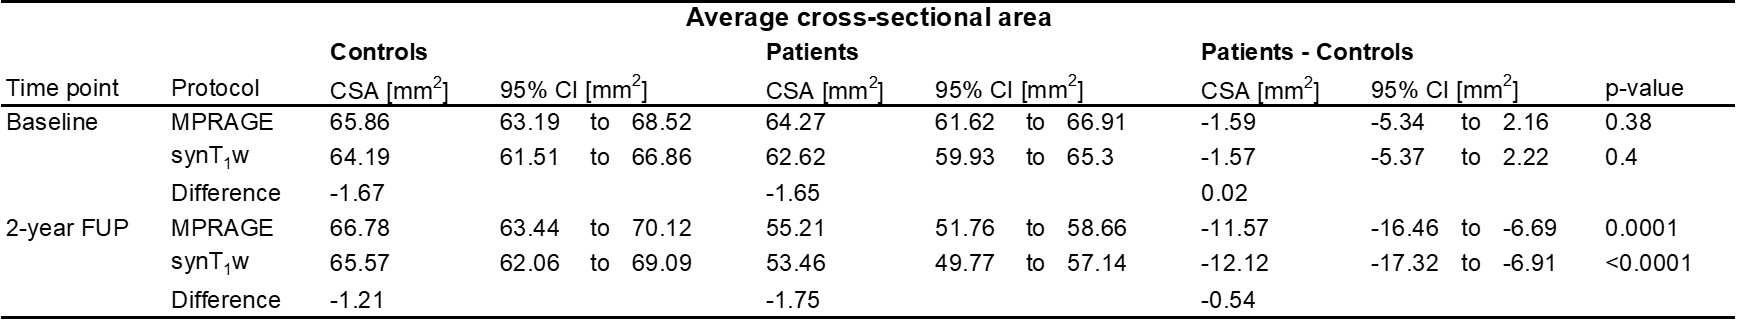
Table 1 Cross-sectional cord area averaged across C1-C3 for MPRAGE and synT1-w segmentations at baseline and 2-year follow-up estimated from linear mixed effects models.
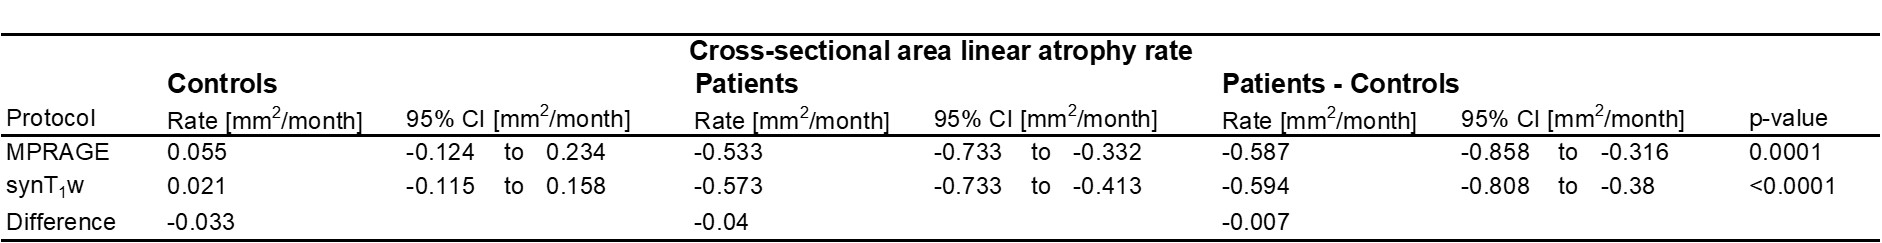
Table 2 Linear rates of cross-sectional cord area atrophy averaged across C1-C3 for MPRAGE and synT1-w estimated from linear mixed effects models.