1553
Effects of neuropathic pain on cerebral hemodynamics in spinal nerve ligation model1UNIST, Ulsan, Korea, Republic of
Synopsis
Keywords: Neuroinflammation, Neuroinflammation, Neuropathic pain
In this study, the effects of neuropathic pain on cerebral hemodynamics was investigated. For the neuropathic pain model, a spinal nerve ligation model was operated and validated by Von Frey test. To estimate the cerebral hemodynamics, DSC-MRI was performed up to 28 days after surgery. As a result, it is possible to specify when or where the neuropathic pain strongly affects cerebral perfusion.Purpose
The spinal nerve ligation (SNL) model is the widely used neuropathic pain model and it induced the pain by ligating L5 and L6 spinal nerves. Therefore, it is obvious that there are physiological changes in spinal cord. However, it is unclear how the neuronal damage on spinal cord affects cerebral hemodynamics. To study the dynamics of cerebral perfusion over time, we performed dynamic susceptibility contrast (DSC) MRI with SNL model.Method
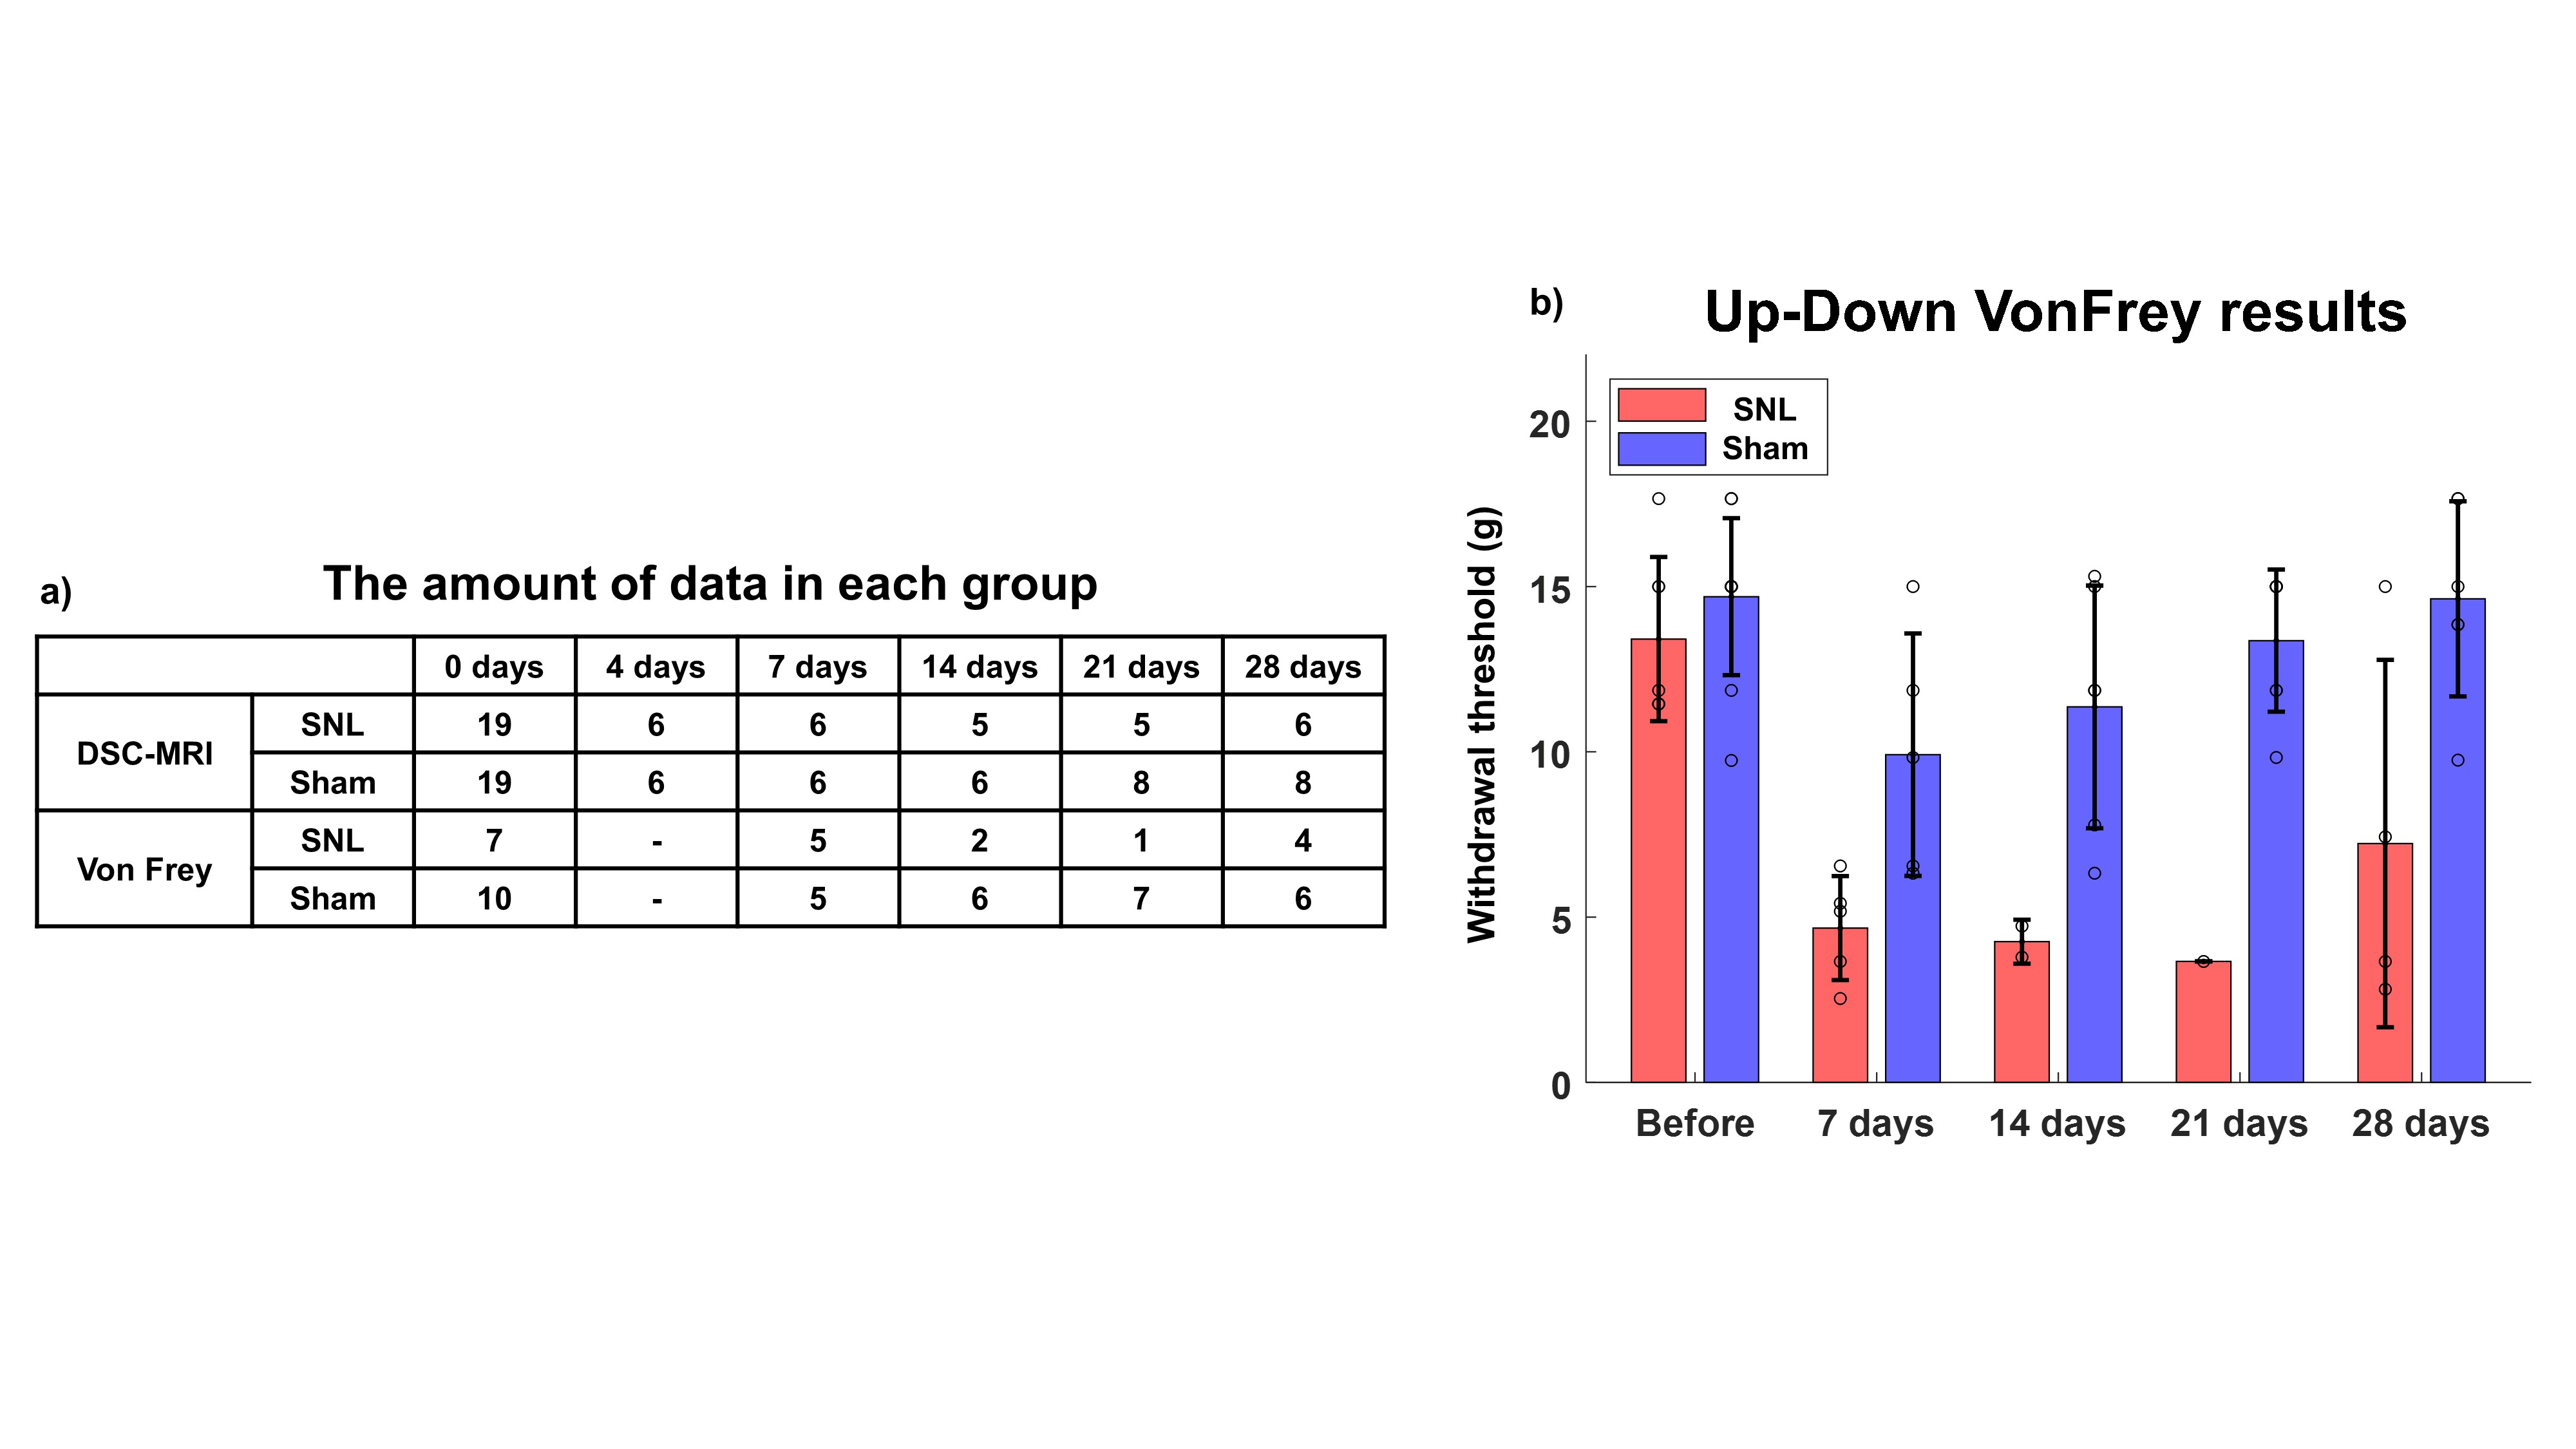
To study the effects of neuropathic pain on cerebral hemodynamics, we compared SNL group and sham group. For SNL group, the L5 and L6 nerves of Sprague-Dawley rats were ligated. For sham group, all surgical procedures were the same as for the SNL group except the nerve ligation. To monitoring the changes of cerebral perfusion, each group was scanned up to 28 days after the surgery. The detailed number of rats used in each group is summarized in Figure 1.a.Up-down Von Frey behavior test was performed to evaluate withdrawal threshold for all group up to 28 days. If the averaged withdrawal threshold for the SNL model was greater than 7 g, the operation was considered failed.
To evaluate cerebral perfusion, all groups were scanned DSC-MRI. For DSC-MRI, 0.1 mmol/kg of Gd-DOTA was injected 30 second after EPI scan. Detailed EPI sequence parameters as follows: TR = 1000 ms, TE = 13.5 ms, FOV = 20x15 mm, Matrix size = 80x60, Number of slices = 25, Spatial resolution = 0.25x0.25 mm2, Slice thickness = 0.5 mm.
For DSC analysis, individual artery input function (AIF) was measured from internal carotid artery and three different perfusion parameter maps were calculated by the AIF devolution method [1].
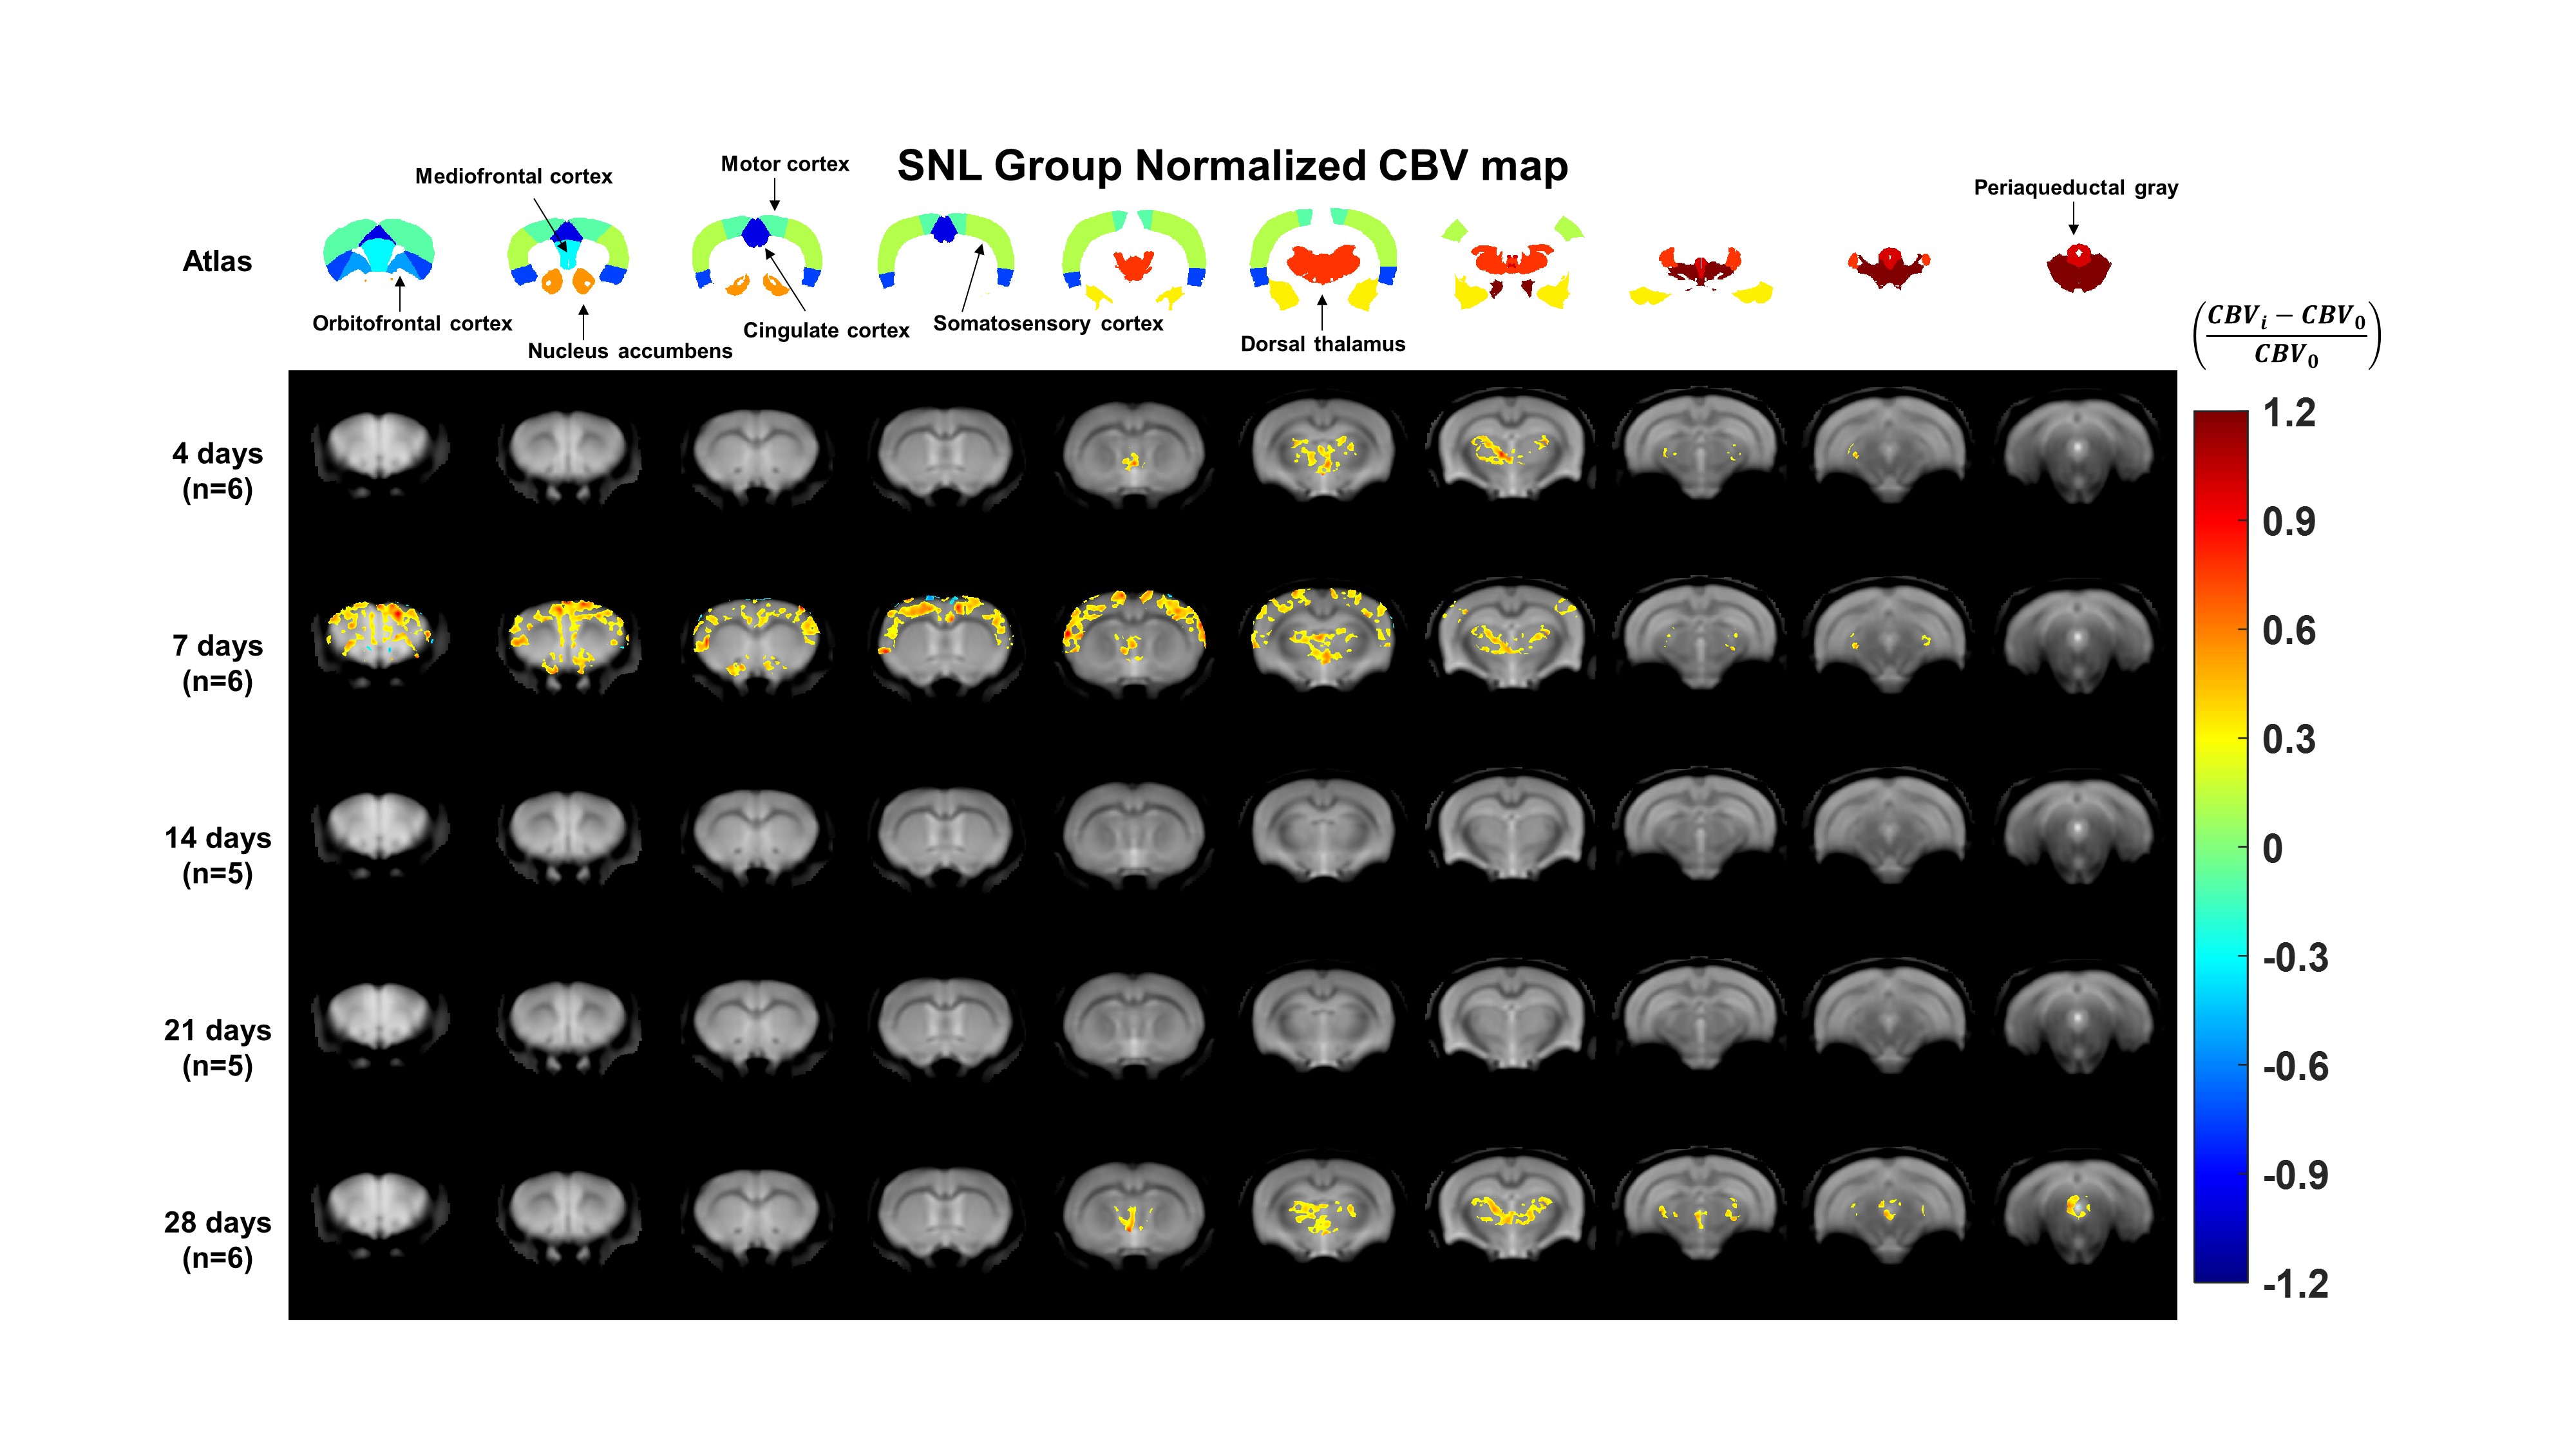
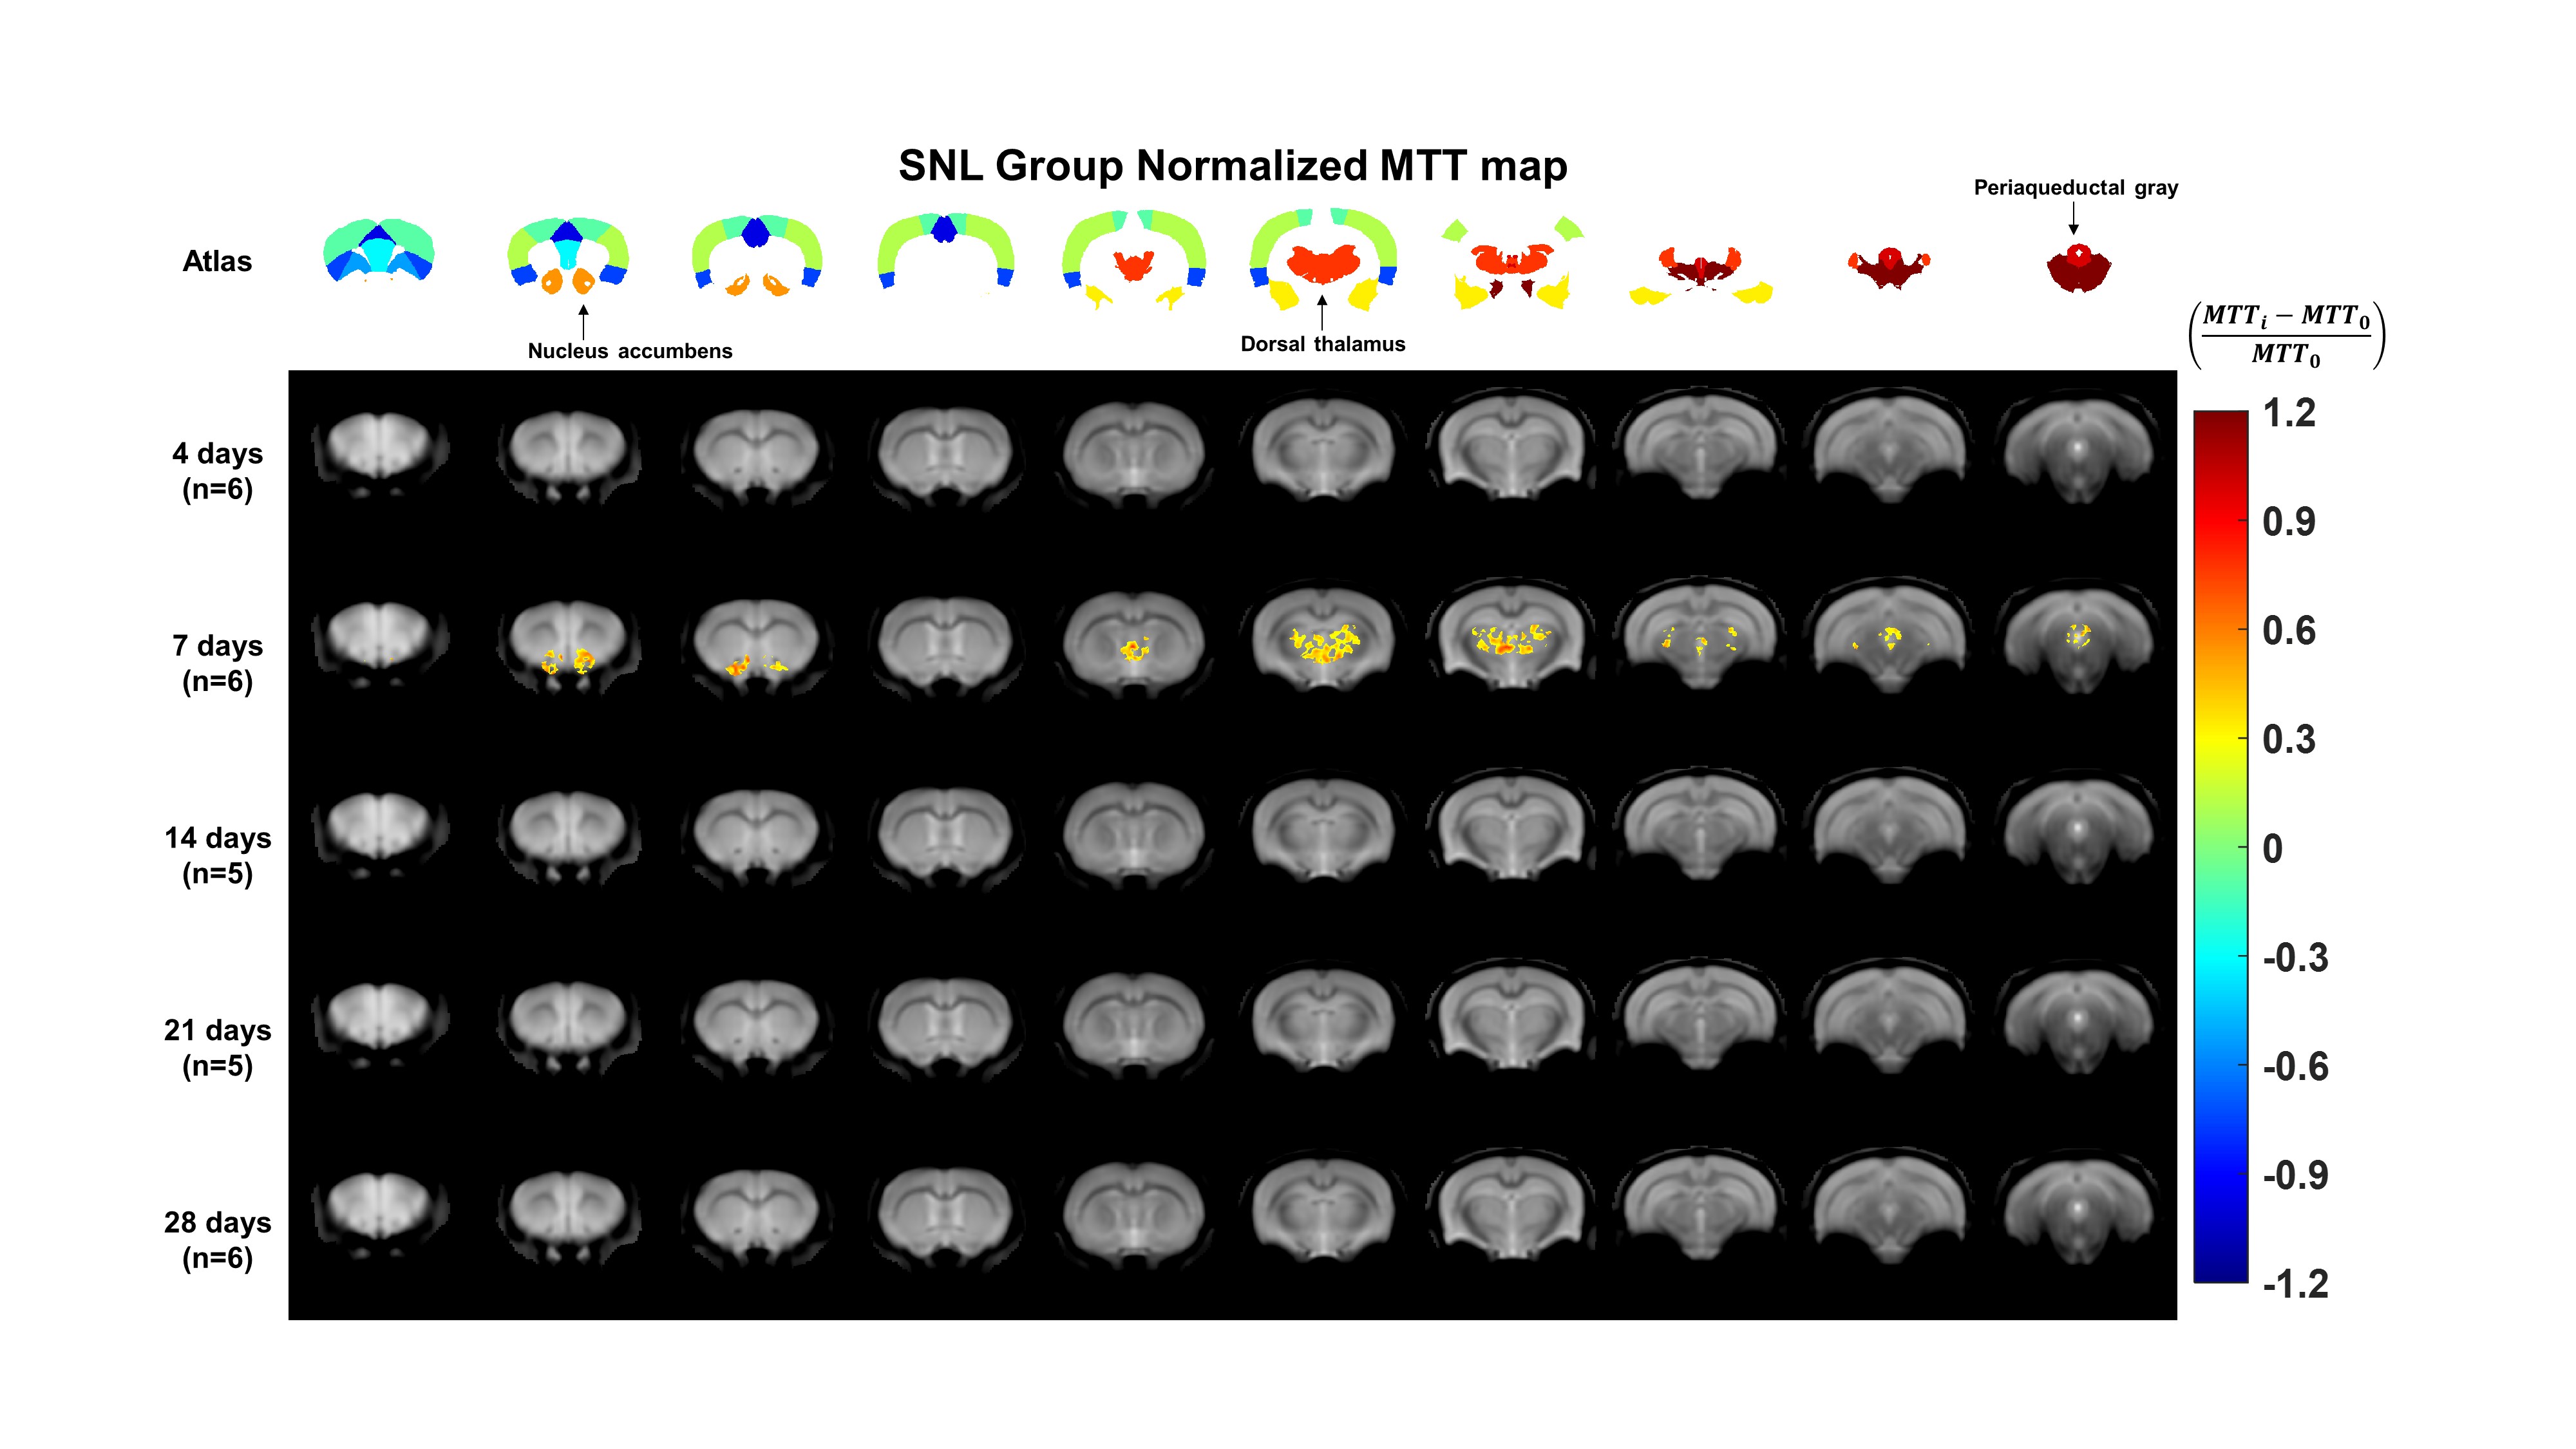
After computing individual perfusion maps, all the perfusion maps were performed image registration based on Atlas [2]. For statistical analysis, one-way ANOVA tests were performed on the 11 different brain regions involved in neuropathic pain pathways [3-5]. To evaluate the changes in cerebral perfusion, the computed perfusion maps for each group were averaged and normalized to the DSC maps from before surgery according to the following equation (Normalized DSC map = (DSC mapi-DSC map0)/DSC map0. where DSC mapi and DSC map0 are DSC map from after surgery groups and before surgery group, respectively). For the normalized DSC map visualization, we only displayed regions that met two conditions. The two conditions are as follows: 1) the areas which are statistically significantly different to before surgery among the 11 brain regions. 2) the areas which are the normalized DSC values greater than 0.3 or less than -0.3.
Results
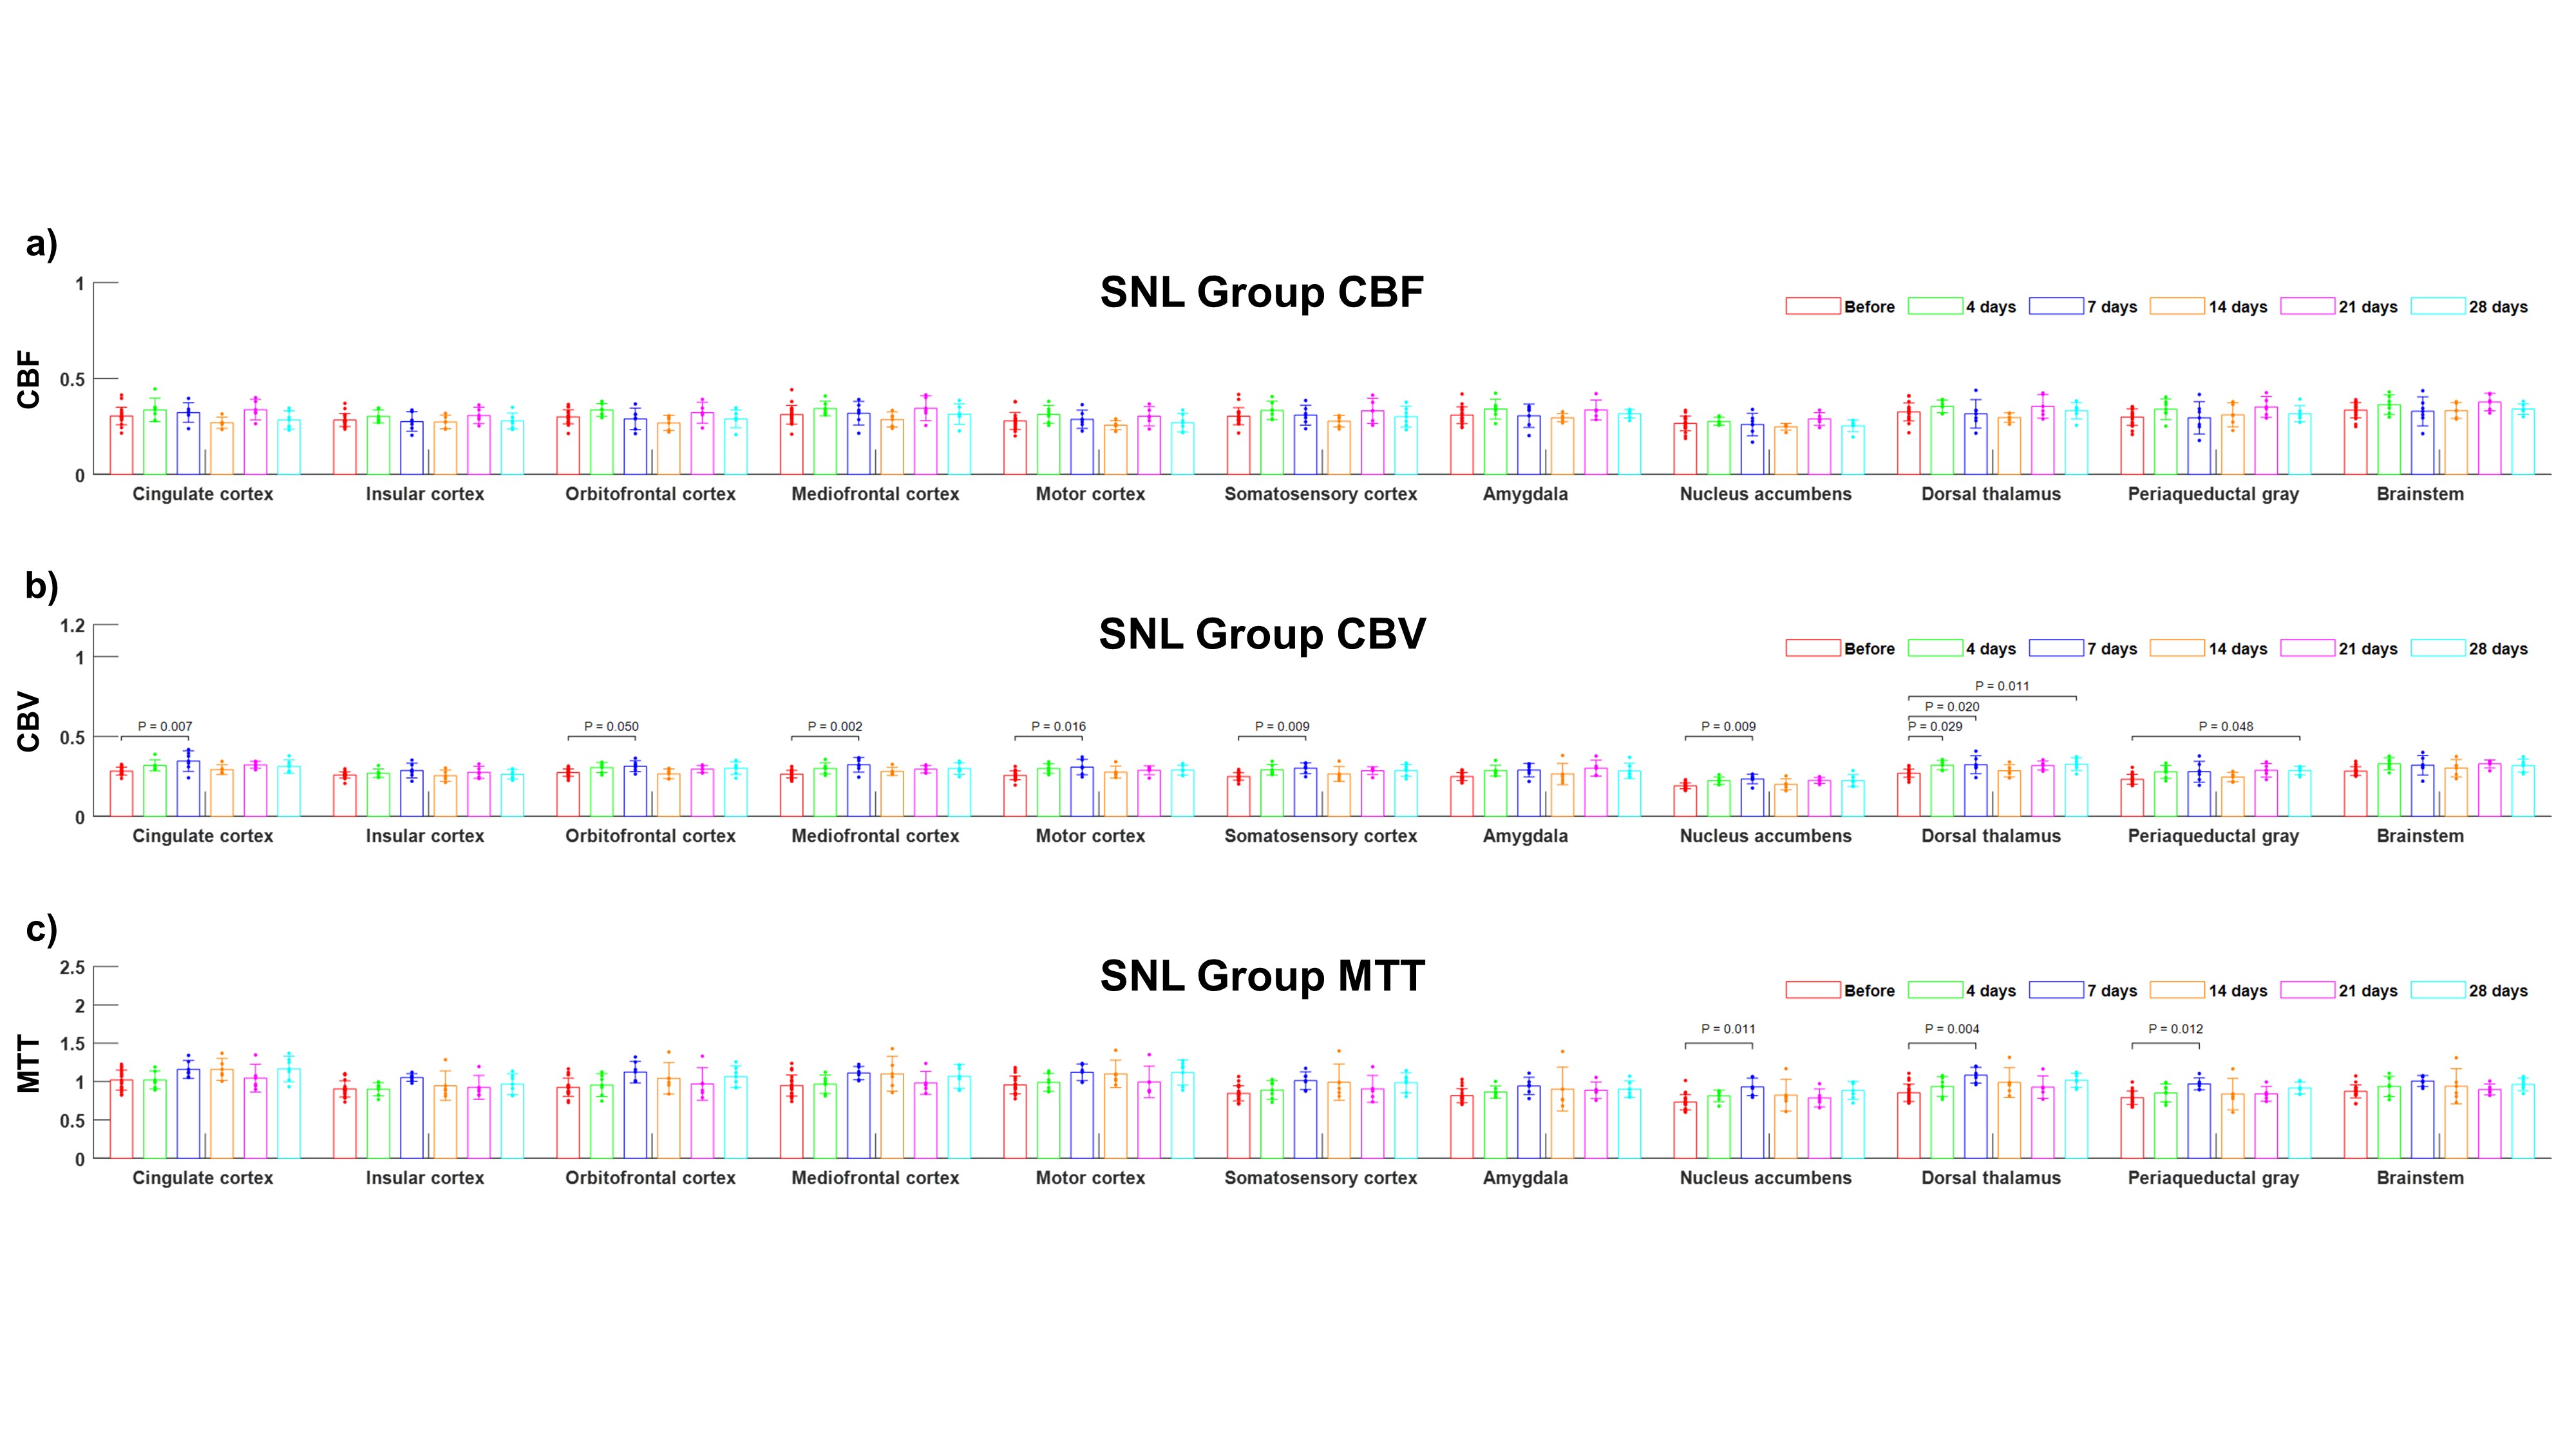
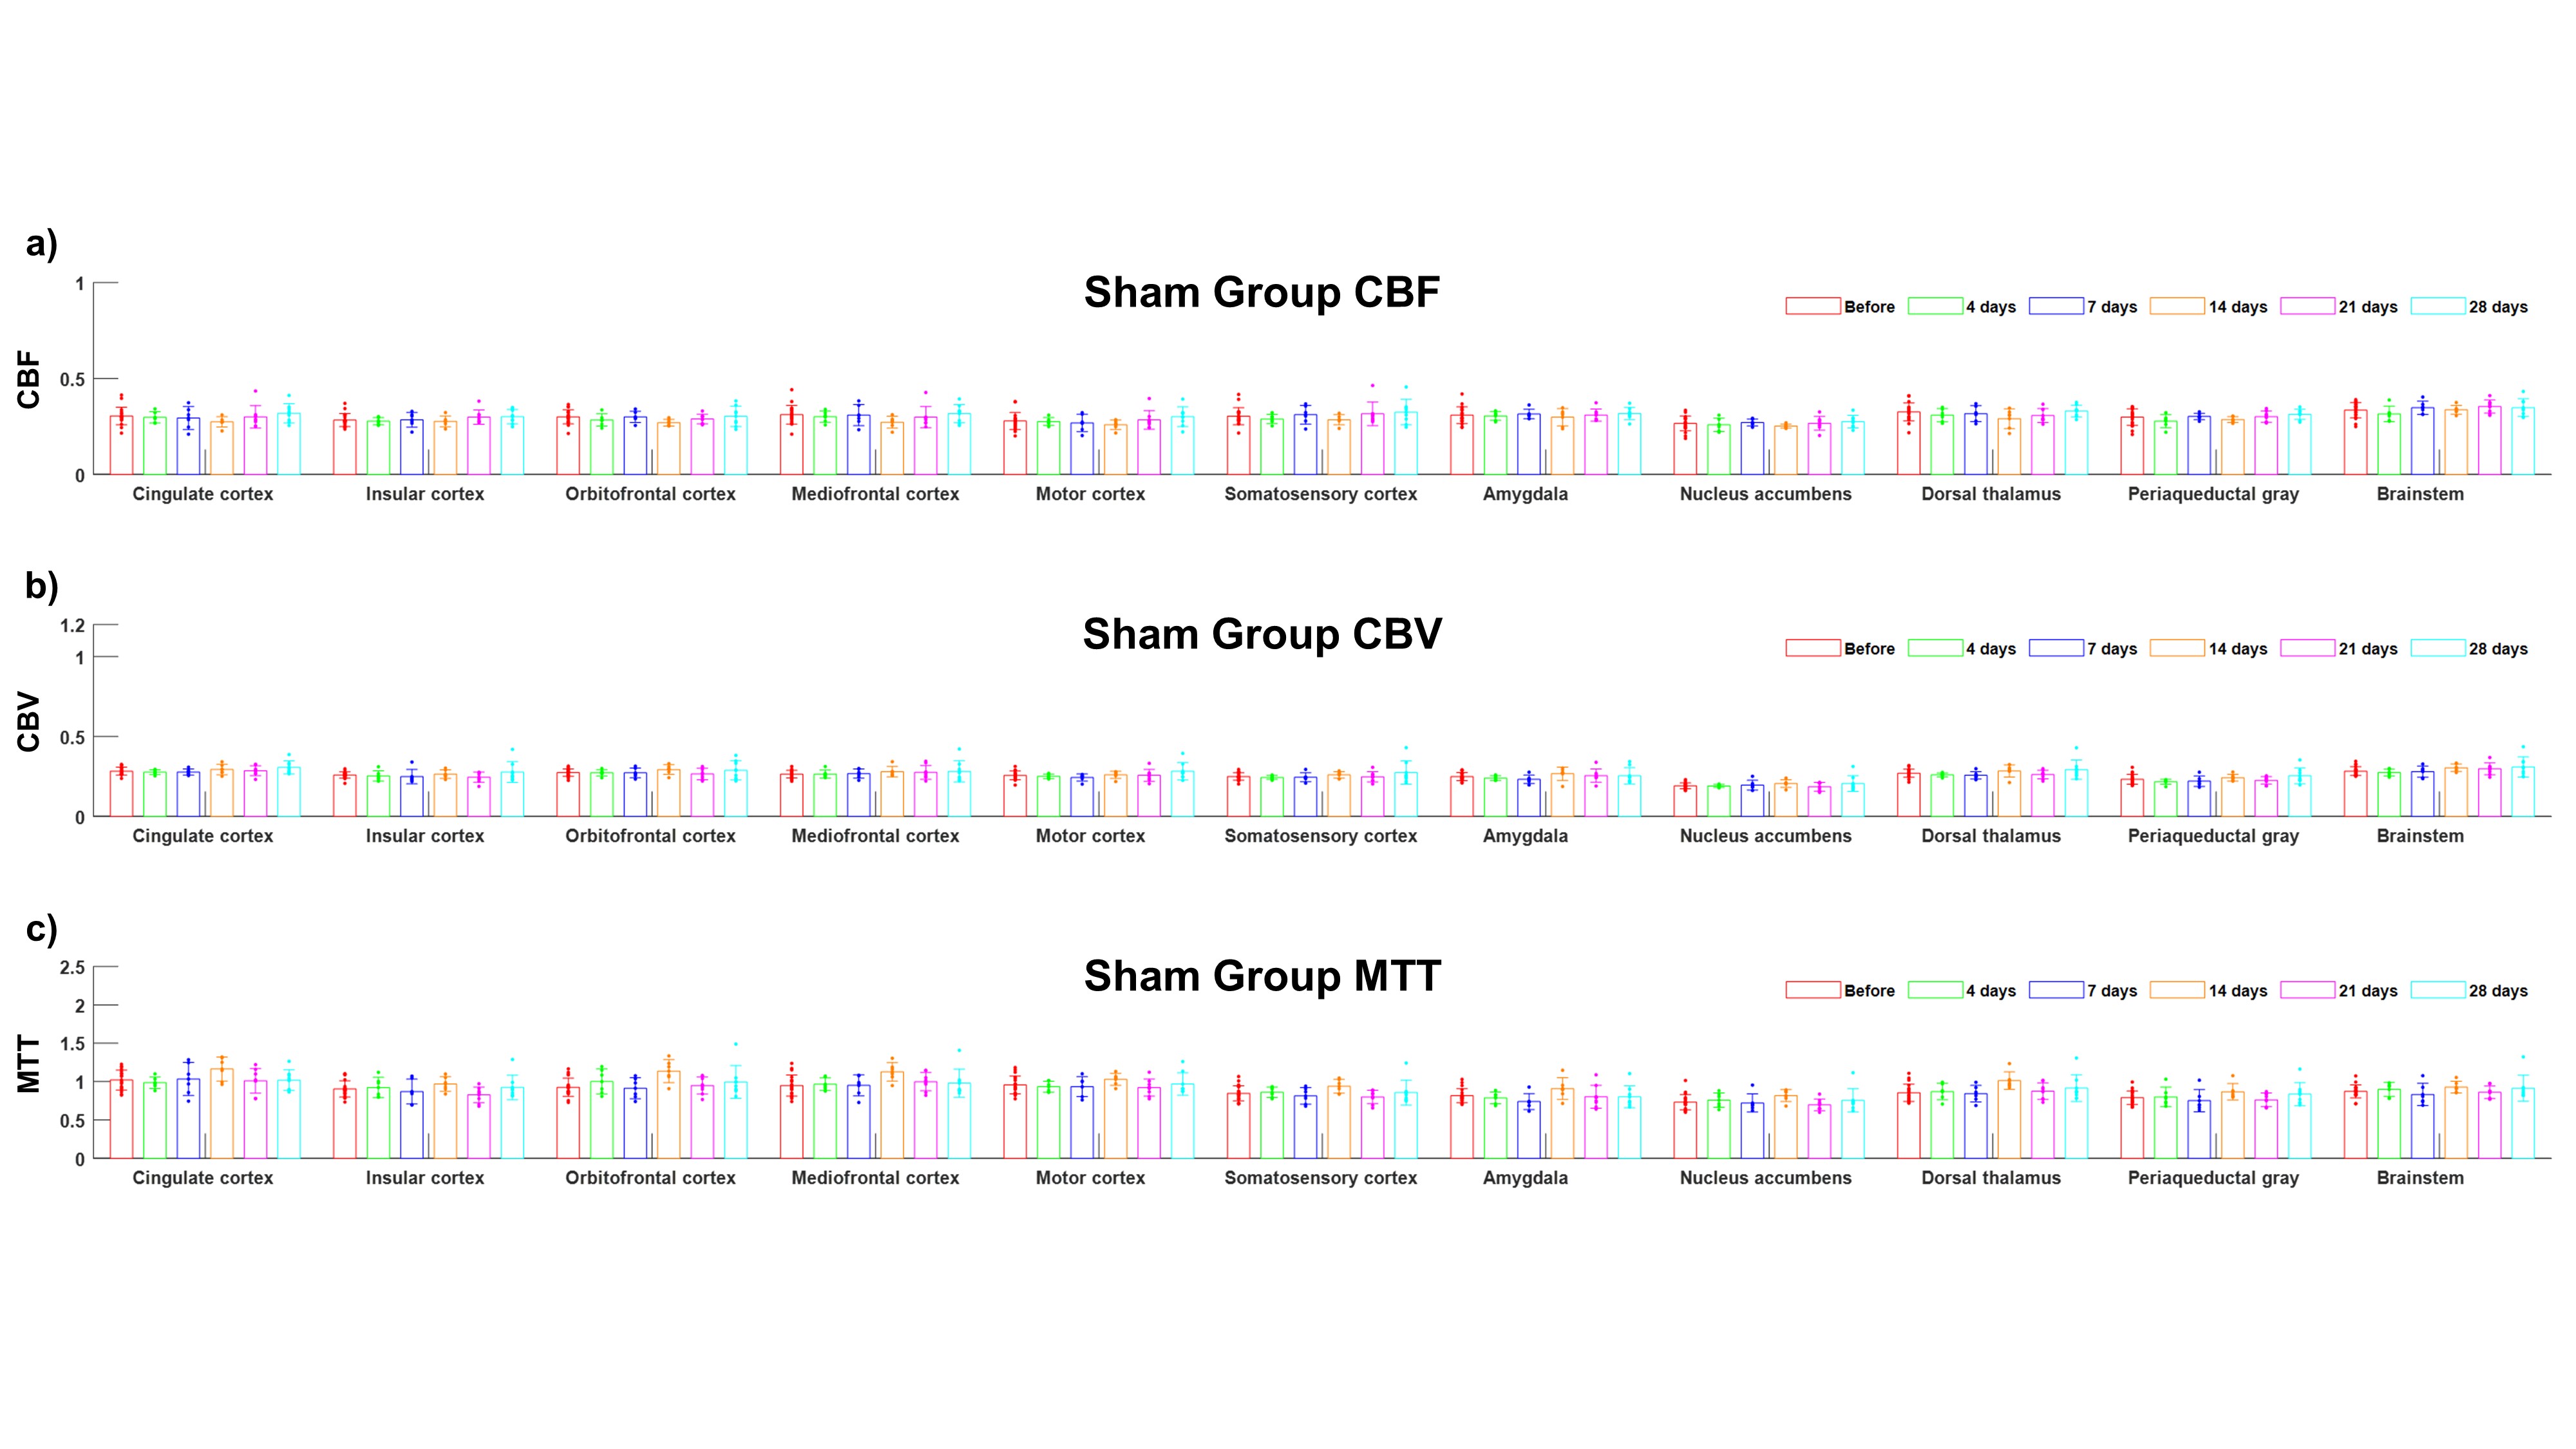
As shown in Figure 1.b, the withdrawal threshold for SNL group was lower than sham group. For SNL group, there was no significant CBF changes in all the time points as shown in Figure 2.a. However, for CBV and MTT, there were significantly changed regions in certain region and time points as shown in Figure 2.b and c. For sham group, there were no significant cerebral perfusion changes in all the time points as shown in Figure 3. The normalized CBV and MTT maps in SNL model are shown in Figure 4 and 5, respectively. As shown in Figure 4, the CBV of thalamus is increased at 4,7 and 28 days. Also, at 7 days after surgery, the CBV in some cortical areas are increased. For the normalized MTT map, there are MTT changes at 7 days only.Discussion
Comparing SNL and sham groups, we observed that neuropathic pain affects cerebral perfusion. For the SNL model, the pain induced vasodilation or blood pressure drop by increasing CBV or MTT, respectively. Especially, CBV and MTT of thalamus is frequently changed over time, and it reflects that thalamus is mainly related to neuropathic pain. Also, there are hemodynamic changes in several areas associated with neuropathic pain at 7 days after surgery. It suggests that neuropathic pain has the largest effect on cerebral vessels at 7 days.Conclusion
Neurons are well known to be closely connected with blood vessels, and several papers have studied the effects of pain on blood vessels [6-8]. Therefore, hemodynamics measurement allows an indirect assessment of pain. In this study, we tried to monitor the effects of spinal neuropathic pain on cerebral hemodynamics over time. By quantifying the changes of cerebral perfusion, we could estimate the spatial and temporal effects of pain on the brain. However, there are several limitations in this study. First, the measurement of hemodynamic changes is not direct way to evaluate pain. Second, there may appear to be no change in cerebral perfusion due to lack of data between days 14 and 21. For the further study, we are planning to increase the amount of data. In addition, histological data or metabolic image data should be supported for the effects of pain on the brain.Acknowledgements
This work was supported by the National Research Foundation of Korea (NRF) grant funded by Ministry of Science and ICT (MSIT) (Grant No. NRF-2022R1C1C2003805), and the 2021 Joint Research Project of the Institutes of Science and TechnologyReferences
1. Østergaard, L. (2005). Principles of cerebral perfusion imaging by bolus tracking. Journal of Magnetic Resonance Imaging: An official journal of the international society for magnetic resonance in medicine, 22(6), 710-717.
2. Papp EA, Leergaard TB, Calabrese E, Johnson GA, Bjaalie JG (2014) Waxholm Space atlas of the Sprague Dawley rat brain. NeuroImage, 97, 374-386. RRID: SCR_017124
3. Yang, S., & Chang, M. C. (2019). Chronic pain: structural and functional changes in brain structures and associated negative affective states. International journal of molecular sciences, 20(13), 3130.
4. Xie, Y. F., Huo, F. Q., & Tang, J. S. (2009). Cerebral cortex modulation of pain. Acta Pharmacologica Sinica, 30(1), 31-41.
5. Zhuo, M. (2007). Neuronal mechanism for neuropathic pain. Molecular pain, 3, 1744-8069.
6. Ved, Nikita, et al. "Diabetes‐induced microvascular complications at the level of the spinal cord: a contributing factor in diabetic neuropathic pain." The Journal of Physiology 596.16 (2018): 3675-3693.
7. Paquette, Thierry, et al. "Functional Neuroimaging of Nociceptive and Pain‐Related Activity in the Spinal Cord and Brain: Insights From Neurovascular Coupling Studies." The Anatomical Record 301.9 (2018): 1585-1595.
8. Jeffrey-Gauthier, Renaud, Jean-Paul Guillemot, and Mathieu Piché. "Neurovascular coupling during nociceptive processing in the primary somatosensory cortex of the rat." PAIN® 154.8 (2013): 1434-1441.
Figures