1550
Quantitative evaluation of the spinal cord compression in patients with cervical spondylotic myelopathy using synthetic MRI
Xiangyu Tang1, Haoyue Shao1, Weiyin Vivian Liu2, Qiufeng Liu1, and Wenzhen Zhu1
1Radiology department, Tongji hospital, Tongji medical college, Huazhong University of science and technology, Wuhan, China, 2MR Research, GE Healthcare, Beijing, China
1Radiology department, Tongji hospital, Tongji medical college, Huazhong University of science and technology, Wuhan, China, 2MR Research, GE Healthcare, Beijing, China
Synopsis
Keywords: Spinal Cord, Quantitative Imaging, Synthetic MRI, Cervical spondylotic myelopathy
The present study for the first time applied synthetic MRI in diagnosis of patients with cervical spondylotic myelopathy. Multiple relaxation maps (T1, T2 and PD maps) and contrast-weighted images were obtained in a single scan of synthetic MRI. Our study demonstrated that T1 and T2 relaxation times of spinal cord at maximal compression level (MCL) changed with a grade dependent difference and T1MCL value could sensitively reflect the microstructural alteration of compressive spinal cord and even MCL at grade I, Moreover, T1MCL and T2MCL value was related to clinical scores and diameter values of the spinal cord at MCL.Introduction and Purpose
Cervical spondylotic myelopathy (CSM) is a chronic compressive spinal cord lesion. It is the most common form of spinal cord injury in adults, especially in older patients (1). It is important to identify early symptoms and provide effective treatments before development of irreversible spinal cord damage. Conventional MRI usually including T1- and T2-weighted images can provide high-resolution images such as vertebrae, spinal cord, and surrounding soft tissues. However, alterations of the T1 and T2 signal intensity still limit the diagnosis of early stages of CSM. To dig out a sensitive and reproducible imaging biomarker for early diagnosis and quantification of spinal cord compression, quantitative MRI might be an option. This work aimed to investigate the feasibility and diagnostic value of synthetic MRI including T1, T2 and PD values in determining the severity of CSM.Materials and Methods
Patients: A total of 60 subjects (51 CSM patients and 9 healthy controls) were recruited in this study. The criterion for inclusion in the CSM group was spinal canal stenosis (SCS), defined as narrowed anteroposterior diameter on the radiologic imaging, with clinical signs of myelopathy. Imaging: All subjects underwent synthetic MRI scan (MAGiC, MAGnetic Resonance Image Compilation) on a 3.0T MR scanner (Signa Architect, GE Healthcare, Waukesha, WI). Synthetic MRI scan of the spinal cord was performed at 0.5 mm in-plane resolution and 4 mm slice thickness in multiple axial sections perpendicular to the spinal cord. Other imaging parameters for MAGiC were: TR: 4008ms, TE: 29.3ms, Spacing: 1.0mm, Matrix size: 400×400, NEX: 1.00, Scanning time: 7min45s. Data processing: According to the MRI grading system proposed by Kang et al. (2), all subjects were classified into four grades (from grade 0 to grade III with the severity of SCS). The T1, T2, PD maps were generated by an offline post-processing software (SyMRI 11.2.2; SyntheticMR, Linköping, Sweden) in addition to automatically generated multiple contrast images, including T1WI, T2WI, PDWI simultaneously. ROIs were manually drawn at maximal compression level (MCL) on a synthetic T2-weighted image by covering the whole spinal cord to generate T1MCL, T2MCL, and PDMCL values in grade I-III groups, and the MAGIC quantitative values of grade 0 group were the average values of spinal cord at C2/3-C6/7 intervertebral disc levels(Figure 1). Besides, the anteroposterior (AP) and transverse (Trans) diameters of the spinal cord on axial imaging were measured in grade II and grade III groups. The sections of spinal cord for measurement we chosed were the MCL and the normal level nearest the MCL, as shown in Figure 2. Relative values of AP and Trans diameters was calculated as follows: rAP=APMCL/APnormal, rTrans = Trans MCL/ Transnormal. The compression ratio was defined as following: rMIN= rAP/rTrans. Clinical score of patients and controls were evaluated using the Japanese Orthopaedic Association (JOA) score.Results
1. For the maximal compression level, T1 value showed a decreasing trend with severity of grades (from grade 0 to grade II, P<0.05), while it increased dramatically at grade III. Significant differences were found between adjacent groups from grade 0 to grade III. T2 value showed no significant difference among grades (from grade 0 to grade II), while it increased dramatically at grade III (P<0.05). PD value showed no statistically difference among all grades (Figure 3). The JOA score showed a decreasing trend with severity of grades (from grade I to grade III, P<0.05).2. To explain the dramatically change of T1MCL and T2MCL value from grade II to grade III, we compared the diameter values of the spinal cord at MCL in grade II and grade III and tried to find the association of MAGIC quantitative values, diameter values and clinical score. Our study demonstrated that rAP and rTrans of the spinal cord at MCL showed no significant difference between two groups, while rMIN of grade III was significantly lower than that of grade II (P<0.05), as shown in Figure 4.
3. Multilevel correlations were observed in the CSM patients of grade II and III. T1MCL and T2MCL values were all negatively correlated with JOA scores. T2MCL value was negatively correlated with rMIN, whereas positively correlated with rTrans. Conversely, JOA score negatively correlated with rTrans, whereas positively correlated with rMIN (Figure 5).
Discussion and Conclusions
The trend of T1, T2 and PD values from grade 0 to grade III indicated that T1MCL value could more sensitively reflect the microstructural change of compressive spinal cord than T2MCL and PDMCL. Meanwhile, the result of diameter values in grade II and grade III groups means that T2MCL value ascended only when the spinal cord endured an oblate compression rather than local compression, and the T2MCL increase is associated with unfavorable clinical outcomes. Therefore, synthetic MRI is confirmed to be a reliable and efficient method in the quantitative diagnosis of CSM, and the MAGIC quantitative values could be used as a biomarker for clinical diagnosis for CSM.Acknowledgements
Funding: This project was supported by the National Natural Science Funds of China (Grant No.51907077)References
1. McCormick JR, Sama AJ, Schiller NC, Butler AJ, Donnally CJ, III. Cervical Spondylotic Myelopathy: A Guide to Diagnosis and Management. Journal of the American Board of Family Medicine 2020;33(2):303-313. doi: 10.3122/jabfm.2020.02.190195
2. Kang Y, Lee JW, Koh YH, Hur S, Kim SJ, Chai JW, Kang HS. New MRI grading system for the cervical canal stenosis. AJR American journal of roentgenology 2011;197(1):W134-140. doi: 10.2214/ajr.10.5560
Figures
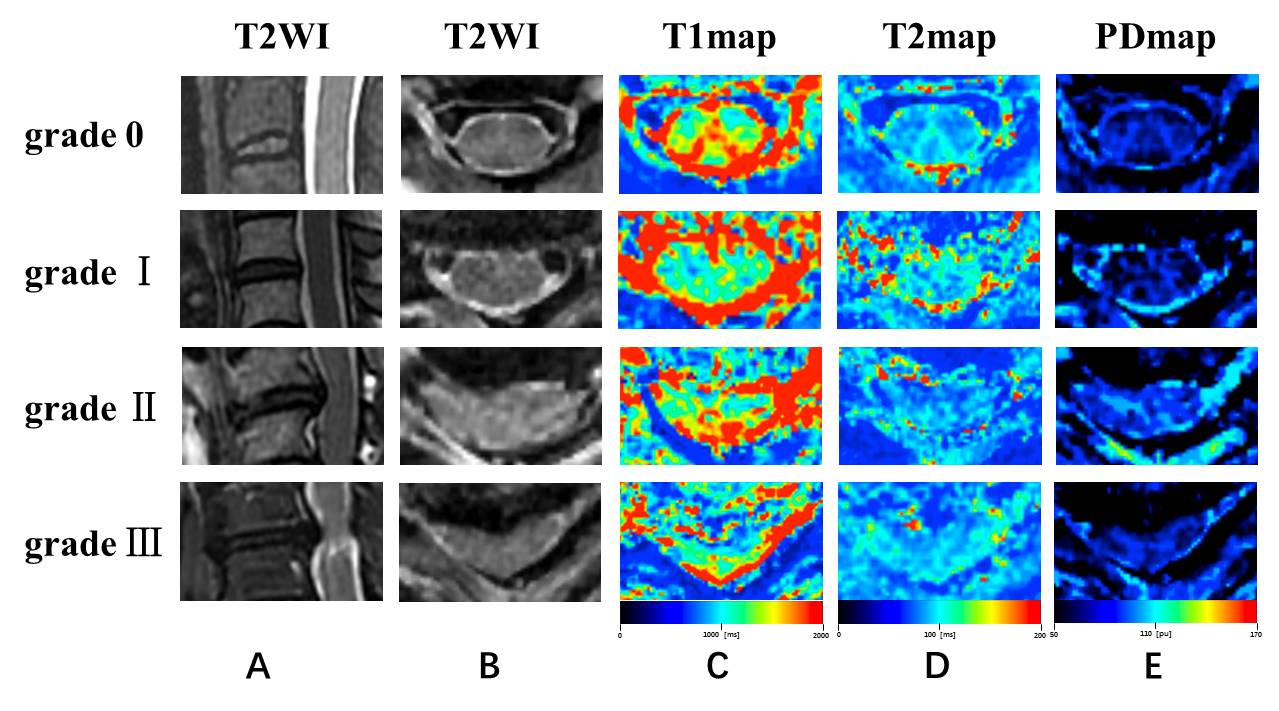
Figure 1. Representation sagittal T2WI
(A), axial T2WI
(B), T1 colormap
(C), T2 colormap
(D) and PD colormap
(E)
of the spinal cord of at C2/3 intervertebral
disc level in
grade 0 group, and the spinal cord at the maximal compression level (MCL) in
grade I-III groups.
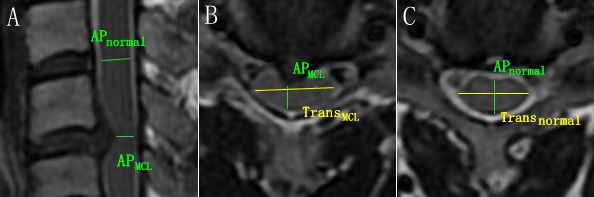
Figure 2. The
schematic diagram for diameter measurement. (A, B) APMCL =
anteroposterior diameter of the spinal cord at MCL, and TransMCL=
transverse diameter of the spin cord at MCL. (A, C) APnormal =
anteroposterior diameter of normal level spin cord nearest the MCL. Transnormal
= transverse diameter of normal level spin cord nearest the MCL.
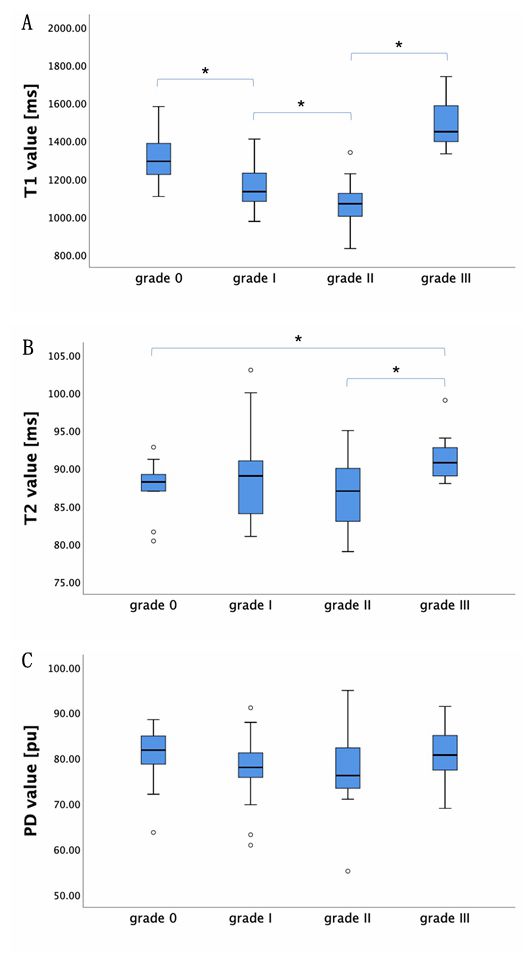
The T1, T2, and PD values (mean ± standard deviation) of grade 0-III
groups. (A) T1MCL value showed a decreasing trend with severity of
grades (from grade 0 to grade II), while it increased dramatically at grade
III. (B) T2MCL value showed no significant difference among grade
groups (from grade 0 to grade II), while it increased dramatically at grade III
compared to grade II. (C) PDMCL value showed no statistically
difference among all grade groups. * statistically significant at a threshold
of p < 0.05.
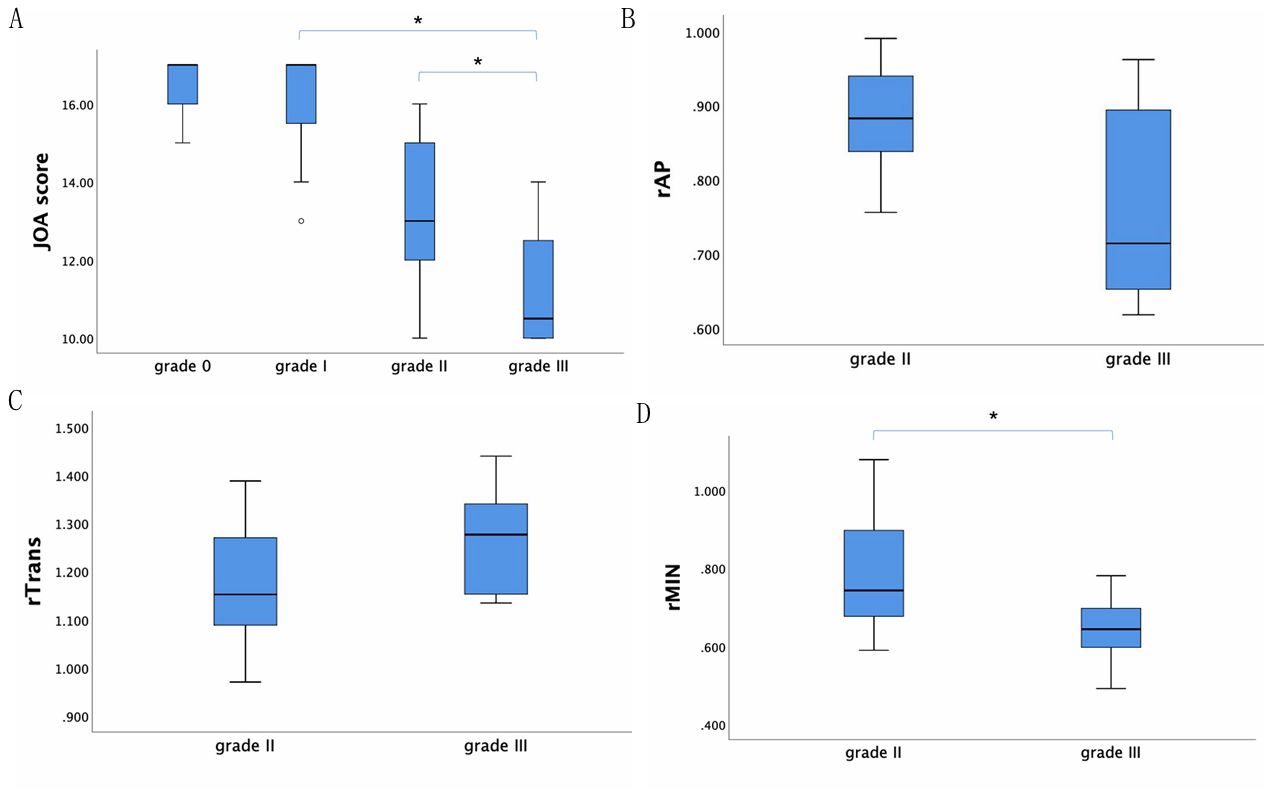
The JOA score showed a decreasing trend with severity of grades (from
grade I to grade III) (A). For the CSM patients in grade II and grade III, rAP
and rTrans of the spinal cord at MCL showed no significant difference between
two groups (B, C), while rMIN of grade III was significantly lower than that of
grade II (D). * statistically significant at a threshold of p < 0.05.
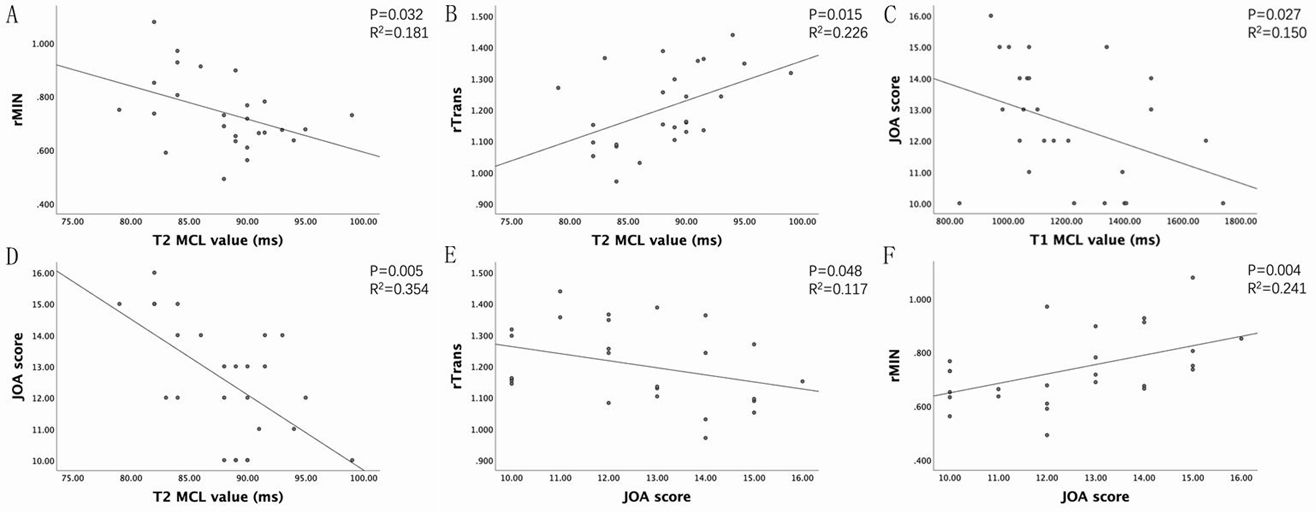
Association between clinical score, MAGIC quantitative values (T1, T2), and
diameter values of the spinal cord at MCL in grade II and grade III groups. T2MCL
value was negatively correlated with rMIN (A), whereas positively correlated
with rTrans (B). T1MCL and T2MCL value all negatively
correlated with JOA scores (C, D). Conversely, JOA score negatively correlated
with rTrans, whereas positively correlated with rMIN (E, F).
DOI: https://doi.org/10.58530/2023/1550