1548
Anisotropic and Isotropic Kurtosis Estimation of Spinal Cord Microstructure in Multiple Sclerosis and Neuromyelitis Optica Spectrum Disorder
Masaaki Hori1,2, Akifumi Hagiwara2, Kazumasa Yokoyama3, Issei Fukunaga4, Katsuhiro Sano2, Koji Kamagata2, Katsutoshi Murata5, Shohei Fujita2,6, Christina Andica7, Akihiko Wada2, Kouhei Kamiya1,2, Julien Cohen-Adad8, and Shigeki Aoki2,7
1Toho University Omori Medical Center, Tokyo, Japan, 2Radiology, Faculty of Medicine, Juntendo University, Tokyo, Japan, 3Neurology, Faculty of Medicine, Juntendo University, Tokyo, Japan, 4Radiological Technology, Faculty of Health Science, Juntendo University, Tokyo, Japan, 5Siemens Japan K.K., Tokyo, Japan, 6Radiology, The University of Tokyo, Tokyo, Japan, 7Faculty of Health Data Science, Juntendo University, Chiba, Japan, 8NeuroPoly Lab, Polytechnique Montreal, Montreal, QC, Canada
1Toho University Omori Medical Center, Tokyo, Japan, 2Radiology, Faculty of Medicine, Juntendo University, Tokyo, Japan, 3Neurology, Faculty of Medicine, Juntendo University, Tokyo, Japan, 4Radiological Technology, Faculty of Health Science, Juntendo University, Tokyo, Japan, 5Siemens Japan K.K., Tokyo, Japan, 6Radiology, The University of Tokyo, Tokyo, Japan, 7Faculty of Health Data Science, Juntendo University, Chiba, Japan, 8NeuroPoly Lab, Polytechnique Montreal, Montreal, QC, Canada
Synopsis
Keywords: Spinal Cord, Spinal Cord
We investigated the microstructural changes in the spinal cords of patients with multiple sclerosis (MS) and neuromyelitis optica spectrum disorder (NMOSD) using anisotropic kurtosis and isotropic kurtosis (Kiso) derived from 2-shell single diffusion encoding (SDE) MRI data with spherical mean techniques (SMT) and mean signal diffusion kurtosis imaging. There was a significant difference in Kiso between MS and NMOSD at the level of C4 (P=0.032, Mann-Whitney U test with Bonferroni correction). Therefore, Kiso derived from 2-shell SDE data might potentially be useful for evaluating the spinal cord microstructure in MS and NMOSD patients.Introduction:
Multiple sclerosis (MS) and Neuromyelitis Optica Spectrum Disorder (NMOSD) are the immune system diseases, involving nervus system and the method for evaluating so-called normal-appearing nervous tissue remains to be established for both diseases. In recent years, advanced diffusion MRI (dMRI) techniques have made it possible to assess cell morphology and size heterogeneity within voxels1, 2, termed anisotropic kurtosis (Kaniso) and isotropic kurtosis (Kiso), which is expected to have clinical applications. However, these techniques are not widespread in common clinical MRI systems. The key metrics to generate Kaniso and Kiso maps are fractional anisotropy (FA), mean diffusivity (MD), microscopic fractional anisotropy (μFA), total mean kurtosis (MKt) derived from 2-shell double diffusion encoding (DDE) technique or q-space trajectory data3. There are also other methods to evaluate μFA from dMRI data acquired with conventional single diffusion encoding (SDE), using both modeling and a set of constraints4. Moreover, MKt values are usually similar to mean diffusional kurtosis values, calculated from conventional 2-shell SDE data. The purpose of this preliminary study is to investigate Kaniso and Kiso using conventional 2-shell SDE using SMT technique and mean signal diffusion kurtosis imaging to distinguish microstructural changes in the spinal cord of patients with MS and NMOSD in vivo.Methods:
We prospectively enrolled 8 MS patients (age 51±11 years, 5 females; 7 RRMS, 1 SPMS, median EDSS score 1.25, disease duration range 9-30y) and 6 NMOSD patients (age 62±16 years, all females). After T2-, T1- and T2*-weighted imaging, 2-shell SDE imaging data using regional excitation technique (ZoomIt) were acquired with a Siemens Prisma 3T scanner with a body coil excitation and 64-ch head/neck coil for reception. Imaging parameters for 2-shell SDE dMRI were as follows: repetition time (TR)/echo time: 2200/76 (ms/ms); section thickness: 5 mm; 50 slices; in-plane pixel size: 0.9x0.9 mm; SMS factor: 2; imaging time: approximately 12 min; 2 b values (1000 and 2000 s/mm2) with two b=0 images and diffusion encoding in 30 direction for every b value. All diffusion MRI data were transferred to an offline workstation, denoised data5 and μFA maps, using spherical mean technique6 , the mean signal kurtosis (MSK) and the mean signal diffusion (MSD) maps derived from 2-shell SDE data7 and fractional anisotropy (FA) maps from conventional diffusion tensor model were obtained. These maps were processed using in-house programs developed in Matlab (R2019a, Math Works, Inc, Natick, MA) to derive parametric maps of Kaniso and Kiso.Kaniso = 12μFA2/(15-10μFA2)
OP2 = (3FA2-2FA2μFA2)/3μFA2- 2FA2μFA2
MK = Kiso + (1-OP2) Kaniso
(Where OP is the orientational order parameter.)
After that, semi-automated analysis was performed using the Spinal Cord Toolbox8 for cord and lesion segmentation9, motion correction, normal-appearing white matter (NAWM) maps generation, registration to white matter atlas, and extraction of metrics (Figure 1). Quantitative metrics in the NAWM at C2, C3, C4 and C5 were compared between MS and NMOSD. Statistical evaluations were performed by using Microsoft Excel 2019 and SPSS (SPSS Inc. version 27). P value less than 0.05 was considered statistically significant.
Results:
All metrics values of NAWM of spinal cords at each spinal level in patients with MS and NMOSD are summarized in Figure 2. There were significant differences in Kiso between MS and NMO at the level of C4 (P=0.032, Mann-Whitney U test with Bonferroni correction).Discussion:
Our results showed that there was a significantly higher Kiso value at C4 level spinal cord in patients with MS, compared with NMOSD. The results indicate that size heterogeneity at the cellular level is higher in spinal NAWM in MS than in NMOSD patients. Therefore, Kiso derived from 2-dhell SDE data might potentially be useful for evaluating the spinal cord in MS and NMOSD patients. Further studies with more patients and the investigation of imaging, pathological, and clinical correlation are needed to establish the usefulness of Kaniso and Kiso in the evaluation of the spinal cords in patients with MS and NMOSD.Acknowledgements
This work was supported by JSPS KAKENHI Grant Number 19K08161, the Canada Research Chair in Quantitative Magnetic Resonance Imaging [950-230815], the Canadian Institute of Health Research [CIHR FDN-143263], the Canada Foundation for Innovation [32454, 34824], the Fonds de Recherche du Québec - Santé [28826], the Fonds de Recherche du Québec - Nature et Technologies [2015-PR-182754], the Natural Sciences and Engineering Research Council of Canada [435897-2013], the Canada First Research Excellence Fund (IVADO and TransMedTech) and the Quebec BioImaging Network [5886].References
- Szczepankiewicz F, et al. The link between diffusion MRI and tumor heterogeneity:Mapping cell eccentricity and density by diffusional variance decomposition (DIVIDE). Neuroimage. 2016 Nov 15;142:522-532.
- Nilsson M, et al. Tensor-valued diffusion MRI in under 3 minutes: an initial survey of microscopic anisotropy and tissue heterogeneity in intracranial tumors. Magn Reson Med. 2020 Feb;83(2):608-620.
- Westin, C. F., et al. Q-space trajectory imaging for multidimensional diffusion MRI of the human brain. 2016 Neuroimage135, 345–362.
- Henriques RN, Jespersen SN, Shemesh N. Microscopic anisotropy misestimation in spherical-mean single diffusion encoding MRI. Magn Reson Med. 2019 ;81(5):3245-3261.
- https://dipy.org/documentation/1.4.1./examples_built/denoise_patch2self/#example-denoise-patch2self
- Kaden E, et al. Multi-compartment microscopic diffusion imaging. NeuroImage 2016 139: 346-359.
- https://dipy.org/documentation/1.5.0/examples_built/reconst_msdki/#example-reconst-msdki
- De Leener B,et al. SCT: Spinal Cord Toolbox, an open-source software for processing spinal cord MRI data. Neuroimage. 2017 Jan 15;145(Pt A):24-43.
- Gros C, et al. Automatic segmentation of the spinal cord and intramedullary multiple sclerosis lesions with convolutional neural networks. Neuroimage. 2019;184:901-915.
Figures
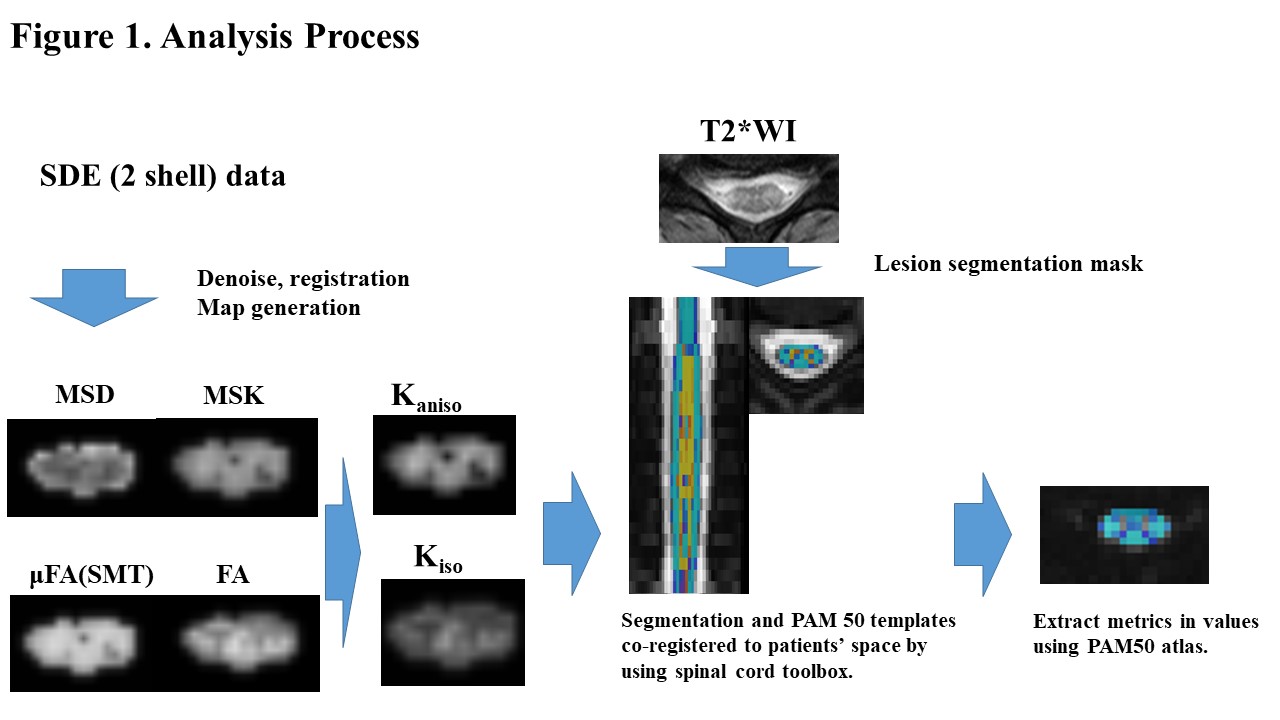
Figure 1. Representative
metric maps of a case with a multiple sclerosis patient and analysis process.
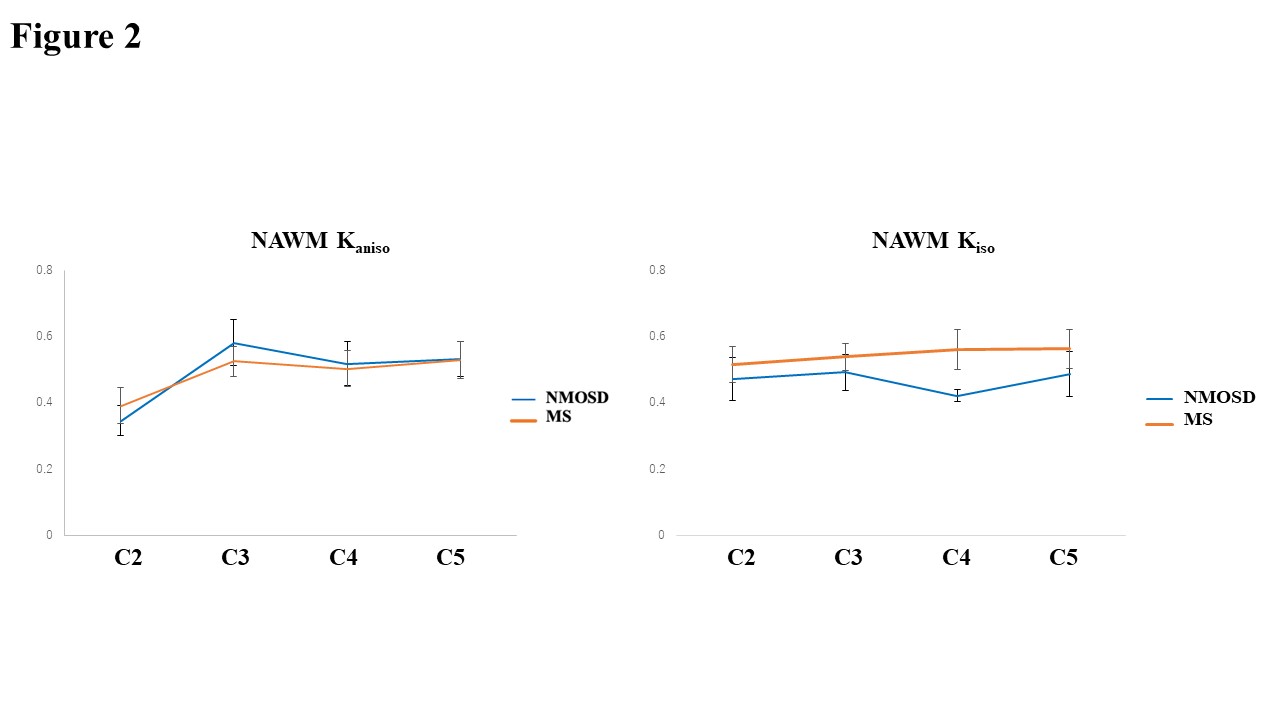
Figure
2. The results of all metrics of white matter of spinal cords at each spinal
level in patients with MS and NMOSD.
DOI: https://doi.org/10.58530/2023/1548