1547
Contribution of diffusion MRI to neuropathic pain in the SNL rat model: correlation between gliosis and diffusion parameters
Sang-Jin Im1, Seokha Jin1, and HyungJoon Cho1
1Department of Biomedical Engineering, Ulsan National Institute of Science and Technology (UNIST), Ulsan, Korea, Republic of
1Department of Biomedical Engineering, Ulsan National Institute of Science and Technology (UNIST), Ulsan, Korea, Republic of
Synopsis
Keywords: Spinal Cord, Diffusion Tensor Imaging
In this study, magnetic resonance imaging is used for anatomical and pathological studies of the spinal cord, investigating the mechanisms of neuralgia through diffusion magnetic resonance imaging techniques. However, analysis of ganglion changes in the spinal cord in multi-shell diffuse-weighted MRI signals remains challenging due to the ambiguous relationship between sympathetic and MRI signals. To study these relationships, we construct a neuropathic pain model using rats by performing in ex-vivo MRI experiments and neuropathic cell staining to provide insight into the treatment of neuropathic pain.Introduction
Current existing treatments for neuropathic pain have shown limited effectiveness and relatively frequent side effects1. Gliosis, which occurs in response to neuronal damage, is associated with chronic pain, making it vital to understand the mechanisms between gliosis and neuropathic pain for providing predictable and effective therapies. In this study, magnetic resonance imaging (MRI) with high spatial resolution and contrast was used to accurately identify and depict the spinal cord, a region ligated in spinal nerve ligation (SNL) rat models to simulate peripheral nerve injury2. In addition, tractographic analysis was performed using diffusion tensor images (DTI) to visualize neuronal pathways of spinal white matter3. Such analyses allow tracking of specific neural pathways, such as the corticospinal canal (CST), along the direction of the nerve fibers4. However, there are challenges in analyzing multi-shell diffusion-weighted MRI signals for glial changes in the spinal cord due to the ambiguous relationship between gliosis and MRI signals. In this study, we construct a neuropathic pain model (SNL) for ex-vivo MRI experiments and glial cell staining to investigate the mechanism between gliosis and neuropathic pain. The results of this study can provide an understanding of the mechanisms between neuropathic pain and gliosis, as well as insights to developing treatments for neuropathic pain.Material and Method
8 normal rats (SD Rat, Female, 7 weeks) were used in this study to produce the neuropathic pain model (SNL), which involved tightly ligating the right side of the L5 segmental spinal nerve5. Each model was observed 7 days, 10 days and 15 days after surgery.Image data acquisition was performed on a CT scanner (Bruker, Germany) and 7T MRI scanner (Bruker, Germany). The pulse sequence used for this acquisition was a 2D EPI-diffusion tensor, with the following parameters: SE sequence with a TR=3000ms, TE=23ms, FA=90°, Segments=6, BW=341kHz, b-value= 1000s/mm², 2000s/mm², 3000s/mm², 4000s/mm², 6000s/mm², Duration(δ)=4.5ms, Separation(Δ)=11ms, diffusion direction=60, FOV=5.5×5.5mm², ST=0.5 mm, Matrix=78×78, Slice=18, Resolution=70x70µm², 10 averages and resulting in a total acquisition time of 15h 30m. The acquired data was converted to NIFTI format through ANTx26-8 and its B0 image was used for segmentation. The spinal cord was segmented manually using 3Dslicer on B0 images to create a spinal cord mask. The acquired mask was registered to DTI data using FSL, and FA and MD were acquired through DTIFIT9. DTI data was used for deterministic tractographic analysis in DSIstudio, and Matlab was used for NODDI analysis10.
Result
All rats used in the study underwent SNL surgery, as well as an up-down Von Frey test before and after surgery. As seen in Figure 1, all SNL models after surgery had lower withdrawal thresholds than before surgery. Figure 2 shows the results of segmentation and registration of the vertebrae from the CT image data and the B0 image data for accurately distinguishing the vertebral number and the position of the spinal cord within the vertebra. The location and shape of the surgical site on the spine can be identified by rendering the segmentation and registration results in 3D. Figure 3 shows the results of analysis of DTI and NODDI parameter maps. While both sides showed lower FA and ODI values over time, the right axial section (where the spinal nerve was ligated) greater loss in FA and ODI values than the left area. These changes were consistently observed from 7 to 15 days. The tractography analysis results in Figure 4 show lower connectivity in the right axial section than the left in each group. In addition, it can be seen that activated microglia and astrocytes show increase in the ipsilateral region as ODI decreases such as in Figure 5.Discussion and Conclusion
The spinal cord is often the subject of imaging studies because of its clinical significance in motor and sensory function11. In our study, the SNL rat model was used to scan and observe changes in the ligation surgical sites at L5 to L6. The surgical area where the spinal cord was ligated showed decreases in DTI and NODDI parameters progressively after surgery, and in a more severe degree at the ligation site (right axial region). Analysis of DTI parameters showed that the right side had lower FA values than the left side and the right side had lower connectivity than the left side in all SNL rat model groups. In addition, NODDI analysis showed decrease in ODI, which correlates with activated microglia and astrocytes, occurred more severely at the surgical region. These results are similar to previous studies that showed lower DTI and NODDI parameters near regions of peripheral nerve injury12-14. In this study, we showed changes in tractography and ODI values on sites of spinal nerve ligation through DTI and NODDI analysis, which have strongly correlated with gliosis.. We show evidence that tractography and ODI can be considered as biomarkers for spinal cord gliosis, which can be important for diagnosing neuropathic pain at the spinal region.Acknowledgements
This work was supported by the National Research Foundation of Korea (NRF) grant funded by Ministry of Science and ICT (MSIT) (Grant No. NRF-2022R1C1C2003805), and the 2021 Joint Research Project of the Institutes of Science and Technology.References
1. Wallace, JM, et al. Update on pharmacotherapy guidelines for treatment of neuropathic pain. Current Pain and Headache Reports, 2007;11(3): 208-214.2. Badhwar A, Lerch JP, Hamel E, et al. Impaired structural correlates of memory in Alzheimer's disease mice. Neuroimage, 2013;3:290–300.
3. Xue K, Luo C, Zhang D, et al. Diffusion tensor tractography reveals disrupted structural connectivity in childhood absence epilepsy. Epilepsy research, 2014;108(1):125-138.
4. Figini M, Scotti A, Marcuzzo S, et al. Comparison of diffusion MRI acquisition protocols for the in vivo characterization of the mouse spinal cord: variability analysis and application to an amyotrophic lateral sclerosis model. PloS one, 2016;11(8):e0161646.
5. Chung JM, Kim HK, Chung K, et al. Segmental spinal nerve ligation model of neuropathic pain. In Pain Research, Humana Press, 2004:35-45.
6. Koch S, Mueller S, Foddis M, et al. Atlas registration for edema-corrected MRI lesion volume in mouse stroke models. Journal of Cerebral Blood Flow & Metabolism. 2019;39(2):313-323.
7. Huebner NS, Mechling AE, Lee HL, et al. The connectomics of brain demyelination: functional and structural patterns in the cuprizone mouse model. Neuroimage. 2017;146:1-18.
8. Lein ES, Hawrylycz MJ, Ao N, et al. Genome-wide atlas of gene expression in the adult mouse brain. Nature. 2007; 445(7124):168.
9. Sotiropoulos SN, Hernandez-Fernandez M, Vu AT, et al. Fusion in diffusion MRI for improved fibre orientation estimation: An application to the 3T and 7T data of the Human Connectome Project. Neuroimage, 2016; 134:396-409.
10. Yeh FC, Verstynen TD, Wang Y, et al. Deterministic diffusion fiber tracking improved by quantitative anisotropy. PLoS One, 2013;8(11):e80713.
11. Calabrese E, Adil SM, Cofer G, et al. Postmortem diffusion MRI of the entire human spinal cord at microscopic resolution. NeuroImage: Clinical, 2018;18:963-971.
12. Leong ML, Gu M, Speltz-Paiz R, et al. Neuronal loss in the rostral ventromedial medulla in a rat model of neuropathic pain. Journal of Neuroscience, 2011;31(47):17028-17039.
13. Heijmans L, Mons MR, Joosten EA, et al. A systematic review on descending serotonergic projections and modulation of spinal nociception in chronic neuropathic pain and after spinal cord stimulation. Molecular pain, 2021;17:17448069211043965.
14. Temmermand R, Barrett JE, Fontana AC, et al. Glutamatergic Systems in Neuropathic Pain and Emerging Non-opioid Therapies. Pharmacological Research, 2022;106492.
Figures
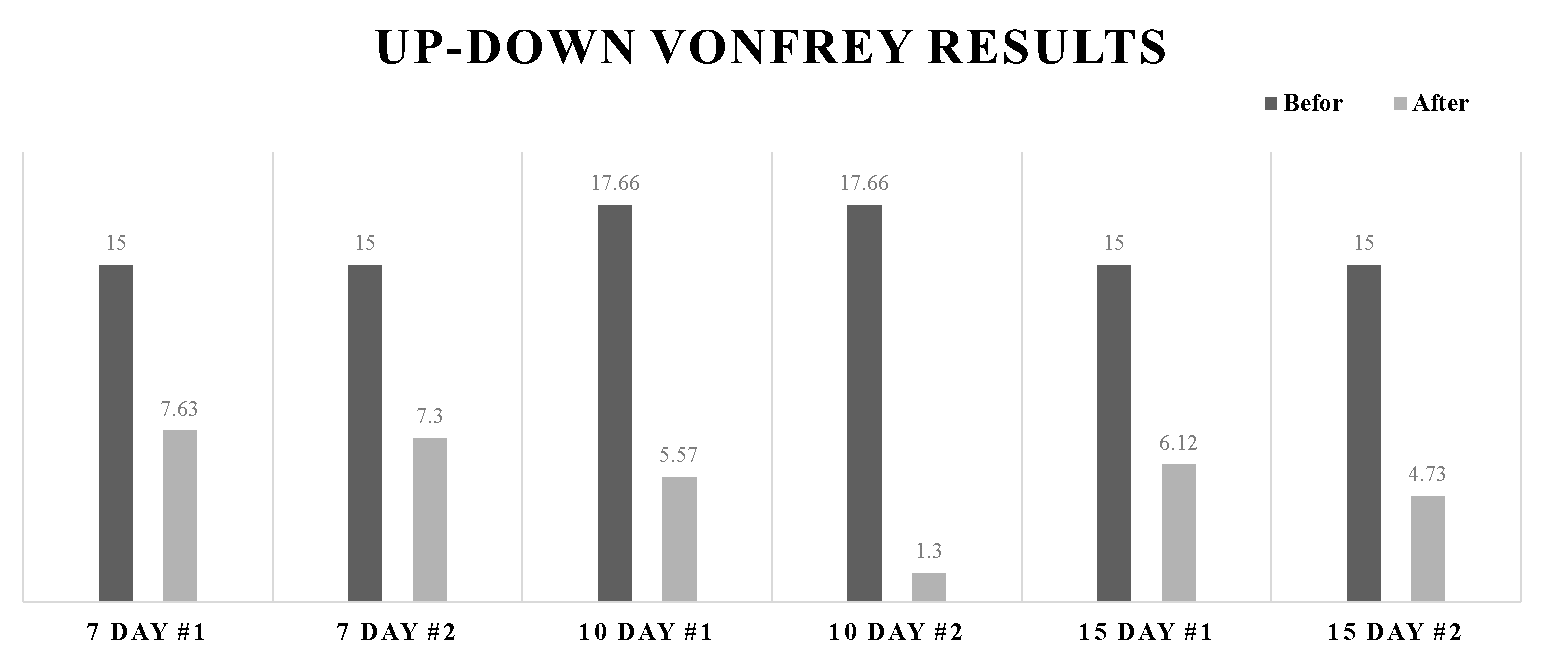
Figure 1. The result of Von Frey behavior test. The graph shows the threshold value of response before and after surgery in all rats.
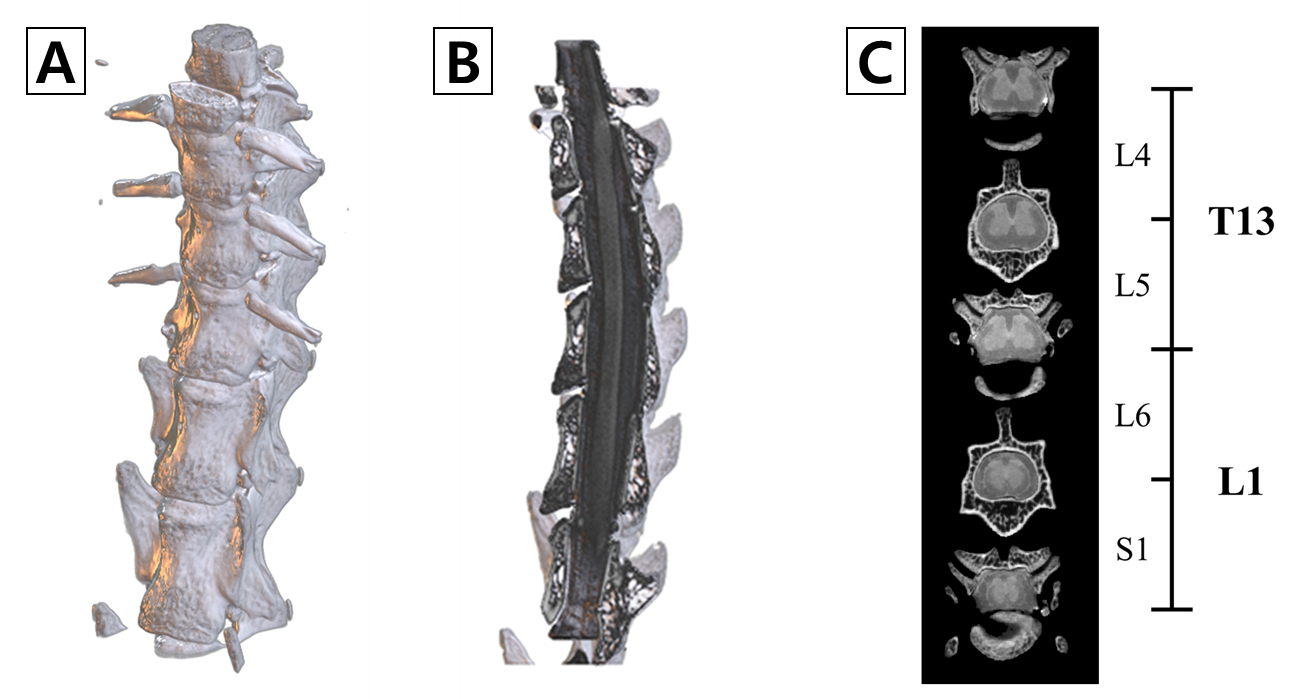
Figure 2. 3D rendering of segmentation results. vertebrae rendering (A), Vertebrae and spinal cord is shown from the sagittal (B), Axial section of the vertebral bone to be surgery (C). The structure of the vertebral bones was obtained by CT and was used to aid in localization.
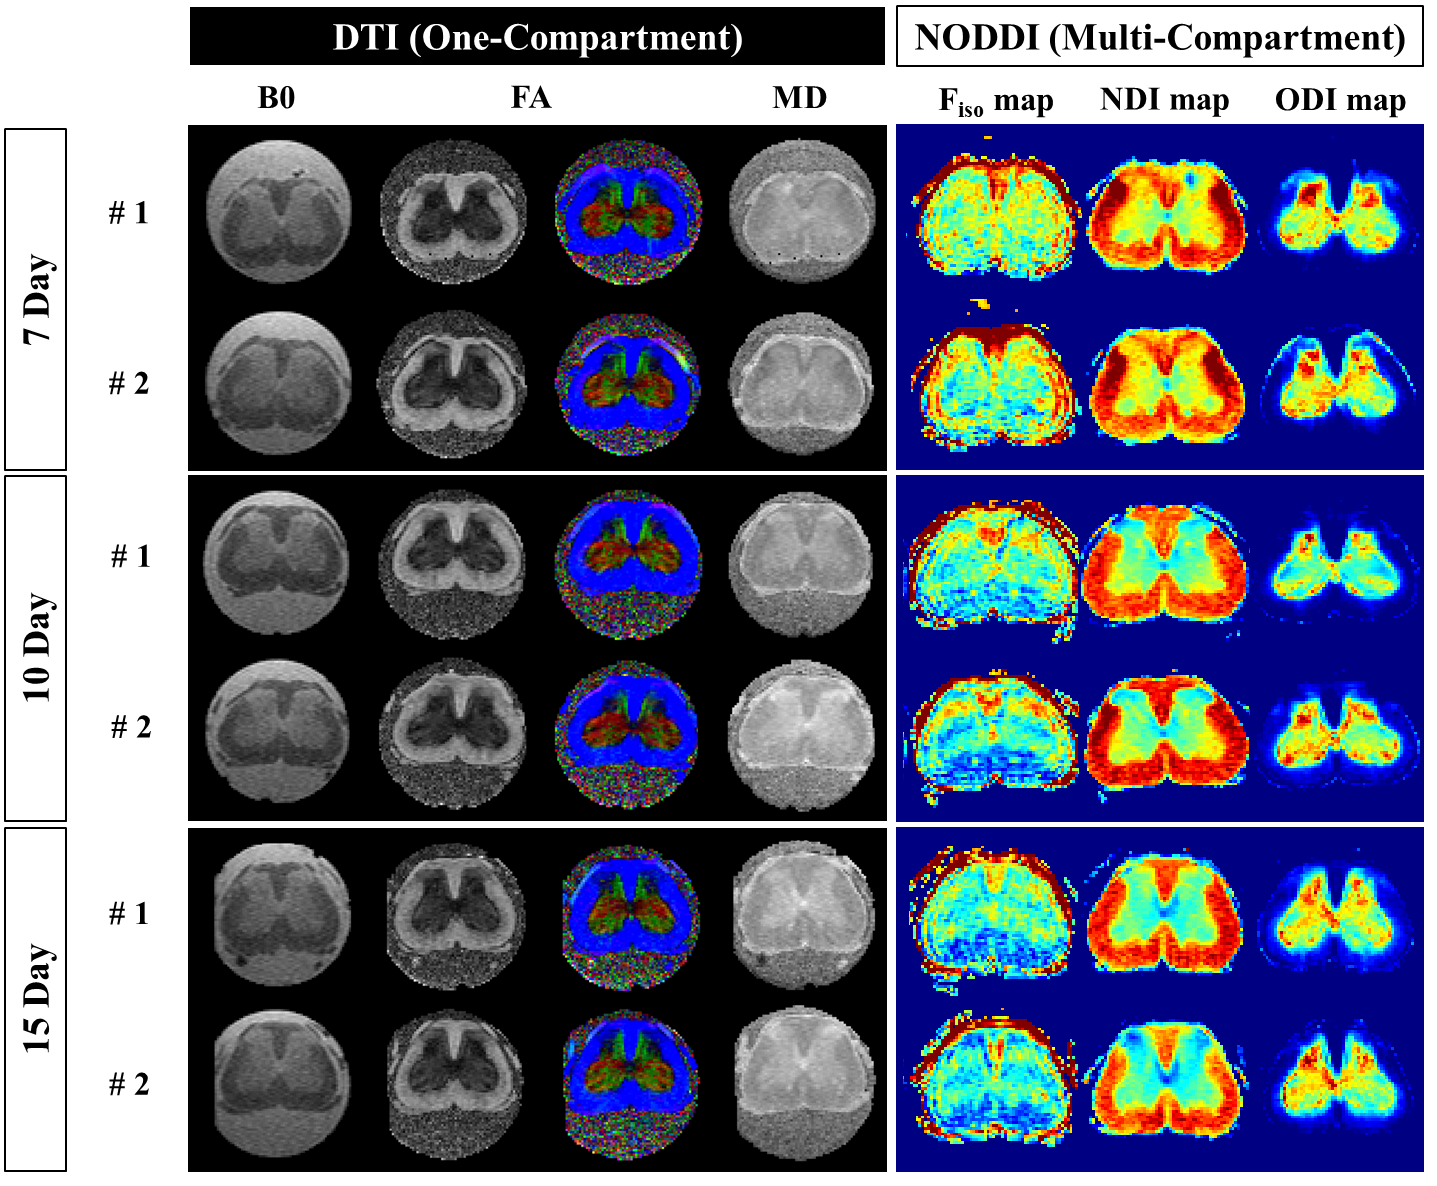
Figure 3. Visualization of the SNL rat model from 7 to 15 days. Representative diffusion MRI parameter maps (1st~3rd column), and NODDI maps (4th~6th column).
Abbreviations: Diffusion tensor imaging, DTI; Neurite orientation dispersion and density index, NODDI; Mean diffusivity maps, MD; Fractional anisotropy maps, FA; Fraction of isotropic water Fiso; Neurite density index, NDI; Orientation dispersion index, ODI.
Abbreviations: Diffusion tensor imaging, DTI; Neurite orientation dispersion and density index, NODDI; Mean diffusivity maps, MD; Fractional anisotropy maps, FA; Fraction of isotropic water Fiso; Neurite density index, NDI; Orientation dispersion index, ODI.
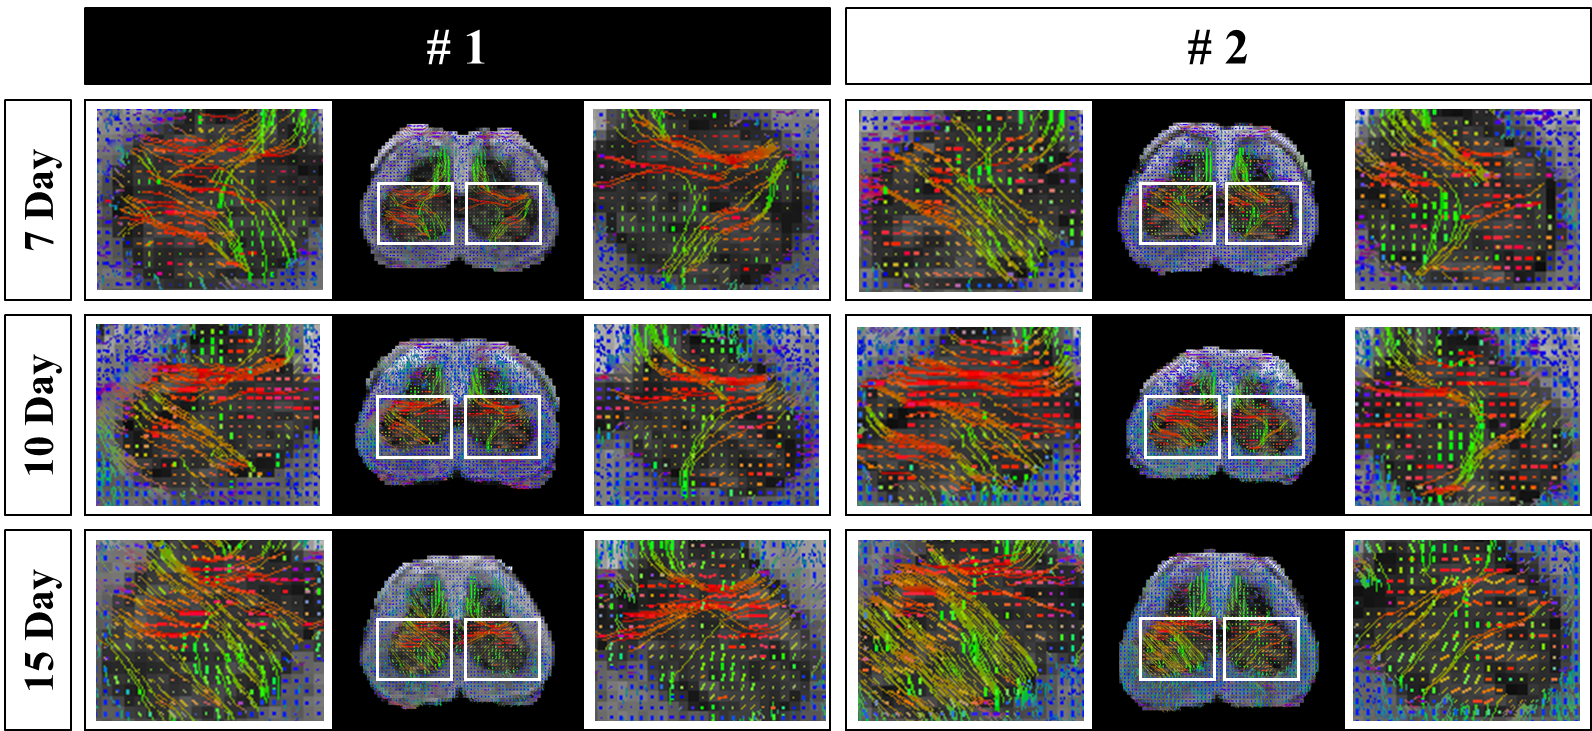
Figure 4. Results of spinal cord tractography in the SNL rat model between days 7 and 15. To confirm the changes in the left and right regions in the Spinal cord between the 4th and 6th vertebrae, the regions marked with white squares were enlarged and visualized on the left and right sides of each slice.
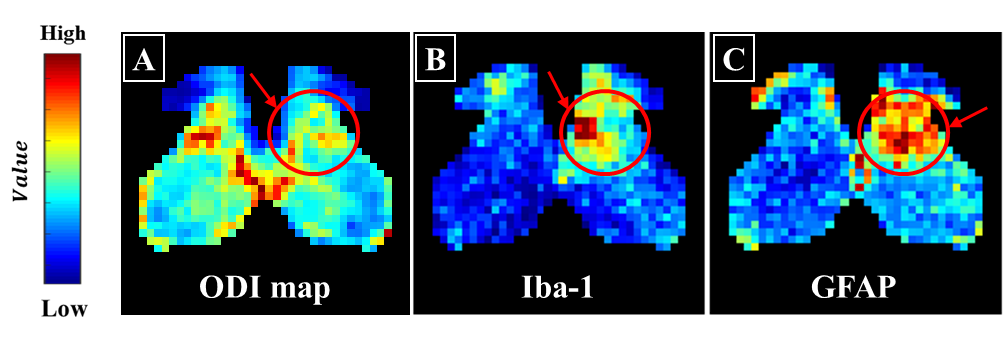
Figure 5. Comparison between DTI and glial cells. ODI map (A), Activation markers of astrocytes (GFAP, B) and microglia (Iba-1, C). Each value is represented by a colormap, with values closer to red representing higher values and closer to blue representing lower values.
DOI: https://doi.org/10.58530/2023/1547