1545
Study of mouse models of lesion by using a multi technique approach.1Institute of Nanotechnology Lecce Unit & Rome Unit, CNR, LECCE, Italy, 2Laboratory of Neurophysics and Neuroimaging (NaN), IRCCS Santa Lucia Foundation, Rome, Italy, 3URPhyM – NARILIS, Université de Namur, Namur, Belgium, 4Institute of NeuroScience (IoNS), NEUR division, Université catholique de Louvain (UCLouvain), Brussels, Belgium, 5Department of Neurosurgery, Université catholique de Louvain (UCLouvain), CHU UCL Namur, Yvoir, Belgium, 6Department of Pharmacy and Biotechnology, University of Bologna, Bologna, Italy, 7Museo Storico della Fisica e Centro Studi e Ricerche Enrico Fermi, Rome, Italy, 8Institute of Nanotechnology, CNR, ROME, Italy
Synopsis
Keywords: Spinal Cord, Data Processing, SPINAL CORD INJURY
Innovative biomarkers as well as new modalities to integrate structural information at higher level should be tuned up in order to understand the mechanisms underlying the pathology evolution. Here, we show some results obtained by integrating morphological information from X-ray phase contrast microtomography with histology combined with immunohistochemistry. Thanks to this approach, we demonstrated the possibility to use the cell number variation as a biomarker for pathological conditions.INTRODUCTION
Several pathologies like neurodegenerative diseases as well as Traumatic brain or Spinal cord injury (SCI) are medically complex and life-disrupting condition. As a consequence, there is a certain interest from scientific community to understand the mechanisms underlying the pathology progression and consequently to tune up innovative biomarkers as well as new modalities in order to integrate information coming from different techniques. We propose a multimodal approach based on combining histology and immunohistochemistry with high resolution X -ray phase contrast microtomography (SXPCT) on ex-vivo mouse unilateral contused spinal cord (SCI). Specifically, the development of a co-registration algorithm allowed us to make the extracted morphological information complete and reliable. SXPCT is a non-destructive 3D imaging technique, able to visualize low-absorbing tissue samples such as biological tissue1. To date, the mechanisms underlying SCI progression are still unknown, but it is admitted that the extent of the primary injury predicts the neurological outcomes following SCI in murine models2 of unilateral contusion3,4. As a consequence, the number of spared neurons can be considered as a key prognostic factor. In the present work, we characterized the changes of spinal cell distribution in a mouse model of cervical SCI with the aim to introduce it as an effective biomarker for the lesion description.METHOD
Fifteen C57BL/6J mice (male, age 2–3 months), were considered in the study. Mice are divided in 3 groups: (1) uninjured, (2) C4-injured followed by euthanasia 30 min post-SCI, and (3) C4-injured followed by euthanasia 7 days post-SCI. Each group includes five animals: All the experimental procedures were conducted in compliance with the European Communities Council Directives for Animal Experiment (2010/63/EU, 86/609/EEC, and 87—848/EEC) and were approved by the Animal Ethics Committee (ethics project UN 17-284) of University of Namur. We performed an automated 3D procedure for motoneuron (MN) counting on uninjured and injured (30 min and 7 days) spinal cords, by using a routine working on Fiji (3D Object counter). We also evaluated phrenic motor neuron loss, after co-registrating SXPCT images and serial matched-levels of histology sections in which phrenic MNs were retrogradely fluoro-labeled. The co-registration was performed using the toolkit FLIRT of the FSL software (FMRIB Software Library v6.0) by means of a 2D linear transformation with 6 degrees of freedom (1 rotation, 2 translations, 2 scale and skew, i.e., oblique deformation).RESULTS
We developed a pipeline for MN counting (Fig 1). Specifically, the counting was performed on binnarized tomography slices. The discrimination of MNs from non-MNs populations was done by considering only cells with 20–35 µm diameter to be included in the counting. Specifically, the counting was performed by choosing a volume size corresponding to the real volume of the neurons, as estimated by profiling the size distribution of the most common spinal cells in histology. MN quantification was then performed, within two ROIs (contralaterally, ipsilaterally to the lesion, of 350 µm thick stacks) taken at the epicenter, 0.5 and 1.0 mm from the lesion epicenter. Quantification of MNs was performed on the segmented volume of the spinal cord axial section at 0.5 and 1.0 mm rostral to the epicenter compared with the sham-operated controls. We observed a loss of MNs ipsilaterally to the lesion as early as 30 min post-SCI at the epicenter while, no changes in cell density were detected at 1.0 mm rostral to the epicenter compared with sham operated control at both 30 min and 7 days post-SCI (Fig. 2 B). We also found that only 2% of phrenic MNs at spinal level C4 survived in the ispilateral side of 7 days post-SCI contused spinal cord while no significant decrease was observed contralaterally with respect to the lesion (Fig 1 B).DISCUSSION
Ipsilateral MNs were lost at epicenter, according to the decrease of neuroplasmic contrast during the 30 min post-SCI. This neuronal loss has the same magnitude at 7 days post-SCI. In addition, between 7 days post-SCI and 30 min post-SCI no drop was shown in MN number within a given volume 0.5 mm away from the epicenter, suggesting no overt extension of primary lesion during the subacute phaseCONCLUSION
In conclusion, we demonstrated the important contribution of a multimodal approach for the study of murine models of human pathologies and the relevance of SXPCT image analysis in filling gaps in the current knowledge of nervous cell distribution in the healthy and diseased spinal cord.Acknowledgements
The Italian Ministry of Health Young Researcher Grant 2013 (GR-2013-02358177) is acknowledged for financial support. Part of the research reported in this article was also supported by the FISR Project ‘‘Tecnopolo di nanotecnologia e fotonica per la medicina di precisione’’ (funded by MIUR/CNR, CUP B83B17000010001) and the TECNOMED project (funded by Regione Puglia, CUP B84I18000540002).We also acknowledge the PNRR project funded by Ministry of Health.
References
1. Bravin A, Coan P, Suortti P. X-ray phase-contrast imaging: from pre-clinical applications towards clinics. Phys Medicine Biol 2013;58(1):R1–R35.
2. Nicaise C., Hala T. J. et al. Phrenic motor neuron degeneration compromises phrenic axonal circuitry and diaphragm activity in a unilateral cervical contusion model of spinal cord injury. Experimental Neurology, , 2012 , 235, 2.
3. Fehlings MG, Vaccaro A, Boakye M, et al. (eds). Essentials of Spinal Cord Injury: Basic Research to Clinical Practice. Thieme Medical Publishers; 2013.
4. Wilson JR, Hashimoto RE, Dettori JR, et al. Spinal cord injury and quality of life: a systematic review of outcome measures.
Figures
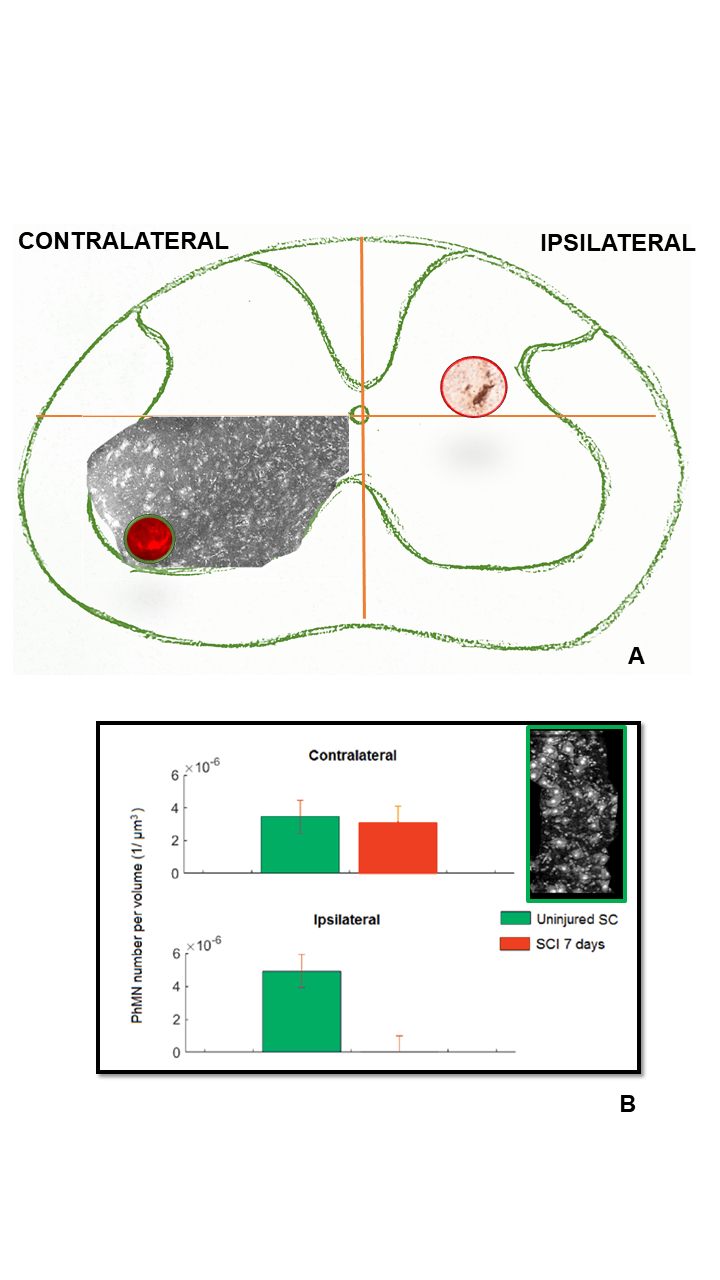
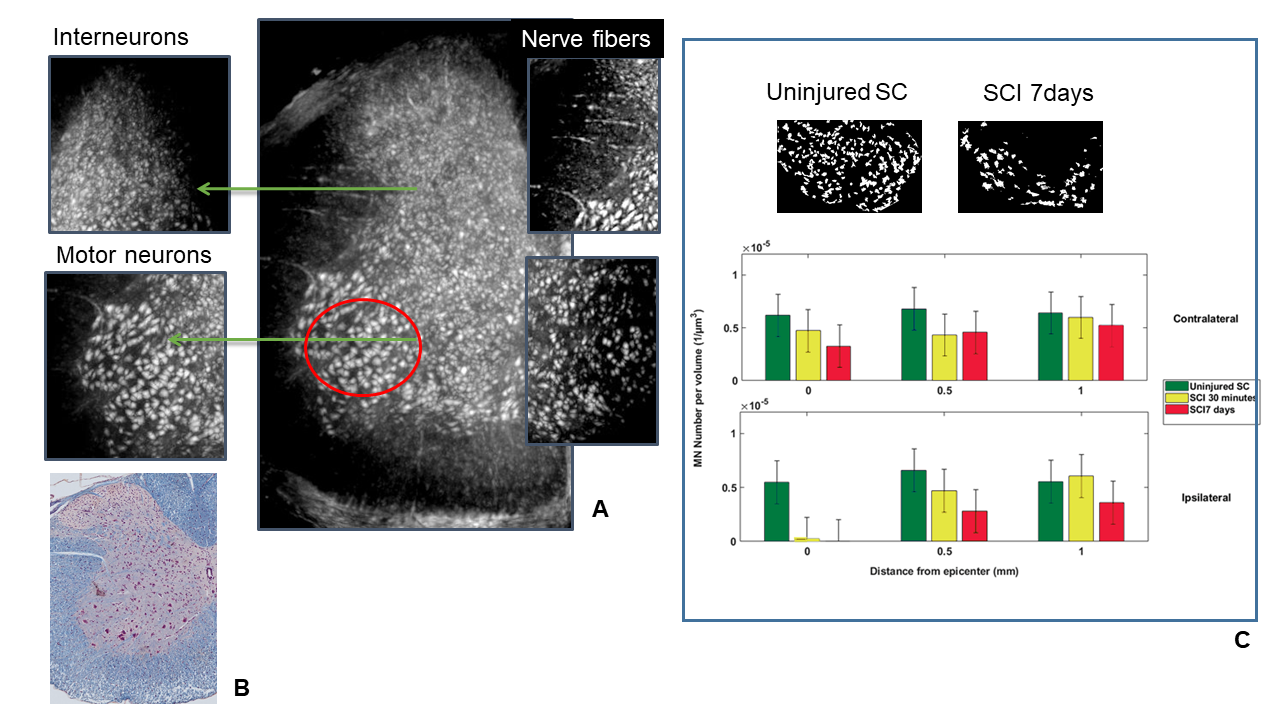
Fig. 2
In A Maxima intensity projection from 200 SXPCT slices of an healthy mouse spinal cord; in B Niessl histology allows to understand the perfect match with SXPCT images. In panel J the number of MNs quantified in a volume of about 880 · 620 · 350 µm3 at different distances along the spinal cord contralaterally and ipsilaterally with respect to the lesion. The final value (mean – SEM) was then obtained by averaging across five samples. The SEM takes into account the standard deviation computed across the samples and the maximum error resulting from different thresholding values.