1543
Remote neurodegeneration in a rat contusion spinal cord injury model: a combined MRI and histological study1Spinal Cord Injury Center, Balgrist University Hospital, University of Zurich, Zurich, Switzerland, 2Department of Biomedical Engineering, Marquette University and Medical College of Wisconsin, Milwaukee, WI, United States, 3Institute for Biomedical Engineering, University of Zurich and ETH Zurich, Zurich, Switzerland, 4Department of Neurosurgery, Medical College of Wisconsin, Clement J Zablocki Veterans Affairs Medical Center, Milwaukee, WI, United States, 5Neuroscience Center Zurich, University of Zurich and ETH Zurich, Zurich, Switzerland, 6Department of Neurophysics, Max Planck Institute for Human Cognitive and Brain Sciences, Leipzig, Germany, 7Wellcome Trust Centre for Human Neuroimaging, UCL Queen Square Institute of Neurology, University College London, London, United Kingdom
Synopsis
Keywords: Neurodegeneration, Trauma
MRI has been widely used to investigate the structural damage after traumatic spinal cord injury (SCI). While most small animal studies have focused on the injury site, remote SCI-related damage along the neuraxis has received less attention. Here, we demonstrate that ex vivo diffusion MRI and cross-sectional area measurements are sensitive to remote neurodegeneration in a rat contusion SCI model, showing gray matter and dorsal column atrophy alongside decreased fractional anisotropy in the dorsal columns several spinal levels rostral to the injury epicenter. Imaging findings were consistent with SMI32 immunohistochemistry with axonal degeneration mostly concentrated in the dorsal column.Introduction
Traumatic spinal cord injury (SCI) leads to widespread axonal and myelin damage across the neuraxis via Wallerian1 and retrograde degeneration2. Over time, axonal and myelin breakdown and the clearance of cellular debris by phagocytosis result in atrophy of the nervous tissue3. While most studies in rat SCI models have focused on the injury epicenter and its vicinity4–7, distant neurodegenerative processes have received less attention, although they contribute to the patients’ impairment and outcome8–11. Here, we apply diffusion MRI and MRI-based cross-sectional area measurements, combined with histology, to investigate neurodegeneration at the cellular, micro-, and macrostructural level in a rat contusion SCI model.Methods
Ninety-eight Sprague–Dawley adult rats underwent a graded contusion spinal cord injury at T8 as previously described12. Rats were assessed for post-injury locomotor function according to the Basso, Beattie and Bresnahan (BBB) score13. Three cohorts of 24 animals each (6 sham and 6 for mild, moderate, and severe SCI each) were sacrificed at 2, 30, and 90 days post-injury (dpi), respectively, for histology. The fourth cohort of 26 animals (6 sham, 7 mild, 8 moderate, 5 severe SCI) was sacrificed at 90 dpi for ex vivo MRI. SMI32 and GFAP immunohistochemistry were performed in a slice from C5 to assess the dynamics of axonal degeneration and astroglia proliferation, respectively. The number of SMI32-stained axons and the mean GFAP coherency averaged within the white matter (WM) were quantified.Ex vivo MRI was performed after 90 dpi on a 9.4 T Bruker BioSpec 94/30 MR scanner. T1-weighted images were acquired using a 2D RARE sequence with 25 coronal slices of 0.8 mm thickness, field of view (FOV)=15.6x12 mm2, resolution=78x94 μm2, repetition times (TR)=450, 600, 800, 1500, 3000, and 5000 ms, echo time (TE)=7 ms, and acquisition time (TA)=24min. Diffusion-weighted images were acquired by employing Stejskal-Tanner diffusion gradients along 17-17 diffusion directions at b values of 800 and 1600 s/mm2 (plus 5 b0 images) in a 3D four-shot EPI sequence with a FOV=7.5x30x7.5 mm3, isotropic resolution=150 μm3, TR=750 ms, TE=20.25 ms, and TA=98min. Maps of diffusion tensor imaging (DTI) metrics such as fractional anisotropy (FA) were obtained using a weighted least squares algorithm implemented in DIPY14. Five regions of interest (ROI) were created on a rat spinal cord atlas15: dorsal, lateral, and ventral WM columns and dorsal and ventral gray matter (GM) horns. ROIs were transformed into the native space using the Spinal Cord Toolbox16 to compute cross-sectional areas and mean DTI metrics within each ROI and spinal level. Spinal levels were averaged across the upper cervical (C3-C5), lower cervical (C6-C8), upper thoracic (T1-T3), and mid-thoracic (T4-T6) segments.
MRI readouts were analyzed using linear mixed effect models with group (sham, SCI), segment, and their interaction as fixed effects. Post-hoc pair-wise differences were corrected for multiple comparisons using Tukey’s method (p<0.05). Relationships between locomotor outcomes and MRI readouts were assessed using Pearson’s correlation coefficient. Histological measures were compared among time points and injury severities using a two-way ANOVA.
Results
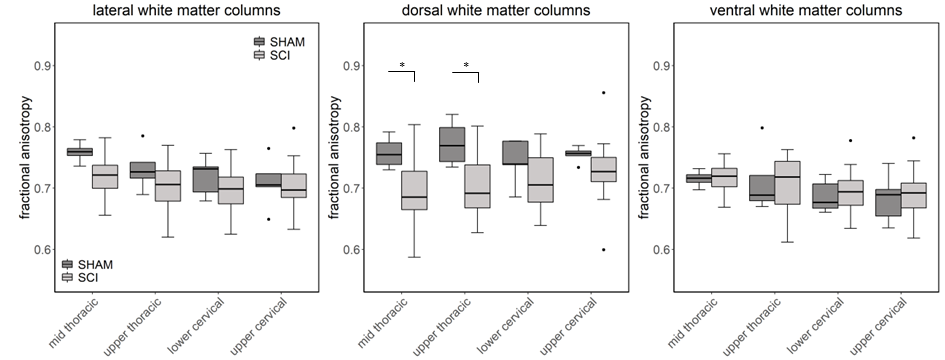
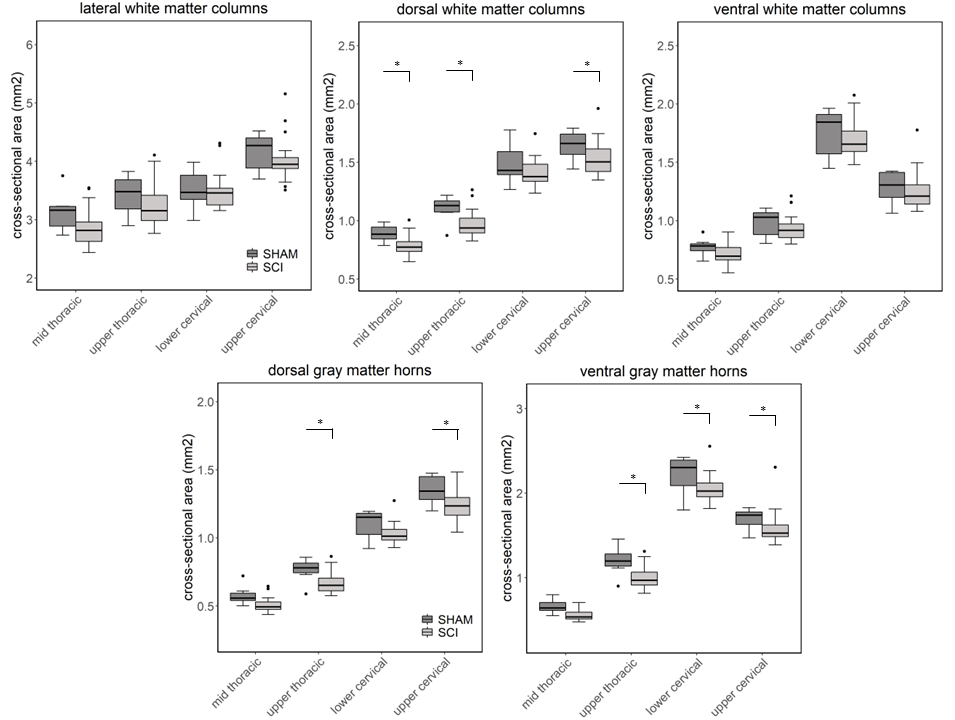
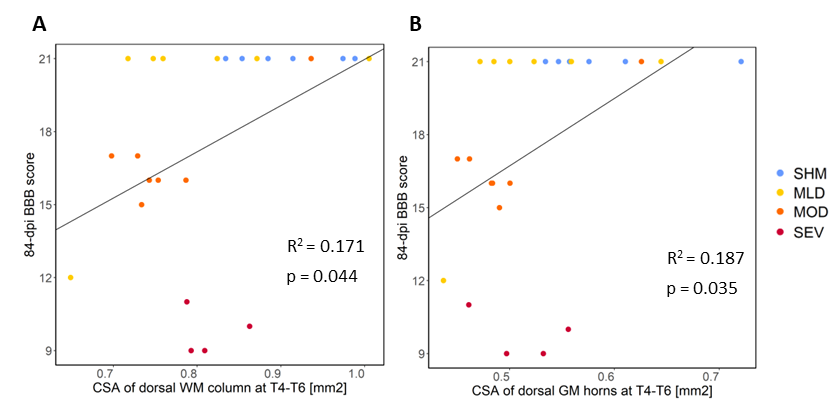
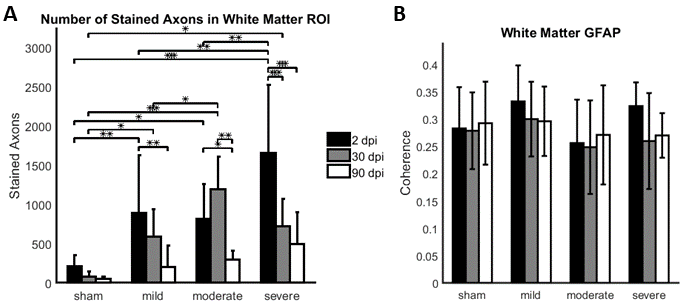
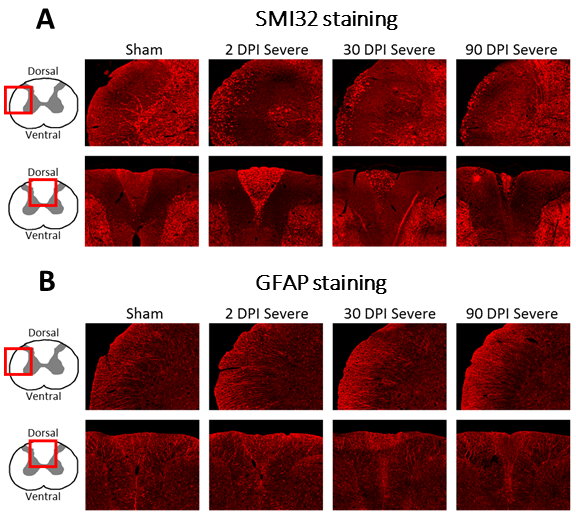
Compared to sham, FA in the dorsal WM column was lower in the SCI group (all severities combined) in the mid-thoracic (p=0.027) and upper thoracic segment (p=0.015) (Fig. 1). Cross-sectional area of the dorsal WM columns was lower in the mid-thoracic (p=0.048), upper thoracic (p=0.025), and upper cervical (p=0.034) segments (Fig. 2). Cross-sectional area of the GM was lower in the upper thoracic (dorsal horn: p=0.027; ventral horn: p=0.005), lower cervical (ventral horn: p=0.014), and upper cervical segments (dorsal horn: p=0.007; ventral horn: p=0.021) (Fig. 2). The 84-dpi BBB score correlated positively with the cross-sectional area of the dorsal WM column in the mid-thoracic (p=0.044) and upper thoracic segment (p=0.049) and also with the cross-sectional area of the dorsal GM horns in the mid-thoracic (p=0.035) and lower cervical segment (p=0.043) (Fig. 3). From histology, the number of SMI32 stained axons within the WM increased with injury severity (p<0.001) and decreased with time (p<0.001) (Fig. 4A), with significant interaction between injury severity and time (p=0.007). GFAP-stained sections quantified for focal coherence did not reveal significant effects of injury severity, time after injury, or their interaction (Fig. 4B).Discussion
Lower fractional anisotropy in the dorsal columns rostral to the injury epicenter indicates remote degeneration that reduces diffusion anisotropy by breaking the axonal cytoarchitecture5,17,18. This finding is supported by immunohistology, which showed that the rat spinal cord undergoes rapid axonal degeneration in the dorsal and ventrolateral WM in distal cervical segments, evidenced by the strong presence of non-phosphorylated neurofilaments as inferred from SMI32 staining at 2 dpi (Figs. 4-5). Phagocytosis of cellular debris from axonal and myelin breakdown by invading immune cells19,20 leads to atrophy of the dorsal column (macrostructural changes), indicated by smaller cross-sectional area on the T1-weighted images. Indications of GM atrophy in the upper cervical cord suggest that the longitudinal extent of neuron loss after contusion SCI is comparable or even larger than previously reported21,22.Conclusion
Diffusion MRI and MRI-based cross-sectional area measurements are sensitive tools to assess remote neurodegenerative and atrophic changes. Our findings in small animals confirm previous reports in SCI patients. Understanding the dynamics and extent of remote degeneration lays the foundation for the success of future therapeutic approaches to SCI.Acknowledgements
The study is funded by ERA-NET NEURON (32NE30_173678). PF is funded by a SNSF Eccellenza Professorial Fellowship Grant (PCEFP3_181362/1).References
1. Buss, A. & Schwab, M. E. Sequential loss of myelin proteins during Wallerian degeneration in the rat spinal cord. Glia 42, 424–432 (2003).
2. Seif, G. I., Nomura, H. & Tator, C. H. Retrograde axonal degeneration (‘dieback’) in the corticospinal tract after transection injury of the rat spinal cord: A confocal microscopy study. J. Neurotrauma 24, 1513–1528 (2007).
3. Yokota, K. et al. Pathological changes of distal motor neurons after complete spinal cord injury. Mol. Brain 2019 121 12, 1–15 (2019).
4. Chen, B. et al. Diffusion tensor imaging and electrophysiology as robust assays to evaluate the severity of acute spinal cord injury in rats. BMC Neurol. 20, 1–10 (2020).
5. Li, X. H. et al. Timing of diffusion tensor imaging in the acute spinal cord injury of rats. Sci. Rep. 5, (2015).
6. Patel, S. P. et al. Serial diffusion tensor imaging in vivo predicts long-term functional recovery and histopathology in rats following different severities of spinal cord injury. J. Neurotrauma 33, 917–928 (2016).
7. Wilcox, J. T. et al. Generating level-dependent models of cervical and thoracic spinal cord injury: Exploring the interplay of neuroanatomy, physiology, and function. Neurobiol. Dis. 105, 194–212 (2017).
8. David, G. et al. In vivo evidence of remote neural degeneration in the lumbar enlargement after cervical injury. Neurology 92, E1367–E1377 (2019).
9. Freund, P. et al. MRI investigation of the sensorimotor cortex and the corticospinal tract after acute spinal cord injury: A prospective longitudinal study. Lancet Neurol. 12, 873–881 (2013).
10. Petersen, J. A. et al. Chronic Cervical Spinal Cord Injury: DTI Correlates with Clinical and Electrophysiological Measures. J. Neurotrauma 29, 1556–1566 (2012).
11. Vedantam, A., Eckardt, G., Wang, M. C., Schmit, B. D. & Kurpad, S. N. Clinical correlates of high cervical fractional anisotropy in acute cervical spinal cord injury. World Neurosurg. 83, 824–828 (2015).
12. Motovylyak, A. et al. Longitudinal in vivo diffusion magnetic resonance imaging remote from the lesion site in rat spinal cord injury. J. Neurotrauma 36, 1389–1398 (2019).
13. Basso, D. M., Beattie, M. S. & Bresnahan, J. C. A Sensitive and Reliable Locomotor Rating Scale for Open Field Testing in Rats. J. Neurotrauma 12, 1–21 (1995).
14. Garyfallidis, E. et al. Dipy, a library for the analysis of diffusion MRI data. Front. Neuroinform. 8, 8 (2014).
15. Saliani, A. et al. Construction of a rat spinal cord atlas of axon morphometry. Neuroimage 202, 116156 (2019).
16. De Leener, B. et al. SCT: Spinal Cord Toolbox, an open-source software for processing spinal cord MRI data. Neuroimage 145, 24–43 (2017).
17. Brennan, F. H., Cowin, G. J., Kurniawan, N. D. & Ruitenberg, M. J. Longitudinal assessment of white matter pathology in the injured mouse spinal cord through ultra-high field (16.4T) in vivo diffusion tensor imaging. Neuroimage 82, 574–585 (2013).
18. Loy, D. N. et al. Diffusion Tensor Imaging Predicts Hyperacute Spinal Cord Injury Severity. 24, 979–990 (2007).
19. Wang, L. et al. Glial and axonal responses in areas of Wallerian degeneration of the corticospinal and dorsal ascending tracts after spinal cord dorsal funiculotomy. Neuropathology 29, 230–241 (2009).
20. Bethea, J. R. & Dietrich, W. D. Targeting the host inflammatory response in traumatic spinal cord injury. Current Opinion in Neurology vol. 15 355–360 (2002).
21. Pearse, D. D. et al. Histopathological and Behavioral Characterization of a Novel Cervical Spinal Cord Displacement Contusion Injury in the Rat. J. Neurotrauma 22, 680–702 (2005).
22. Falconer, J. C., Narayana, P. A., Bhattacharjee, M. & Liu, S. J. Characterization of an experimental spinal cord injury model using waveform and morphometric analysis. Spine (Phila. Pa. 1976). 21, 104–112 (1996).
Figures