1541
Altered neurochemical profiles and volume loss in the cerebellum and brainstem as biomarkers in spinocerebellar ataxia type 11Neurology, Radboudumc, Nijmegen, Netherlands, 2Medical Imaging, Radboudumc, Nijmegen, Netherlands
Synopsis
Keywords: Neurodegeneration, Spectroscopy, Single Voxel Spectroscopy
Spinocerebellar ataxia type 1 is a rare, progressive movement disorder primarily affecting the cerebellum and closely connected brain regions. We assessed the dynamics of MR biomarkers and their utility as progression and/or predictive biomarkers in SCA1. SCA1 patients showed an altered neurochemical profile when compared to controls. Additionally, we measured a lower volume of affected regions in patients, clearly distinguishing them from controls. Altered volume correlated strongest with clinical scores, confirming the potential to use MR-markers to monitor SCA1 progression. Furthermore, MRS markers correlated with consequent change in volumetric measures, showing preliminary evidence for their predictive value in SCA1.
Introduction
Spinocerebellar ataxia type 1 (SCA1) is a rare, progressive, autosomal dominant movement disorder, caused by a CAG-repeat expansion in the ATXN1 gene. SCA1 primarily affects the cerebellum and connected regions such as the pons1. Earlier work in early-to-moderate stage patients has shown MR measurements are more sensitive to disease progression than the clinical Scale for the Assessment and Rating of Ataxia (SARA)2-5. We investigated the dynamics of MR biomarkers in a relatively large group of SCA1 patients over the course of one year. Earlier studies including pre-symptomatic SCA1 carriers showed that patients have altered neurochemical profiles before clinical symptoms manifest2-5. This indicates a potential of MR biomarkers to serve as predictive markers of the earliest stages of disease progression. Therefore we assessed the relation between baseline metabolite concentrations and consequent progression of both structural changes in the brain and of clinical symptoms.Methods
Subjects: 29 genetically confirmed SCA1 patients and carriers (SARA 1 – 29.5) and 20 age- and gender-matched controls were included in this study. Participants were scanned during two visits: baseline and 1-year follow-up. All participants provided written informed consent.MR set-up: Scanning was performed on a 3T MRI scanner (Magnetom Prima-fit, Siemens Healthineers, Erlangen), equipped with a 32-channel head coil. MR protocol and post-processing: A 3D T1-weighted MPRAGE sequence was acquired as anatomical reference (TI 950ms, 0.9mm isotropic resolution). Single voxel spectroscopy (SVS) data was obtained with a modified sLASER sequence (TR/TE = 3000/28ms, 80 averages) with automated transmitter and water suppression adjustments and with FASTMAP shimming6,7,8. The voxels were manually placed in the vermis (10x25x25mm3), cerebellar white matter (17x17x17mm3), and pons (16x16x16mm3), always with the same voxel volumes (Fig 1). During acquisition, individual averages were spectrally aligned and an additional water reference spectrum was acquired. Spectra were fit with in-house automated LCModel scripts and corrected for tissue concentrations.
The MPRAGE images were processed with FreeSurfer 7.2 to estimate total intracranial volume (TIV) and volumes of the regions of interest (pons, cerebellum). Automated segmentation was visually inspected for accuracy. Volumes were normalized by TIV.
Clinical score: Clinical disease severity was evaluated via the most conventional and best validated ataxia rating scale SARA, consisting out of eight semi-quantitative evaluations of gait, stance, sitting, speech disturbance, and limb kinetic functions9. The SARA score can range from 0-40 with higher scores indicating more severe ataxia.
Statistical analysis: Analysis was performed using RStudio (R version 4.1.3). Obtained MR data was compared between patients and controls using ANCOVA. Linear regression analyses were performed to measure the relationship between MR markers and clinical SARA scores in the SCA1 patient group. Longitudinal data was evaluated with a general linear model (GLM) in which change in SARA and pontine volume acted as outcome variable. In all analyses we controlled for age and gender, as well as for disease duration when only considering the patient group.
Results & Discussion
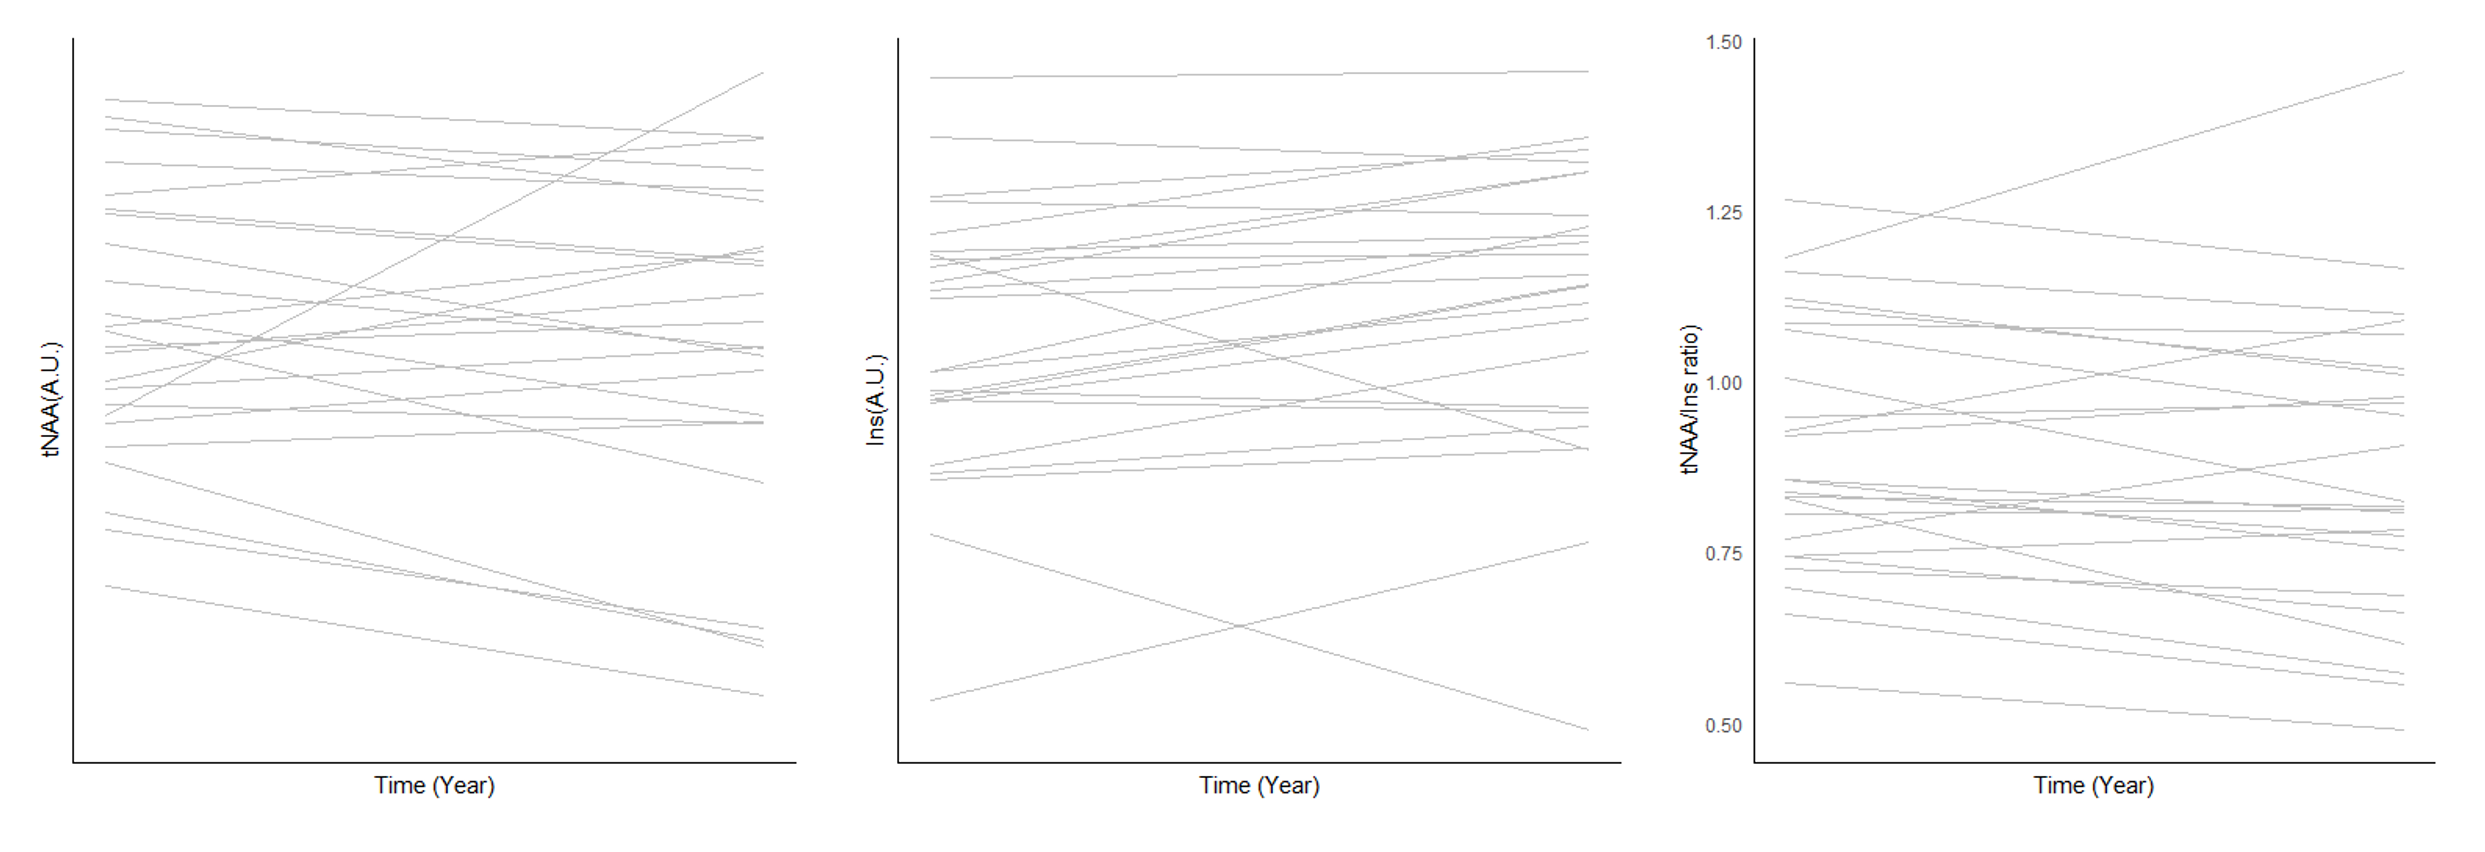
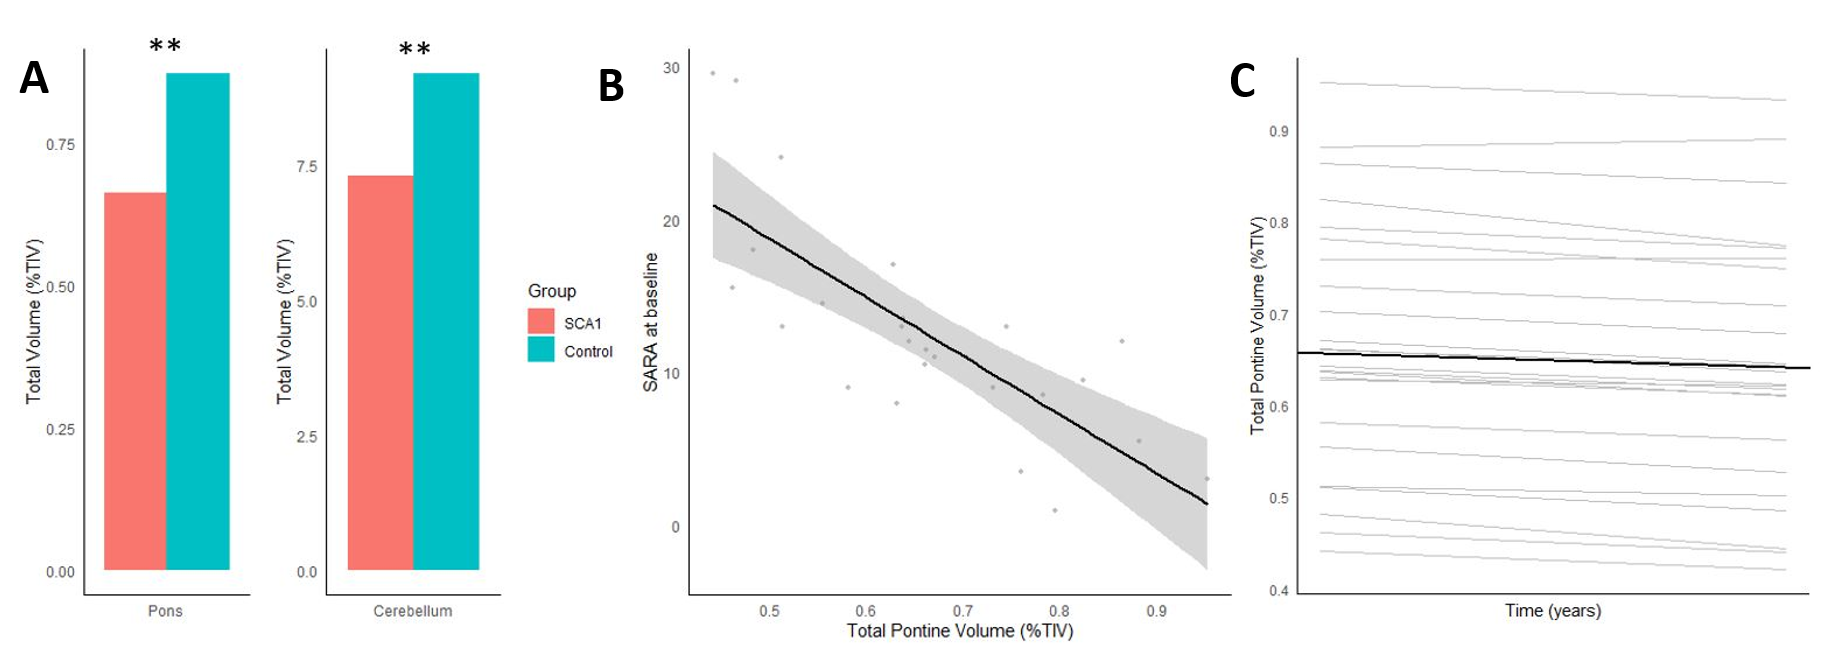
SCA1 patients showed significant (p < .05) alterations in their neurochemical profiles compared to controls at baseline. The most distinctive markers were the lower level of tNAA (NAA+NAAG) and higher myo-Inositol (Ins) level in the pontine and cerebellar white matter (CBWM) areas (Fig 2). Change in metabolic levels between baseline and 1-year follow-up did not reach significance, due in part to large variation between individual patients (Fig 3).Next to metabolic alterations at baseline, a significantly lower total cerebellar and pontine volume was detected in SCA1 patients compared to controls (Fig 4A). A smaller pontine volume between patients strongly correlated with their clinical SARA score at baseline (Fig 4B). Progression of pontine volume alterations over the course of 1-year in SCA1 patients is illustrated in Fig 4C.
In the GLM evaluation of the relation between baseline metabolite concentrations and changes of both SARA score and pontine volume we controlled for age, gender, and reported disease duration. None of the metabolic values were significantly associated with 1-year change in SARA score or pontine volume when considered individually. The ratio of tNAA/Ins is believed to serve as a measure that integrates both loss of neuronal integrity (tNAA) and glial proliferation (Ins)4. This ratio in the pons at baseline positively correlated with change in pontine volume over one year (p = 0.04, R2-adj = 0.37).
Next to this, our investigation of MR biomarkers was complemented by blood- and cerebrospinal fluid markers within the same cohort. Preliminary analyses indicate that the sensitivity of the MR biomarkers in SCA1 was higher as their effect sizes were superior in comparison with these markers (pontine volume change; d = 1.80).
Conclusion
We illustrate the utility of MRI and MRS as measures of disease progression in SCA1 patients. Our results confirm earlier findings2-5 and expand on them with a larger patient sample, wider range of SARA scores, and inclusion of additional biomarkers. This confirms the robustness of the MR measures as progression markers for SCA1. Furthermore, our study provides preliminary evidence for the predictive value of MRS markers for future SCA1 disease progression.As the first clinical trials of genetic interventions are commencing shortly, we show that MR biomarkers can serve as non-invasive, objective, highly sensitive read-outs to monitor disease progression and possible effects of treatments.
Acknowledgements
The MRS package we used was developed by Gülin Öz, Dinesh Deelchand, Edward J. Auerbach and Malgorzata Marjanska and was provided by the University of Minnesota under a C2P agreement6,7.
References
1. Yamada M, Sato T, Tsuji S, and Takahashi H. CAG repeat disorder models and human neuropathology: similarities and differences. Acta neuropathologica. 2008;115(1): 71-86.
2. Deelchand DK, Joers JM, Ravishankar A, et al. Sensitivity of Volumetric Magnetic Resonance Imaging and Magnetic Resonance Spectroscopy to Progression of Spinocerebellar Ataxia Type 1. Mov Disord Clin Pract 2019;6(7):549-558.
3. Nigri A, Sarro L, Mongelli A, et al. Spinocerebellar Ataxia Type 1: One-Year Longitudinal Study to Identify Clinical and MRI Measures of Disease Progression in Patients and Presymptomatic Carriers. Cerebellum 2022;21(1):133-144.
4. Öz G, Hutter D, Tkác I, et al. Neurochemical alterations in spinocerebellar ataxia type 1 and their correlations with clinical status. Movement Disorders. 2010;25(9):1253-1261.
5. Adanyeguh IM, Henry PG, Nguyen TM, et al. In vivo neurometabolic profiling in patients with spinocerebellar ataxia types 1, 2, 3, and 7. Movement Disorders. 2015;30(5):662-670.
6. Öz G, and Tkác I. Short-Echo, Single-Shot, Full-Intensity Proton Magnetic Resonance Spectroscopy for Neurochemical Profiling at 4T: Validation in the Cerebellum and Brainstem. Magnetic resonance in medicine. 2011;65:901-10.
7. Deelchand DK, Berrington A, Noeske R, et al. Across‐vendor standardization of semi‐LASER for single‐voxel MRS at 3T. NMR in Biomedicine. 2019;e4218
8. Gruetter R, and Tkáč I. Field mapping without reference scan using asymmetric echo‐planar techniques. Magnetic Resonance in Medicine. 2000;43(2):319-323.
9. Schmitz‐Hübsch T,du Montcel ST,Baliko L, et al. Scale for the assessment and rating of ataxia: development of a new clinical scale. Neurology 2006;66:1717–1720
Figures
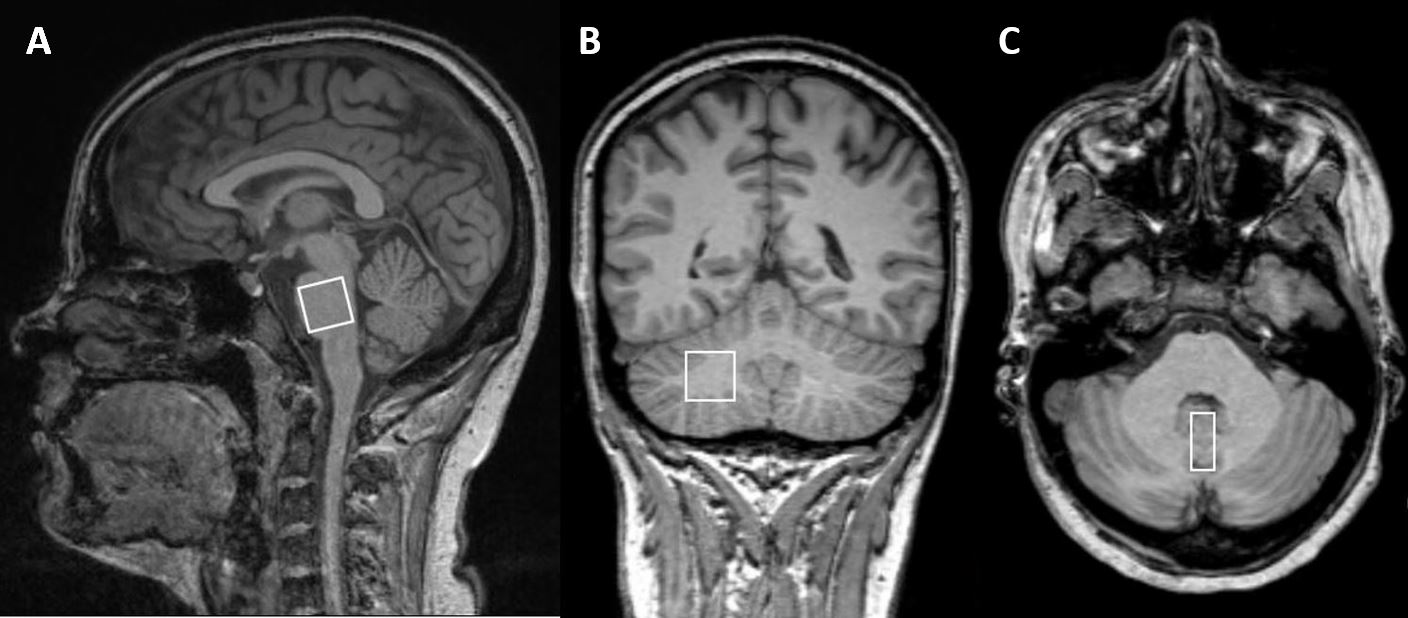
Figure 1. (A) Sagital orientation with voxel placement in the pons. (B) Coronal orientation with voxel placement in the cerebellar white matter. (C) Transversal orientation with voxel placement in the vermis.
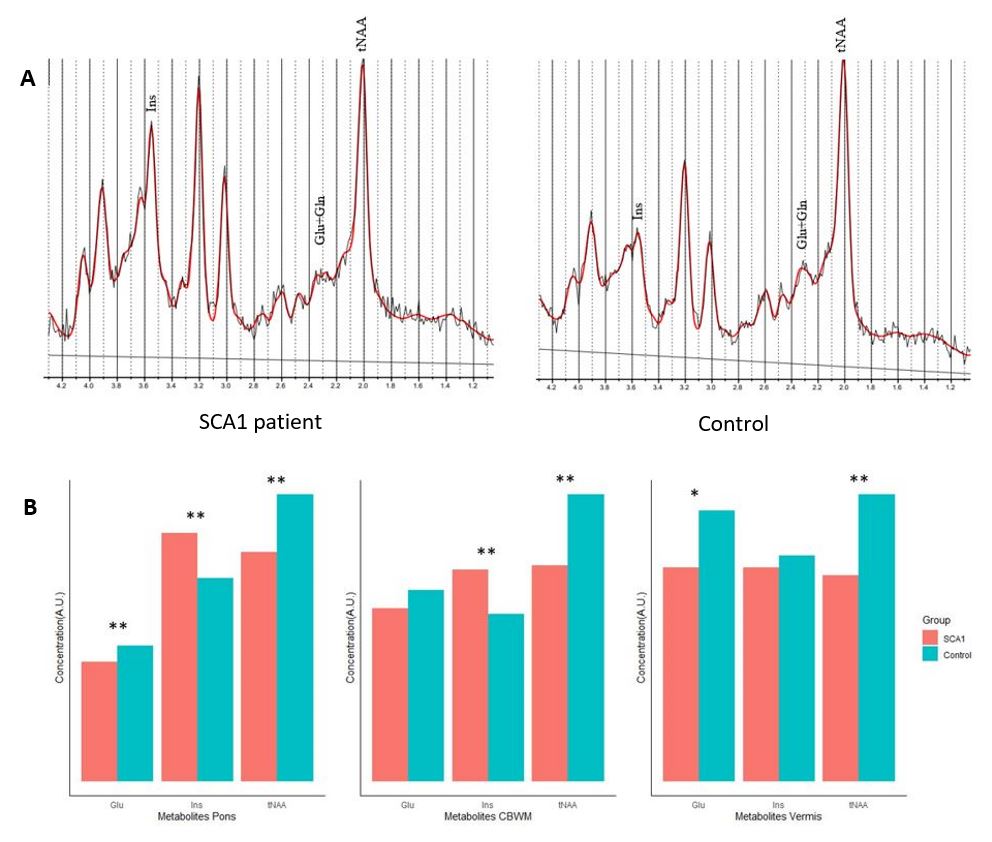
Figure 2. (A) Example of SVS data with LCModel fit from a SCA1 patient and healthy control. Data showed a significant alteration in the neurochemical profile in SCA1. (B) Comparison between SCA1 and control group showed significant alterations in several metabolites in all three regions of interest (* p<0.1, ** p<0.01).