1538
Neuromelanin-MRI Assessment in Dementia with Lewy Bodies
1Sagol Brain Institute, Tel Aviv Sourasky Medical Center, Tel Aviv, Israel, 2Sackler School of Medicine, Tel Aviv University, Tel Aviv, Israel, 3Center for Cognitive Neurology Unit, Neurological Institute, Tel Aviv Sourasky Medical Center, Tel Aviv, Israel, 4Sagol School of Neuroscience, Tel Aviv University, Tel Aviv, Israel, 5Laboratory of Early Markers of Neurodegeneration, Center for the Study of Movement, Cognition, and Mobility, Neurological Institute, Tel Aviv Sourasky Medical Center, Tel Aviv, Israel, 6The Genomic Research Laboratory for Neurodegeneration, Neurological Institute, Tel Aviv Sourasky Medical Center, Tel Aviv, Israel, 7Movement Disorders Unit, Neurological Institute, Tel Aviv Sourasky Medical Center, Tel Aviv, Israel
Synopsis
Keywords: Neurodegeneration, Genetics, Dementia with Lewy Bodies
Reduced neuromelanin-MRI signal and volume are known in Parkinson's disease (PD). However, changes in neuromelanin-MRI with Dementia with Lewy bodies (DLB) and whether there are genotype-related differences are unknown. In this study, we showed reduced neuromelanin signal and volume in patients with DLB compared to healthy controls. Yet, no differences were detected between genotype groups: DLB with and without GBA mutation. Results may suggest the same pathomechanism underlying DLB, PD and other neurodegenerative parkinsonian syndromes, with depletion of neuromelanin within the substantia nigra.
Introduction
Dementia with Lewy bodies (DLB), Parkinson's disease (PD), tauopathies, and synucleinopathies are considered neurodegenerative parkinsonian syndromes (NPS). The hallmark of neurodegenerative parkinsonism is the neurodegeneration of dopaminergic neurons in the substantia nigra (SN) pars compacta.1–3Mutations in the GBA gene in DLB are associated with a younger age of onset and a more severe disease phenotype. 4,5
Imaging findings in DLB show reduced dopamine transporter (DAT) uptake in basal ganglia, similar to other NPS. Imaging findings show occipital hypometabolism on fluorodeoxyglucose-positron emission tomography and relative preservation of medial temporal lobe structures on CT and MRI. 6–9
Neuromelanin is a substance produced by dopamine and noradrenaline metabolism and was shown to be reduced in PD patients using neuromelanin-sensitive MRI. Neuromelanin signal and volume were found to be lower in PD and other NPS using neuromelanin -MRI.10 Only one study with a small cohort of DLB patients reported a reduced volume of the SN with no difference in signal intensity compared with healthy controls (HC). 10–13
In this study, we aimed to investigate: (1) changes in neuromelanin-MRI in patients with DLB compared to HC; (2) genotype-related differences between DLB with and without GBA mutation.
Methods
Subjects: 73 participants were included in this study: 29 DLB patients and 44 healthy controls (HC).Genetic classification: Common mutations were tested for GBA gene. DLB patients were divided into GBA carriers (DLB-GBA) and non-carriers (nDLB).
Clinical, neurological, and neuropsychological assessment: All participants underwent physical and neurological examinations, including the Movement Disorders Society-Unified Parkinson's Disease Rating Scale-III (UPDRS), which was used to assess motor symptoms, and the Montreal Cognitive Assessment test (MoCA) was used to test global cognitive function.
MRI acquisition: Data was acquired on a 3.0 Tesla MRI Siemens scanner (MAGNETOM Prisma). The protocol included a 3D T1-weighted inversion recovery gradient echo sequence )1x1x1cm3); and neuromelanin-MRI acquired with 3D gradient echo sequence, TR = 55 msec, three TE's = 7.91, 15.96, 24 msec, flip angle = 16˚, and voxel dimensions = 0.6x0.6x1.3cm3.
Image analysis: Image analyses were performed using ITK-SNAP28 (www.itksnap.org), Statistical Parametric Mapping (SPM12; London, UK) in MATLAB (vR2021b; The MathWorks, Natick, MA, USA) and Python 3.9.10. The image analysis pipeline is illustrated in Fig.1. (1) The 3D T1-weighted images were realigned to the neuromelanin images. (2) The left and right SN regions of interest (ROI) were manually delineated on the neuromelanin images. (3) the midbrain was manually delineated on the T1-weighted registered images. (4) The T1-weighted registered images were segmented to extract the total intracranial volume (TIV) and the normal-appearing white matter mask at the midbrain level, used for normalization. (5) Subtraction of the SN volume from the midbrain.
Seven parameters were calculated from the SN ROI (separately for the right and left hemispheres) using two approaches:
Relative to the signal in the midbrain (after subtracting the SN volume): (1) the volumes of the SN ROI, (2) the signal-to-noise ratio, and (3) the contrast-to-noise ratio of the SN (Fig.1 method A). 14
Relative to the normal-appearing white matter at the level of the SN: (4) the signal intensity and (5) the volume of the SN ROI, both following a threshold value of 1.1 (Fig.1 method B). 11 Moreover, volumes from both methods were corrected for TIV.
Statistical analysis: Differences between groups were evaluated using t-tests, ANOVA, and Kruskal-Wallis, with Bonferroni or Dunn test as post hoc analysis in SPSS software (IBM SPSS Statistics for Windows, version 27, IBM corp., Armonk, NY, USA, 2020).
Results and Discussion
A total of 73 participants were included: (TABLE 1)Of the 29 patients with DLB, 12 were GBA carriers (DLB-GBA), and 17 were non-carriers (nDLB).
Patients with DLB were significantly older and fewer years of education than HC. They also had lower MoCA scores and significantly higher UPDRS scores, as expected. There was a larger proportion of males among patients with DLB than in HC.
No correlations were detected between imaging parameters and age.
Based on neuromelanin-MRI, patients with DLB had significantly lower signal, volume, and corrected volumes than HC (TABLE 2).
Within the DLB group, no significant differences were detected between DLB-GBA and nDLB.
No correlations were found between imaging parameters and the severity of parkinsonism, as indicated by UPDRS scores.
Conclusion
This is the first study to assess neuromelanin changes in a relatively large cohort of DLB patients compared to HC and to assess genotype-related differences. Results showed a reduced neuromelanin signal in DLB, which may suggest the same pathomechanism underlying DLB and other NPS regarding neuromelanin depletion within the substantia nigra.Acknowledgements
This work was supported by The Michael J. Fox Foundation for Parkinson’s Research (MJFF), the Aufzien Family Center for the Prevention and Treatment of Parkinson's Disease at Tel Aviv University, and Tel Aviv University Healthy Longevity Research Center.References
1. McKeith IG, Boeve BF, DIckson DW, et al. Diagnosis and management of dementia with Lewy bodies. Neurology. 2017;89(1):88-100. doi:10.1212/WNL.0000000000004058
2. Jellinger KA, Korczyn AD. Are dementia with Lewy bodies and Parkinson’s disease dementia the same disease? BMC Medicine 2018 16:1. 2018;16(1):1-16. doi:10.1186/S12916-018-1016-8
3. Levin J, Kurz A, Arzberger T, Giese A, Höglinger GU. The Differential Diagnosis and Treatment of Atypical Parkinsonism. Dtsch Arztebl Int. 2016;113(5):61. doi:10.3238/ARZTEBL.2016.0061
4. Shiner T, Mirelman A, Weisz MG, et al. High Frequency of GBA Gene Mutations in Dementia With Lewy Bodies Among Ashkenazi Jews. JAMA Neurol. 2016;73(12):1448-1453. doi:10.1001/JAMANEUROL.2016.1593
5. Shiner T, Mirelman A, Rosenblum Y, et al. The Effect of GBA Mutations and APOE Polymorphisms on Dementia with Lewy Bodies in Ashkenazi Jews. Journal of Alzheimer’s Disease. 2021;80(3):1221. doi:10.3233/JAD-201295
6. Morbelli S, Esposito G, Arbizu J, et al. EANM practice guideline/SNMMI procedure standard for dopaminergic imaging in Parkinsonian syndromes 1.0. European Journal of Nuclear Medicine and Molecular Imaging 2020 47:8. 2020;47(8):1885-1912. doi:10.1007/S00259-020-04817-8
7. Walker Z, Costa DC, Walker RWH, et al. Differentiation of dementia with Lewy bodies from Alzheimer’s disease using a dopaminergic presynaptic ligand. J Neurol Neurosurg Psychiatry. 2002;73(2):134. doi:10.1136/JNNP.73.2.134
8. Rizzo G, de Blasi R, Capozzo R, et al. Loss of Swallow Tail Sign on Susceptibility-Weighted Imaging in Dementia with Lewy Bodies. Journal of Alzheimer’s Disease. 2019;67(1):61-65. doi:10.3233/JAD-180687
9. Shams S, Fällmar D, Schwarz S, et al. MRI of the Swallow Tail Sign: A Useful Marker in the Diagnosis of Lewy Body Dementia? AJNR Am J Neuroradiol. 2017;38(9):1737. doi:10.3174/AJNR.A5274
10. Chougar L, Arsovic E, Gaurav R, et al. Regional Selectivity of Neuromelanin Changes in the Substantia Nigra in Atypical Parkinsonism. Movement Disorders. 2022;37(6):1245-1255. doi:10.1002/MDS.28988
11. Ben Bashat D, Thaler A, Lerman Shacham H, et al. Neuromelanin and T2*-MRI for the assessment of genetically at-risk, prodromal, and symptomatic Parkinson’s disease. npj Parkinson’s Disease 2022 8:1. 2022;8(1):1-8. doi:10.1038/s41531-022-00405-9
12. Kashihara K, Shinya T, Higaki F. Reduction of Neuromelanin-Positive Nigral Volume in Patients with MSA, PSP and CBD. Internal Medicine. 2011;50(16):1683-1687. doi:10.2169/INTERNALMEDICINE.50.5101
13. Castellanos G, Fernández-Seara MA, Lorenzo-Betancor O, et al. Automated Neuromelanin Imaging as a Diagnostic Biomarker for Parkinson’s Disease. Movement Disorders. 2015;30(7):945-952. doi:10.1002/MDS.26201
14. Gaurav R, Pyatigorskaya N, Biondetti E, et al. Deep Learning-Based Neuromelanin MRI Changes of Isolated REM Sleep Behavior Disorder. Movement Disorders. 2022;37(5):1064-1069. doi:10.1002/MDS.28933
Figures
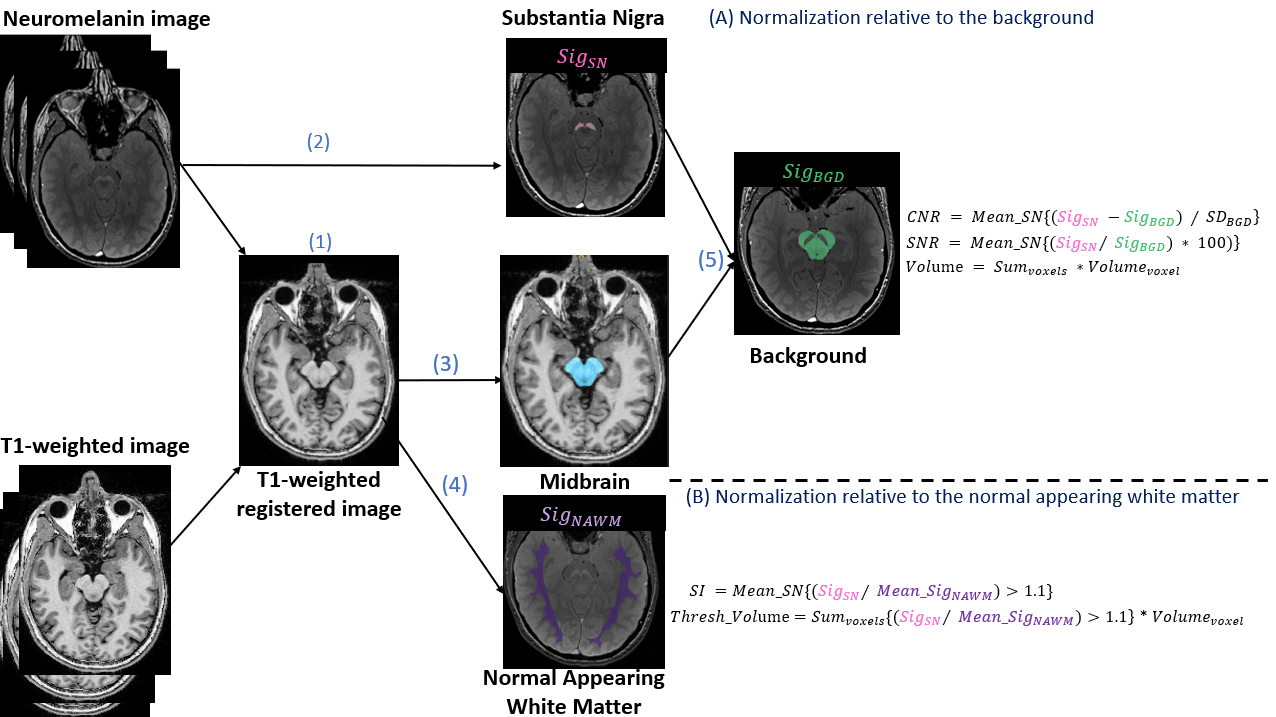
FIGURE 1.
Image analysis pipeline.
SN substantia nigra, NAWM normal-appearing white matter, Sig signal, CNR contrast-to-noise ratio, SNR signal-to-noise ratio, SI signal intensity, Thresh threshold.
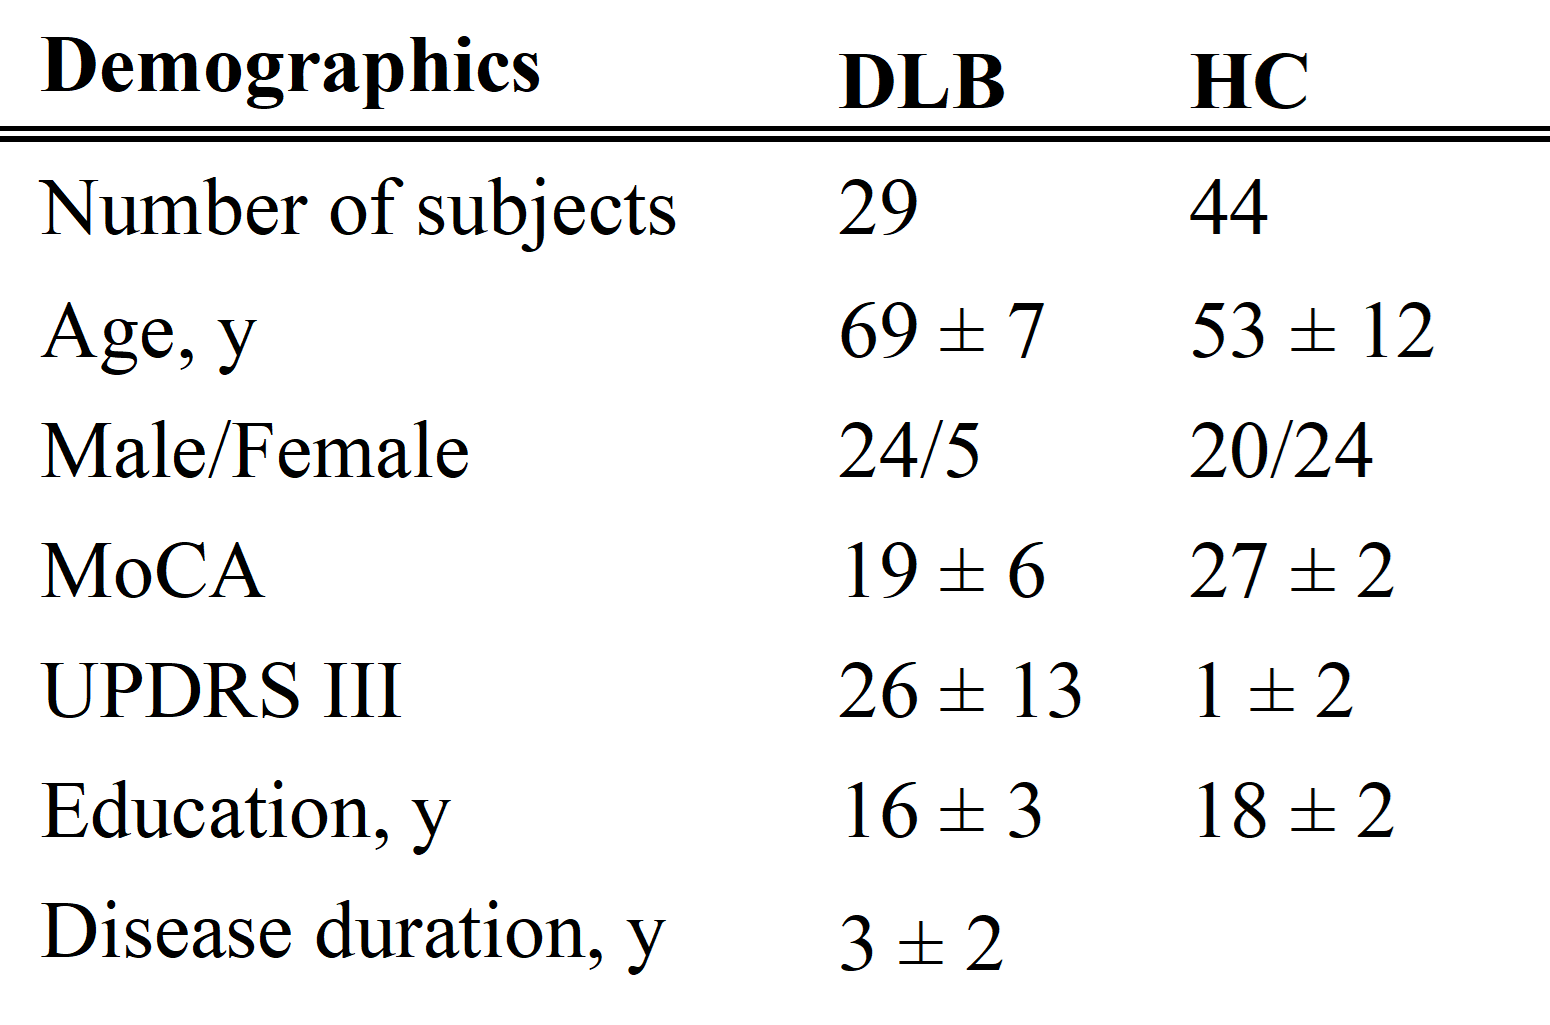
TABLE 1.
Demographic and clinical characteristics of DLB and HC. Data represented as mean ± standard deviation.
DLB Dementia with Lewy bodies, HC Healthy controls, MoCA Montreal Cognitive Assessment, UPDRS Unified Parkinson’s Disease Rating Scale.
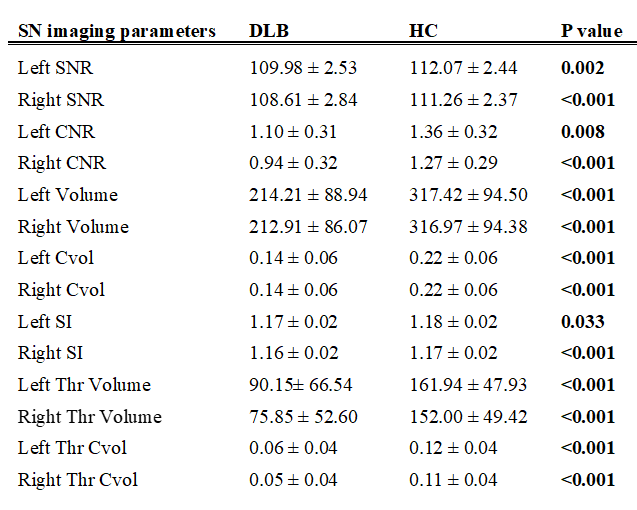
TABLE 2.
Imaging parameters comparing DLB and HC. Data represented as mean ± standard deviation. Significant differences (p<0.05) are shown in bold.
DLB Dementia with Lewy bodies, HC healthy controls, SNR signal-to-noise ratio, CNR contrast-to-noise ratio, Cvol corrected volume, SI signal intensity, Thr thresholded