1535
Evaluation of the anterior visual pathway in amyotrophic lateral sclerosis with optical coherence tomography and diffusion tensor imaging1Radiology, Tongji Hospital, Tongji Medical College, Huazhong University of Science and Technology, Wuhan, China, 2Neurology, The Central Hospital of Enshi Tujia and Miao Autonomous Prefecture, Enshi, China
Synopsis
Keywords: Neurodegeneration, Diffusion Tensor Imaging
Involvement of the visual pathway in amyotrophic lateral sclerosis (ALS) has been demonstrated. However, the exact damage mechanisms such as how the changes in the distinct parts of the anterior visual pathway (AVP) are still poorly understood and remain highly controversial. We observed altered RNFL, fractional anisotropy, mean diffusivity and relative anisotropy of AVP by the multimodal use of optical coherence tomography and DTI in ALS individuals compared to the controls. Our findings shed light on the dynamic pathophysiological effects on the morphology of the AVP and the potential association between microstructural damage to the AVP and executive function.Introduction
Initially considered a disease exclusively involving the motor system, ALS has now been recognized as a multi-system disorder with progressive involvement of multiple brain regions including visual pathway [1]. It is however unknown how the changes in the distinct parts of the anterior visual pathway occur during the disease course, and whether these changes are related to executive dysfunction in ALS patients. Optical coherence tomography (OCT) analysis has been proven a promising approach for exploring retinal involvement while diffusion tensor imaging (DTI) could help reveal microstructural brain tissue injuries and is extensively applied in the study of visual pathway [2, 3]. This study aimed to quantify the anterior visual pathway by the multimodal use of OCT and DTI and to evaluate how changes in the anterior visual pathway occur during the disease course and whether these changes are related to executive dysfunction or even disease progression in ALS patients.Methods
Patients: Twenty controls and thirty-one ALS individuals were enrolled and performed the neurological evaluation including Edinburgh cognitive and behavioral screen (ECAS). We categorized ALS into ALS-early and ALS-late according to the cutoff value of 12 months. In addition, using a cut-off value of 25 for the executive subdomain of ECAS, ALS patients were also divided into the group with executive impairment (ALS-ei) and the group with normal executive function (ALS-ne). Imaging: Spectralis OCT (Heidelberg Engineering, Heidelberg, Germany; Version 6.0.9) was used to measure the papillary RNFL. The average RNFL thickness, as well as the RNFL in the superior (RNFL-S), nasal (RNFL-N), inferior (RNFL-I) and temporal (RNFL-T) quadrants were automatically calculated. MRI scans were performed on a 3T scanner (Discovery 750, GE Healthcare, Milwaukee, WI, USA) with a 32Ch head coil. For DTI, a single-shot echo-planar imaging sequence was applied along with 64 non-collinear directions with b = 0 and 1000s/mm2. Data processing: Via the open source- DtiStudio, the fractional anisotropy (FA), relative anisotropy (RA), and mean diffusivity (MD) of optic nerve (ON) and optic tract (OT) were calculated (Figure 1). The differences in imaging characteristic, and the associations between the altered neuroimaging measures and cognitive performance were assessed using SPSS version 25.0.Results
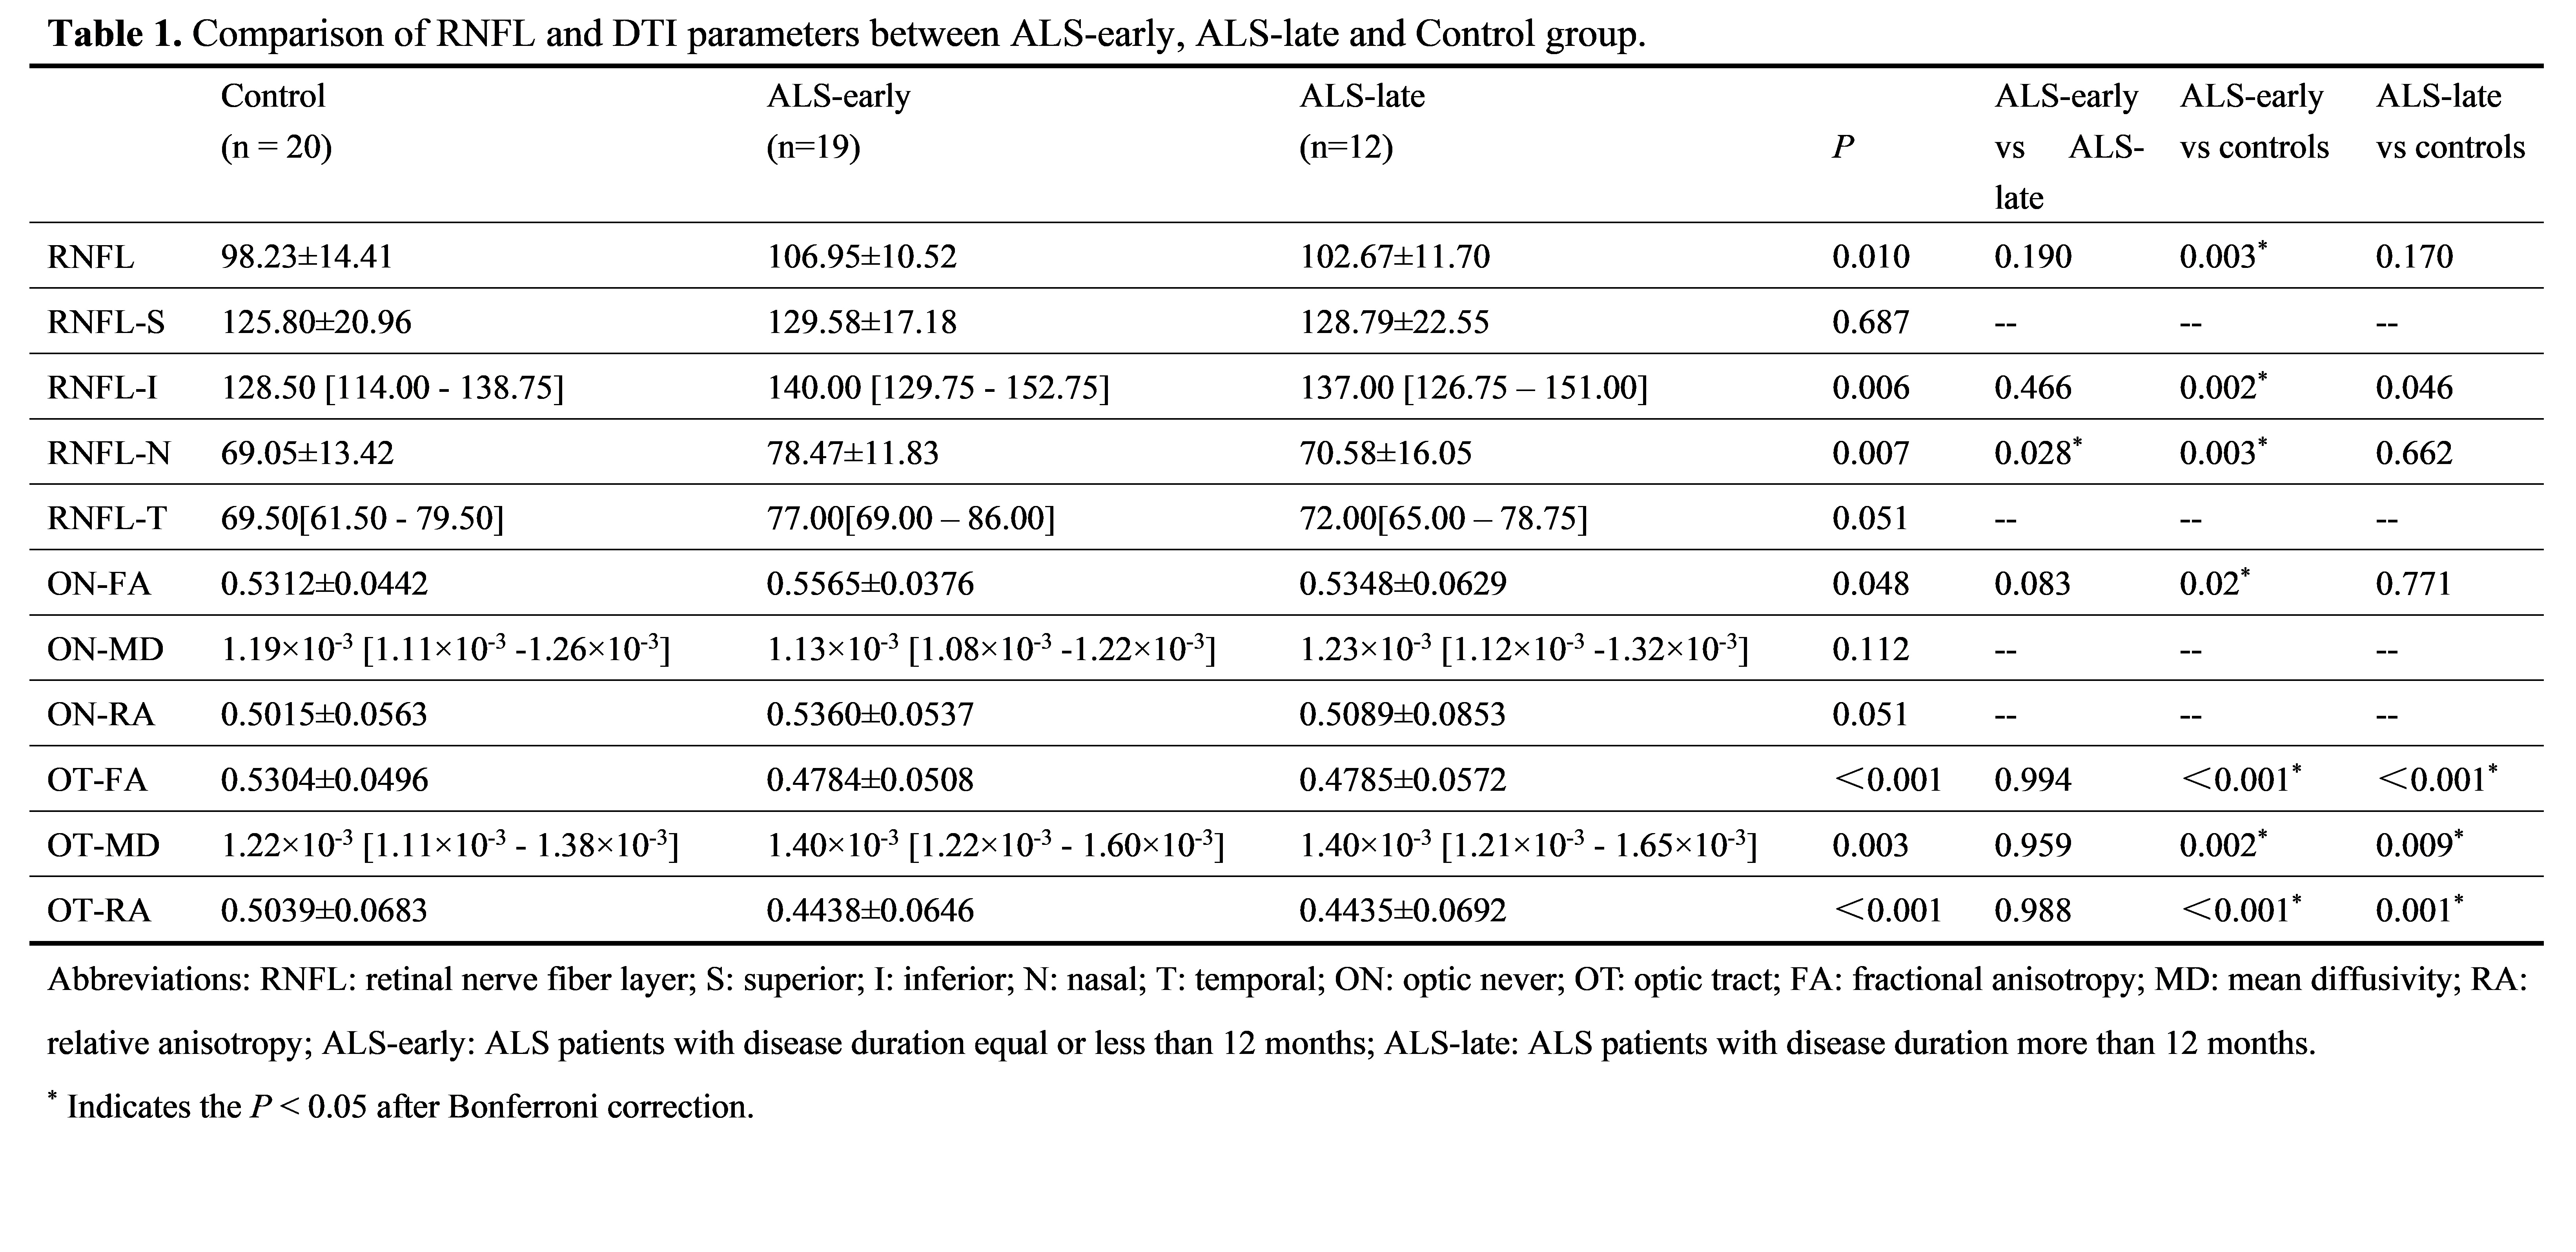
1) RNFL thickness was only increased in the ALS-early group when compared with controls but not in the ALS-late group (Table 1 & Figure 2A). FA value of ON was higher in the ALS-early group than in controls, while the FA value of ON was similar between the ALS-late groups and controls (Table 1 & Figure 2B). FA and RA values of OT in both ALS-early and ALS-late groups were lower than controls. And MD values of OT in both groups were higher than controls (Table 1 & Figure 2B, C).2) There was a tendency of gradually increased ON-FA and decreased OT-FA from controls, ALS-ne to ALS-ei (Table 2 & Figure 2). In addition, both ALS-ei and ALS-ne have higher MD of OT than control.
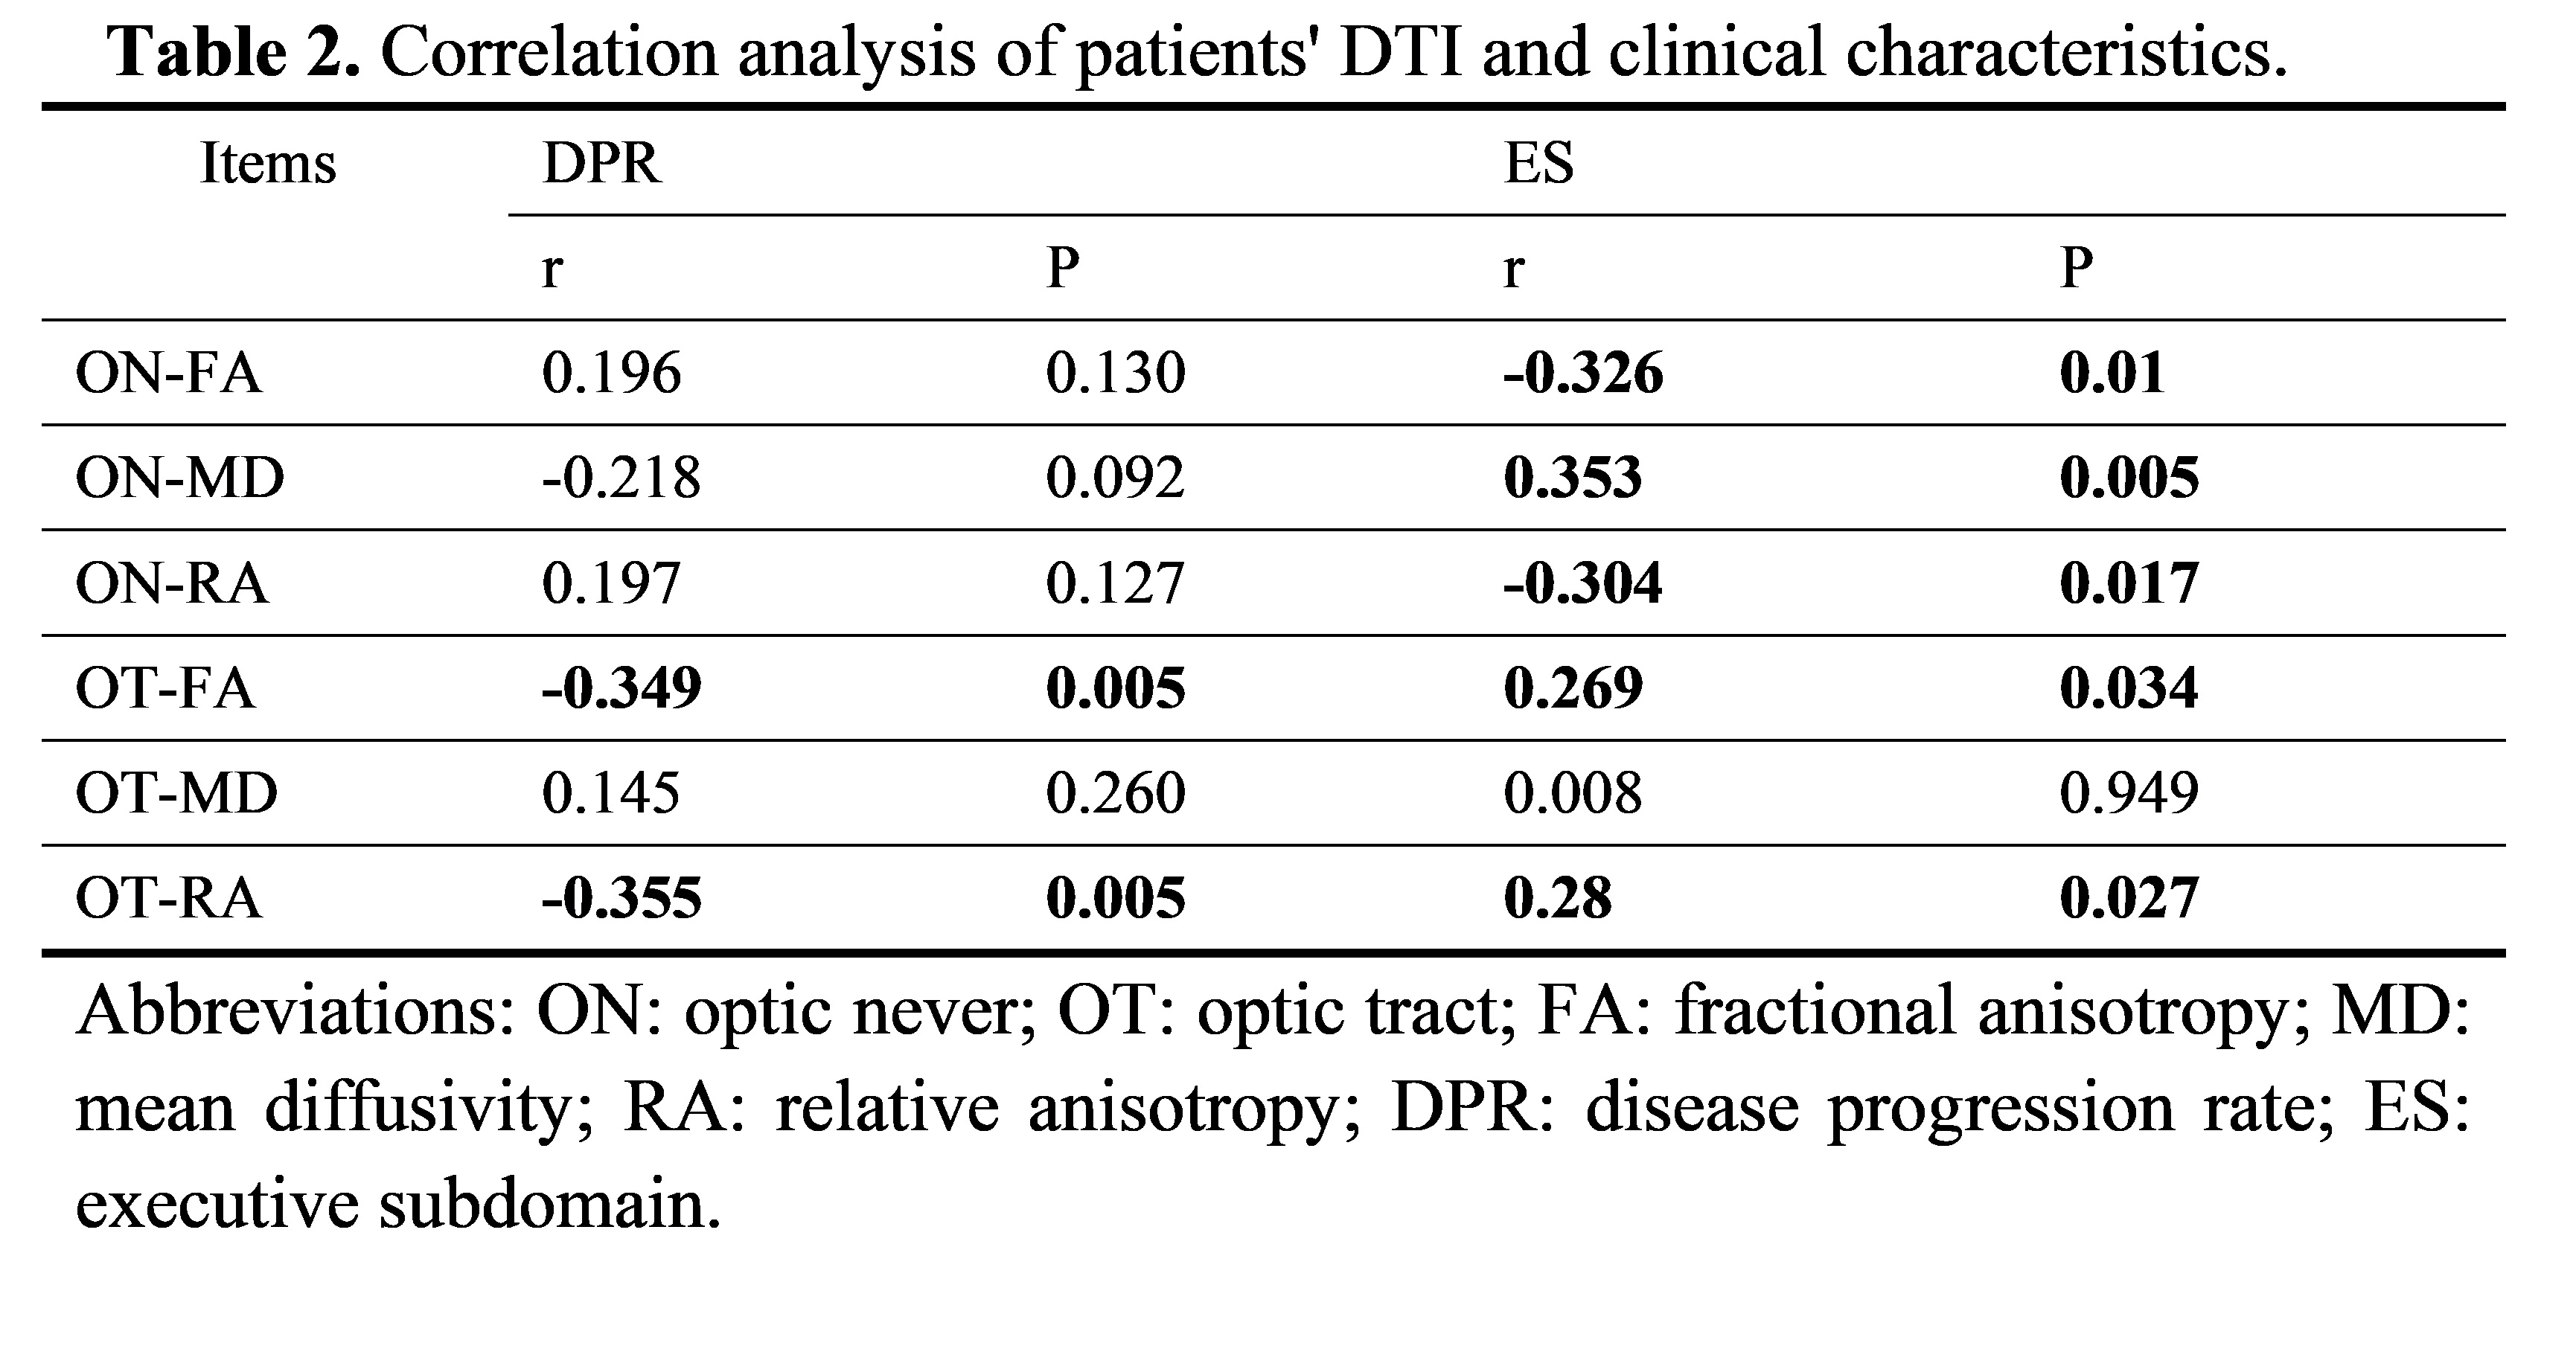
3) Disease progression rate was negatively correlated with FA and RA of OT. The executive subdomain score was negatively correlated with FA of ON and positively correlated with FA of OT (Table 3).
Discussion
Our study showed that RNFL thickness increased in the ALS-early group and then normalized in the ALS-late group, which is consistent with one recent study showing that RNFL thickness peaked around 12 months and then steadily decreased in ALS patients [4]. Such findings could be due to the switch of microglial activation from a neuroprotective M2 phenotype to a toxic M1 phenotype, leading to the release of neuro-toxic inflammatory factors and eventually neuronal death [5]. Additionally, the aggregation of phosphorylated neurofilament (P-NF) in the retina of ALS patients could also contribute to retinal thickening [6]. FA value of ON increased in the ALS-early group and then normalized in the ALS-late group, showing a similar trend with the changes in RNFL thickness which could be attributed to aggregation and structural alterations of mitochondria including swelling and vacuole formation as one of the early pathophysiological events in ALS [7]. The decrease of FA in the OT at an early stage is due to impaired anterograde axonal mitochondrial transport, as well as other mitochondrial-related pathogenic mechanisms including defective oxidative phosphorylation, production of reactive oxygen species, impaired calcium buffering capacity, and defective mitochondrial dynamics could render the OT to degeneration first [8]. Possible explanations for the potential link between damage to the AVP and executive function are that the dissemination of pathology from the prefrontal cortex to the anterior visual pathway or the dysfunctional connection between frontal and occipital lobes suggested by executive dysfunction.Conclusion
The visual pathway is involved in ALS. RNFL and ON seem to share similar temporal morphological changes while OT might have undergone neurodegeneration at a relatively early stage, suggesting dynamic pathophysiological effects on the morphology of the AVP. Monitoring of the AVP using DTI could potentially help evaluate the disease progression of ALS.Acknowledgements
This work was supported in part by the National Key R&D Program of China under Grant 2018YFE0118900, the clinical research program of Bethune Charitable Foundation, the innovative population project of Hubei Province (NO. 2019CFA030) and the National Natural Science Foundation of China (No. 81771793).References
1. Brettschneider, J., et al., Stages of pTDP-43 pathology in amyotrophic lateral sclerosis. Ann Neurol, 2013. 74(1): p. 20-38.
2. Tsokolas, G., et al., Optical Coherence Tomography Angiography in Neurodegenerative Diseases: A Review. Eye Brain, 2020. 12: p. 73-87.
3. Kuchling, J., et al., Diffusion tensor imaging for multilevel assessment of the visual pathway: possibilities for personalized outcome prediction in autoimmune disorders of the central nervous system. EPMA J, 2017. 8(3): p. 279-294.
4. Zhang, Y., et al., Selective and Inverse U-Shaped Curve Alteration of the Retinal Nerve in Amyotrophic Lateral Sclerosis: A Potential Mirror of the Disease. Frontiers in Aging Neuroscience, 2022. 13.
5. Liao, B., et al., Transformation from a neuroprotective to a neurotoxic microglial phenotype in a mouse model of ALS. Exp Neurol, 2012. 237(1): p. 147-52.
6. Sharma, K., et al., Retinal Spheroids and Axon Pathology Identified in Amyotrophic Lateral Sclerosis. Invest Ophthalmol Vis Sci, 2020. 61(13): p. 30.
7. Sasaki, S. and M. Iwata, Mitochondrial alterations in the spinal cord of patients with sporadic amyotrophic lateral sclerosis. J Neuropathol Exp Neurol, 2007. 66(1): p. 10-6.
8. Maresca, A., et al., The optic nerve: a "mito-window" on mitochondrial neurodegeneration. Mol Cell Neurosci, 2013. 55: p. 62-76.
Figures
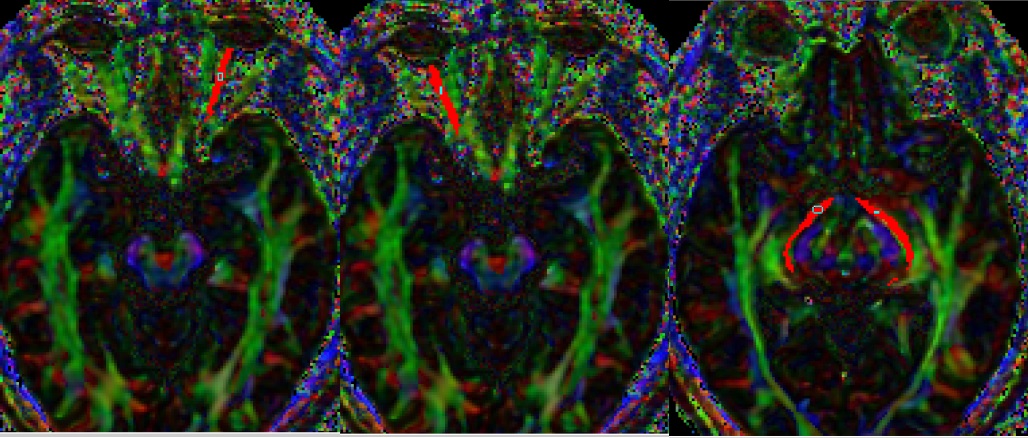
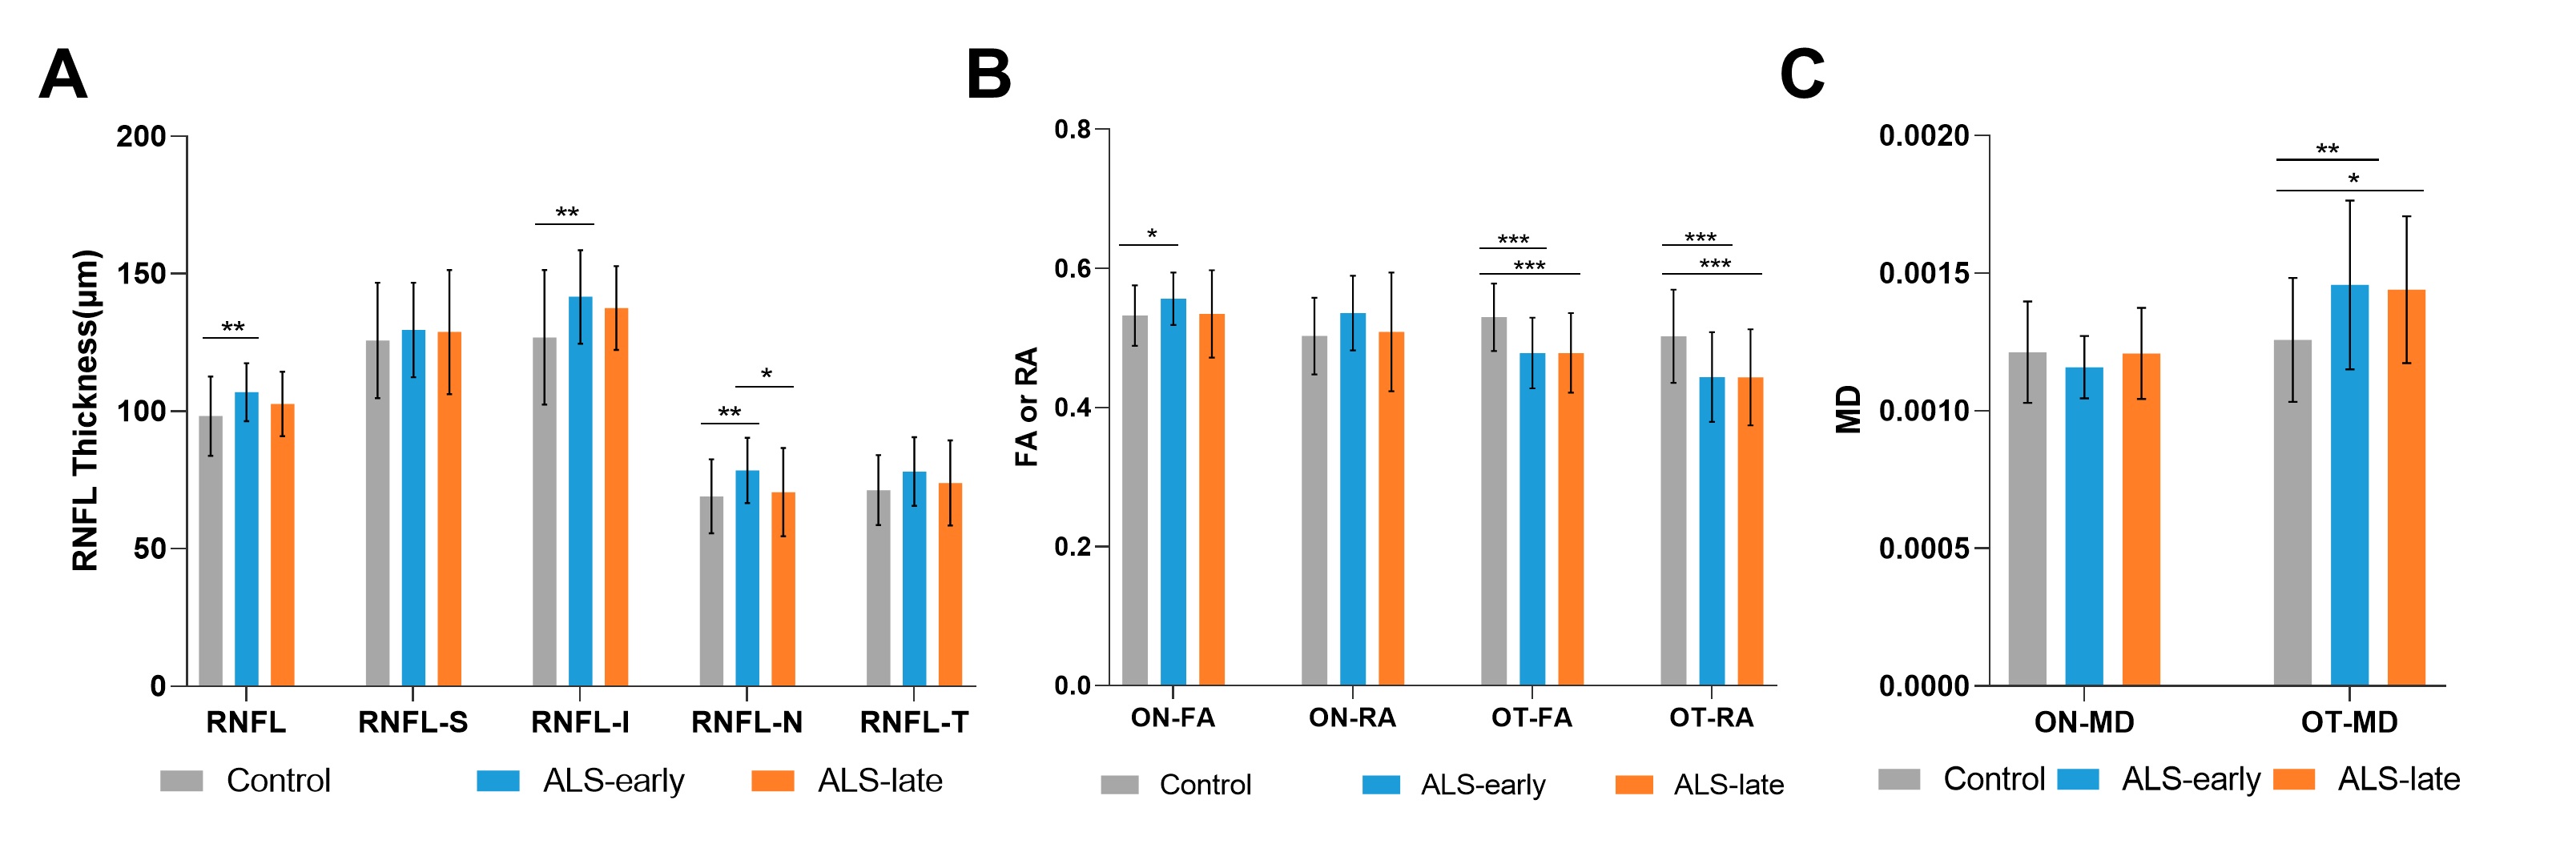
Figure 2. Comparison of RNFL and DTI parameters between ALS-early, ALS-late and healthy controls.
(A). comparison of RNFL thickness between ALS-early, ALS-late, and controls. (B). comparison of FA value/RA value of ON and OT between ALS-early, ALS-late, and controls. (C). comparison of MD value of ON and OT between ALS-early, ALS-late, and controls.
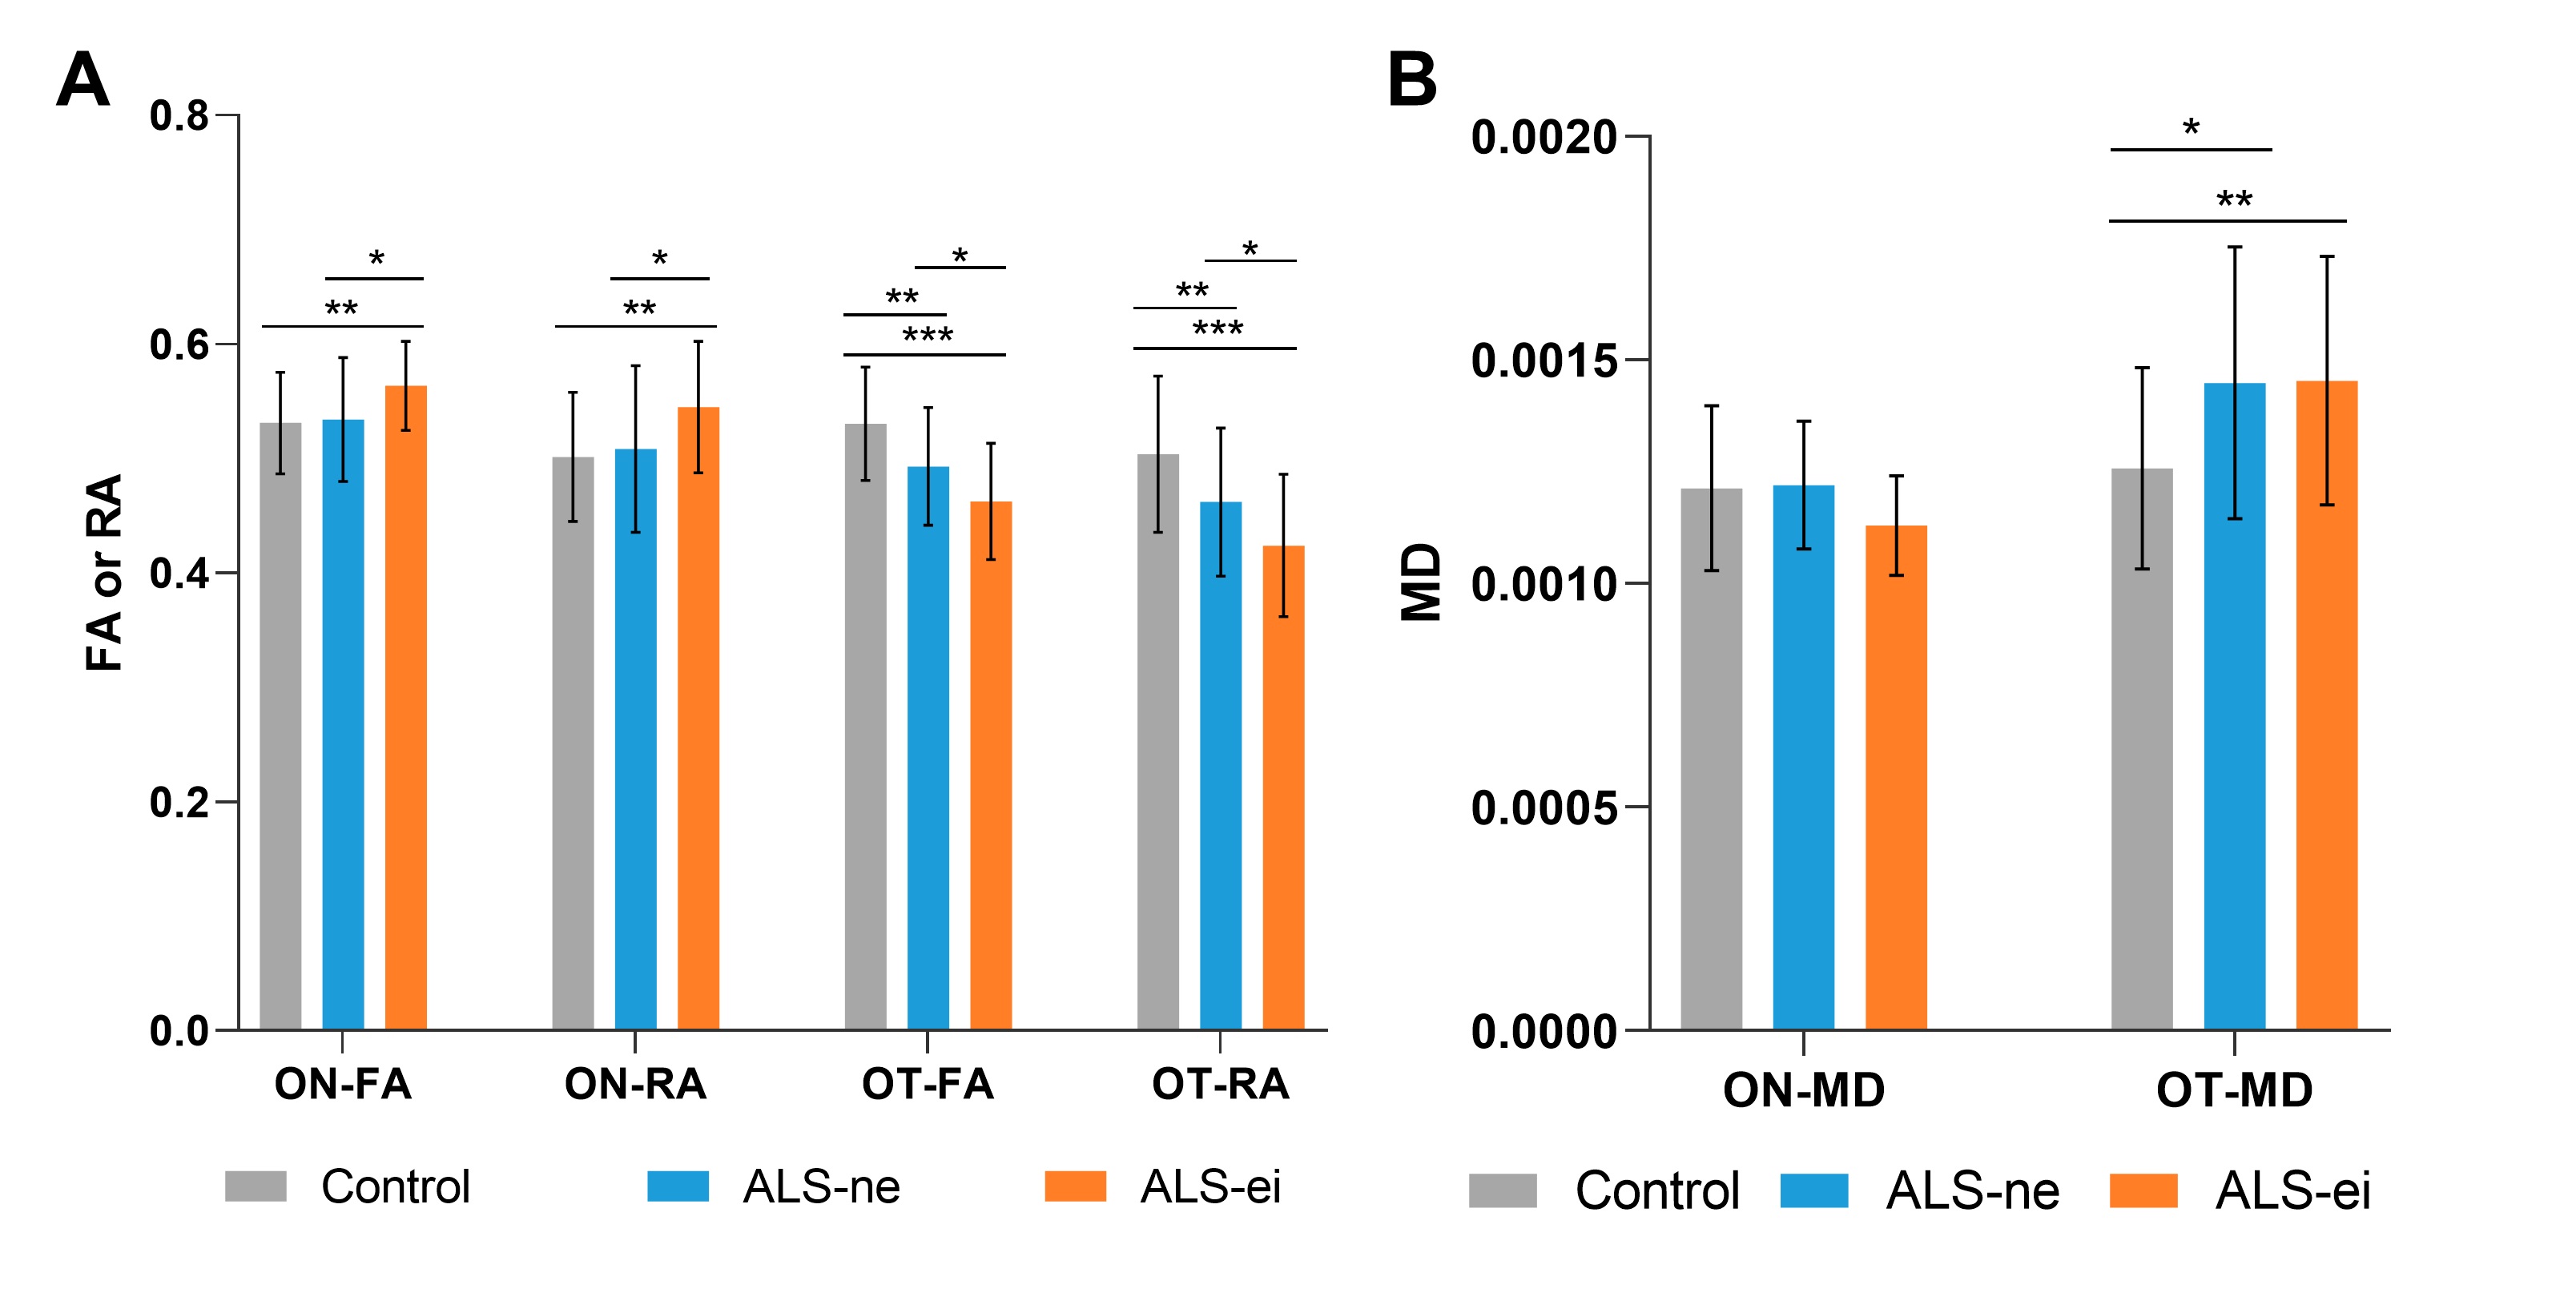
Figure 3. Comparison of DTI parameters between ALS patients with or without impairment of executive function and healthy control.
(A). comparison of FA value/RA value of ON and OT between ALS-ei, ALS-ne, and controls. (B). comparison of MD value of ON and OT between ALS-ei, ALS-ne, and controls.