1533
Examining the consistency of brain MRI structural and functional readouts using repeat imaging from the longitudinal UK Biobank MRI Study.1Department of Medical Biophysics, University of Toronto, Toronto, ON, Canada, 2Hurvitz Brain Sciences Research Program, Sunnybrook Research Institute, Toronto, ON, Canada, 3Harquail Centre for Neuromodulation, Sunnybrook Health Sciences Centre, Toronto, ON, Canada, 4Department of Medicine Division of Neurology, University of Toronto, Canada, Toronto, ON, Canada, 5Graduate Department of Rehabilitation Science, University of Toronto, Toronto, ON, Canada, 6Department of pharmacology and toxicology, University of Toronto, Toronto, ON, Canada, 7Department of Education, ICT and Learning, Østfold University College, Halden, Norway, 8Department of Radiology and Nuclear Medicine, Oslo University Hospital, Oslo, Norway
Synopsis
Keywords: Neurodegeneration, fMRI, Structural MRI
We aim to study structural and functional changes over time with a focus on the thalamus and hippocampus regions of interest. Longitudinal analysis was performed in N=274 UK Biobank participants. We find strong correlations between the baseline and follow-up MRI readouts. Namely, it is possible to predict thalamus and hippocampus volume changes across a mean of 2.25 years using baseline volume and resting state functional activation estimates. This work helps characterizing the longitudinal consistencies within both hippocampal and thalamic MR readouts and helps setting up prediction models as the next step.Introduction
Longitudinal neuroimaging studies help to reveal age-related brain changes in structure and functional activation, which may be associated with risks of neurological diseases. The thalamus and hippocampus are functionally connected brain regions and critical to learning, memory, and regulating many behaviours.1-2 Previous literature has identified an annual hippocampal atrophy rate from 0.79% to 2.0%, and such atrophy has been identified as a biomarker of Alzheimer’s disease.3-4 Thalamus atrophy is also associated with cognitive decline for other brain diseases.5 Thus, there is a need to understand better and predict such trajectories of brain changes along normal aging. Readouts from different magnetic resonance imaging (MRI) pulse sequences such as T1-weighted (T1w) and blood-oxygenation level-dependent (BOLD) MRI have become versatile tools to map the brain changes over time. Our study aims to create statistical linear models to first study the consistency of structural and resting-state functional brain MRI readouts, and second, to find whether it is possible to predict structural and functional alterations using baseline structural and resting-state functional MRI (rs-fMRI) readouts.Method
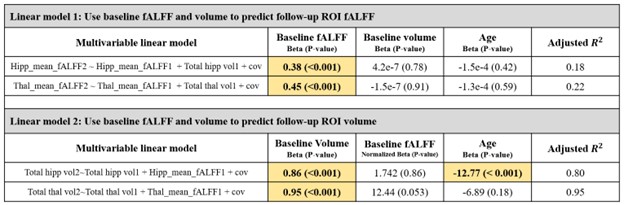
UK Biobank (UKB) is a population-based initiative collecting MRI data from more than 500 thousand adults in the United Kingdom. We accessed MRI data from 274 participants who completed both UKB imaging visits. T1w images were acquired using a 5-minute 3D MPRAGE EPI pulse sequence (TR/TE/IR = 2000ms/2.01ms/880ms, iPAT=2, flip angle = 8, FOV=208x256x256 mm). Rs-fMRI images were acquired using a 6-minute GE-EPI pulse sequence (TR/TE=735ms/39ms, no iPAT, flip angle = 52, FOV=211.2x211.2x153.6mm, 490 time points). T1w structural images were registered to the MNI-152 template, hippocampus and thalamus were segmented using FMRIB’s Integrated Registration and Segmentation toolbox for volume estimation. For each voxel within the rs-fMRI timeseries, the fractional amplitude of low-frequency fluctuation (fALFF) value for each voxel was calculated by dividing the sum of amplitudes within the low-frequency range (0.01Hz – 0.08Hz) by the sum of amplitude of the whole frequency spectrum. A fALFF value is a ratio between 0 and 1 and is correlated with brain resting state activity. Mean fALFF of the hippocampus and thalamus were then obtained by segmenting the fALFF map using the masks from segmented T1w images. Multivariable regression models were used to study whether baseline hippocampal/thalamic fALFF and volume can predict follow-up fALFF (Model 1) and volume (Model 2). The linear models were adjusted for age at baseline imaging, sex, and the time differences between two imaging visits (years).[Model 1] fALFF follow-up = fALFF baseline + structural baseline + Age + Sex + Time between two imaging visits
[Model 2] Structural follow-up = fALFF baseline + structural baseline + Age + Sex + Time between two imaging visits
Results
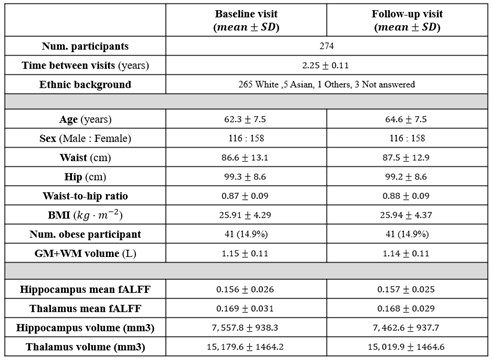
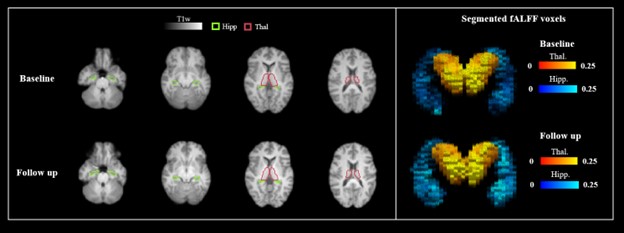
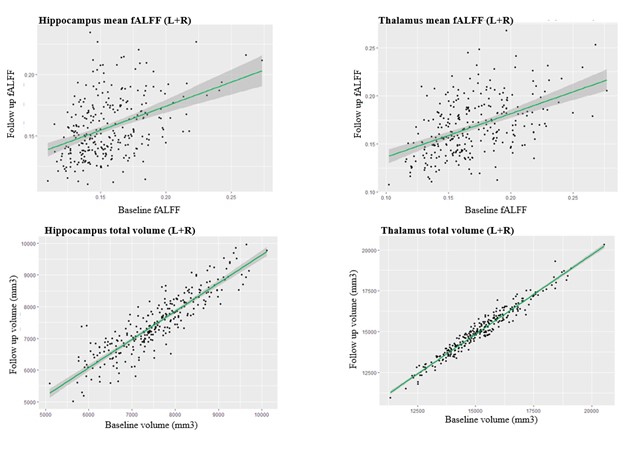
Table 1 summarises the demographic details of participants and their structural/functional MRI readouts (n=274). T statistics does not show a significant difference between the baseline and the follow-up readouts for both fALFF and volume changes in hippocampus and thalamus. Figure 1 shows an example of hippocampus and thalamus segmentation and an example of a calculated fALFF map for one participant. Figure 2 demonstrates a correlation between baseline MRI readouts versus follow-up MRI readouts for both hippocampus and thalamus regions of interest. Strong positive correlations were observed within both hippocampus and thalamus for both volume readout and fALFF readouts, while fALFF model prediction (R2 ~ 0.2) shows more variability when comparing with volume prediction (R2 ~ 0.8). Table 2 presents the summary of multivariable linear modeling using Model 1 and Model 2. We found strong correlations between baseline and follow-up MRI readouts within all linear models. We also found a trend showing baseline mean fALFF is positively correlated with follow-up volume change within thalamus ROI (P=0.053) with a relatively sizeable R2 value. Given baseline hippocampal volume, age strongly predicts follow-up hippocampal volume. Surprisingly, age is not associated with thalamus volume as well as hippocampus/thalamus fALFF.Discussions
We find there is a strong positive association between baseline and repeat brain imaging readouts, whereby the volume and fALFF estimates for hippocampus and thalamus were highly consistent over a mean of 2.25 years follow-up period. This work helps to demonstrate that longitudinal imaging can yield consistent result and it is interesting that between-participant differences at baseline seemed to persist at the second MRI session. There is an opportunity to scrutinize these data and discover the factors that contribute to these between-participant variability. The session-related explained variance for fALFF was lower than the volume regression model; this was the case for both regions-of-interest and would suggest that the functional data has more between-session variability. Interestingly, we also observed a trend that thalamus fALFF correlates independently with thalamus volume. With the large beta-weight and by extension effect size, the data trend would indicate resting-state functional activation of the thalamus at follow-up is related to baseline thalamus volume. This fALFF-follow-up to baseline structural association was not seen for the hippocampus. Future studies will incorporate additional model covariates to strengthen model prediction. We will also compute functional connectivity changes and include task-based functional MRI data in the analysis of the prediction models.Acknowledgements
We acknowledge the funding from Canadian Institutes of Health Research (CIHR).References
[1] Winocur, G. (1985). The hippocampus and thalamus: Their roles in short- and long-term memory and the effects of interference. Behavioural Brain Research, 16(2), 135–152. https://doi.org/10.1016/0166-4328(85)90088-9
[2] Perez, S. M., & Lodge, D. J. (2018). Convergent Inputs from the Hippocampus and Thalamus to the Nucleus Accumbens Regulate Dopamine Neuron Activity. The Journal of Neuroscience, 38(50), 10607–10618. https://doi.org/10.1523/JNEUROSCI.2629-16.2018
[3] Fjell, A. M., & Walhovd, K. B. (2010). Structural Brain Changes in Aging: Courses, Causes and Cognitive Consequences. Reviews in the Neurosciences, 21(3), 187–222. https://doi.org/10.1515/REVNEURO.2010.21.3.187
[4] de Flores, R., La Joie, R., & Chételat, G. (2015). Structural imaging of hippocampal subfields in healthy aging and Alzheimer’s disease. Neuroscience, 309, 29–50. https://doi.org/10.1016/j.neuroscience.2015.08.033
[5] Burggraaff, J., Liu, Y., Prieto, J. C., Simoes, J., de Sitter, A., Ruggieri, S., Brouwer, I., Lissenberg-Witte, B. I., Rocca, M. A., Valsasina, P., Ropele, S., Gasperini, C., Gallo, A., Pareto, D., Sastre-Garriga, J., Enzinger, C., Filippi, M., De Stefano, N., Ciccarelli, O., … Guttmann, C. R. G. (2021). Manual and automated tissue segmentation confirm the impact of thalamus atrophy on cognition in multiple sclerosis: A multicenter study. NeuroImage Clinical, 29, 102549–102549. https://doi.org/10.1016/j.nicl.2020.102549
Figures