1528
“Hot cross bun” Sign Grades Means Different White Matter Changes in MSA-C: A Neurite Orientation Dispersion and Density Imaging Study1Radiology, Liaocheng People's Hospital, Liaocheng, China, 2Philips Healthcare, Shang Hai, China, 3China-Japan Friendship Hospital, Chinese Academy of Medical Sciences & Peking Union Medical College, Bei Jing, China
Synopsis
Keywords: Neurodegeneration, Diffusion/other diffusion imaging techniques, voxel-wise tract-based spatial statistics
White matter (WM) changes play an important role in the progression of multiple system atrophy cerebellar type (MSA-C), and doctors need an imaging marker to grade the WM alterations. We observed different WM alterations between MSA-C patients with unclear “hot cross bun” sign (HCBs) and patients with complete HCBs, using NODDI, analyzed by TBSS. Compared with healthy controls, patients with complete HCBs showed broader different regions of intracellular volume fraction (ICVF) than ones with unclear HCBs, and meanwhile, difference of orientation dispersion index (ODI) and isotropic volume fraction (ISOVF) were only shown in complete HCBs ones. Difference of ICVF between patients with unclear and complete HCBs was also obvious. All of these findings indicated HCBs might be an imaging marker to assess the WM changes in MSA patients.
Introduction
Multiple System Atrophy Cerebellar type (MSA-C) is a rare neurodegenerative disease and may lead to areas deep in the brain shrinking. Zhu et al 1 showed that the “hot cross bun” sign (HCBs) was an imaging marker for the severity of cerebellar ataxia in MSA-C, and some studies 2 suggested that the microstructural changes of the white matter (WM) were earlier than the formation of HCBs. DTI was the common technique used to evaluate WM changes,3 and recently, more advanced diffusion MRI methods, such as NODDI, have been applied to find more detailed alterations of WM in MSA 4. In the evaluation of MSA-C, the role of the HCBs scale in predicting WM changes is still unclear. In this study, we intend to assess alterations of WM by NODDI in patients with MSA-C grouped based on different HCBs grades, trying to find the relationship between the HCBs and the WM changes.Methods
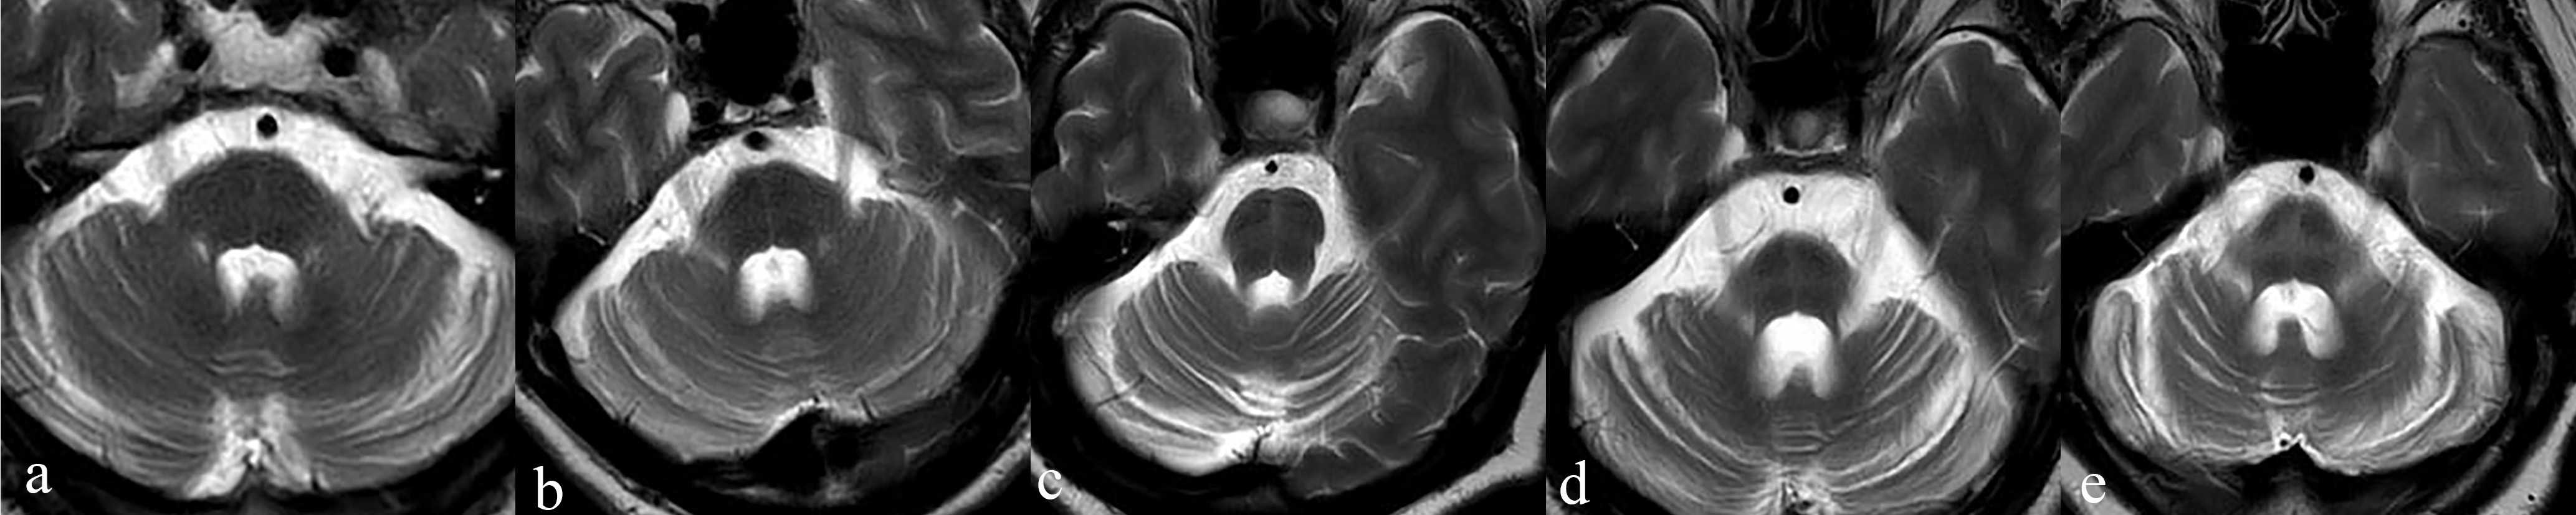
This study was approved by the institutional research ethics board of Liaocheng People’s Hospital. From October 2021 to October 2022, 18 patients with MSA-C (57.8±6.5 y, female: male=11:7) and 10 healthy controls (HCs, 55.5±4.2 y, female: male=6:4) were enrolled. All included patients met the sporadic, progressive, and maturity-onset characteristics of MSA-C, and all of them undergone the Unified MSA Rating Scale (UMSARS), including part I and II. The HCBs was graded in T2w images according to criteria of previous study by Horimoto et al.2 (Fig1) Patients with Grade 1-3 were defined as unclear HCBs group (n=9,58.9±6.3 y, female: male=5:4), as well as patients with Grade 4-5 were defined as completed HCBs group (n=9,56.7±6.9 y, female: male=6:3).All MRI data were acquired on a 3.0 T scanner (Elition, Philips Healthcare, Best, The Netherlands) with a 32-channel phased array head coil. Imaging protocols includeT2w, and a q-space sampled diffusion MRI. Detailed parameters for diffusion MRI are listed below. Multi-shell acquisition, 120 directions with 10 different b-values, ranging from 0 to 4000 s/mm2. TR/TE = 3493/95 ms, FOV = 224*224 mm2, voxel size = 2*2 mm2, slice thickness = 2 mm, 69 slices, with multiband factor = 3. The total acquisition time for the q-space diffusion MRI was 7 min 8 s. The acquired DICOM images for the diffusion MRI were imported into an in-house developed software ISMS (IntelliSpace Medicina Scientia) based on the open-source tool DIPY(https://dipy.org). Detailed mathematical models and processing steps are similar to the reference 5 and are omitted here for simplicity. Four-parameter maps were generated: intracellular volume fraction (ICVF), orientation dispersion index (ODI), isotropic volume fraction (ISOVF), and fractional anisotropy (FA). Voxel-wise tract-based spatial statistics (TBSS) of FA, ICVF, ODI, ISOVF maps were carried out in FSL (Version 6.0.1).The UMSARS part I, part II and the sum of two between the unclear HCBs group, the complete HCBs group were compared using the Mann-Whitney test, the statistical significance was set as p<0.05. Group comparisons of voxel-based maps of ICVF, ODI, ISOVF and FA were performed in TBSS, using the non-parametric statistical thresholding approach. 2000 permutations and statistical inference using threshold-free cluster enhancement (TFCE) were performed, with p<0.05 after family-wise error correction for multiple comparisons.Results
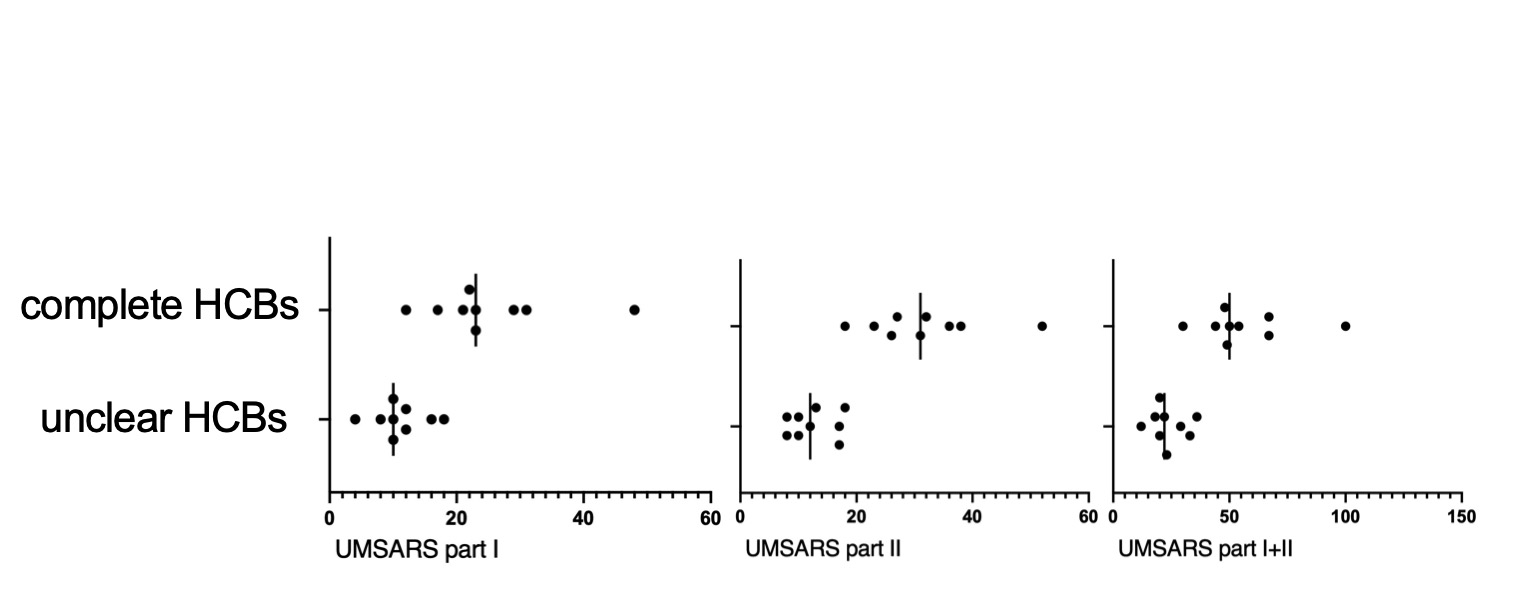
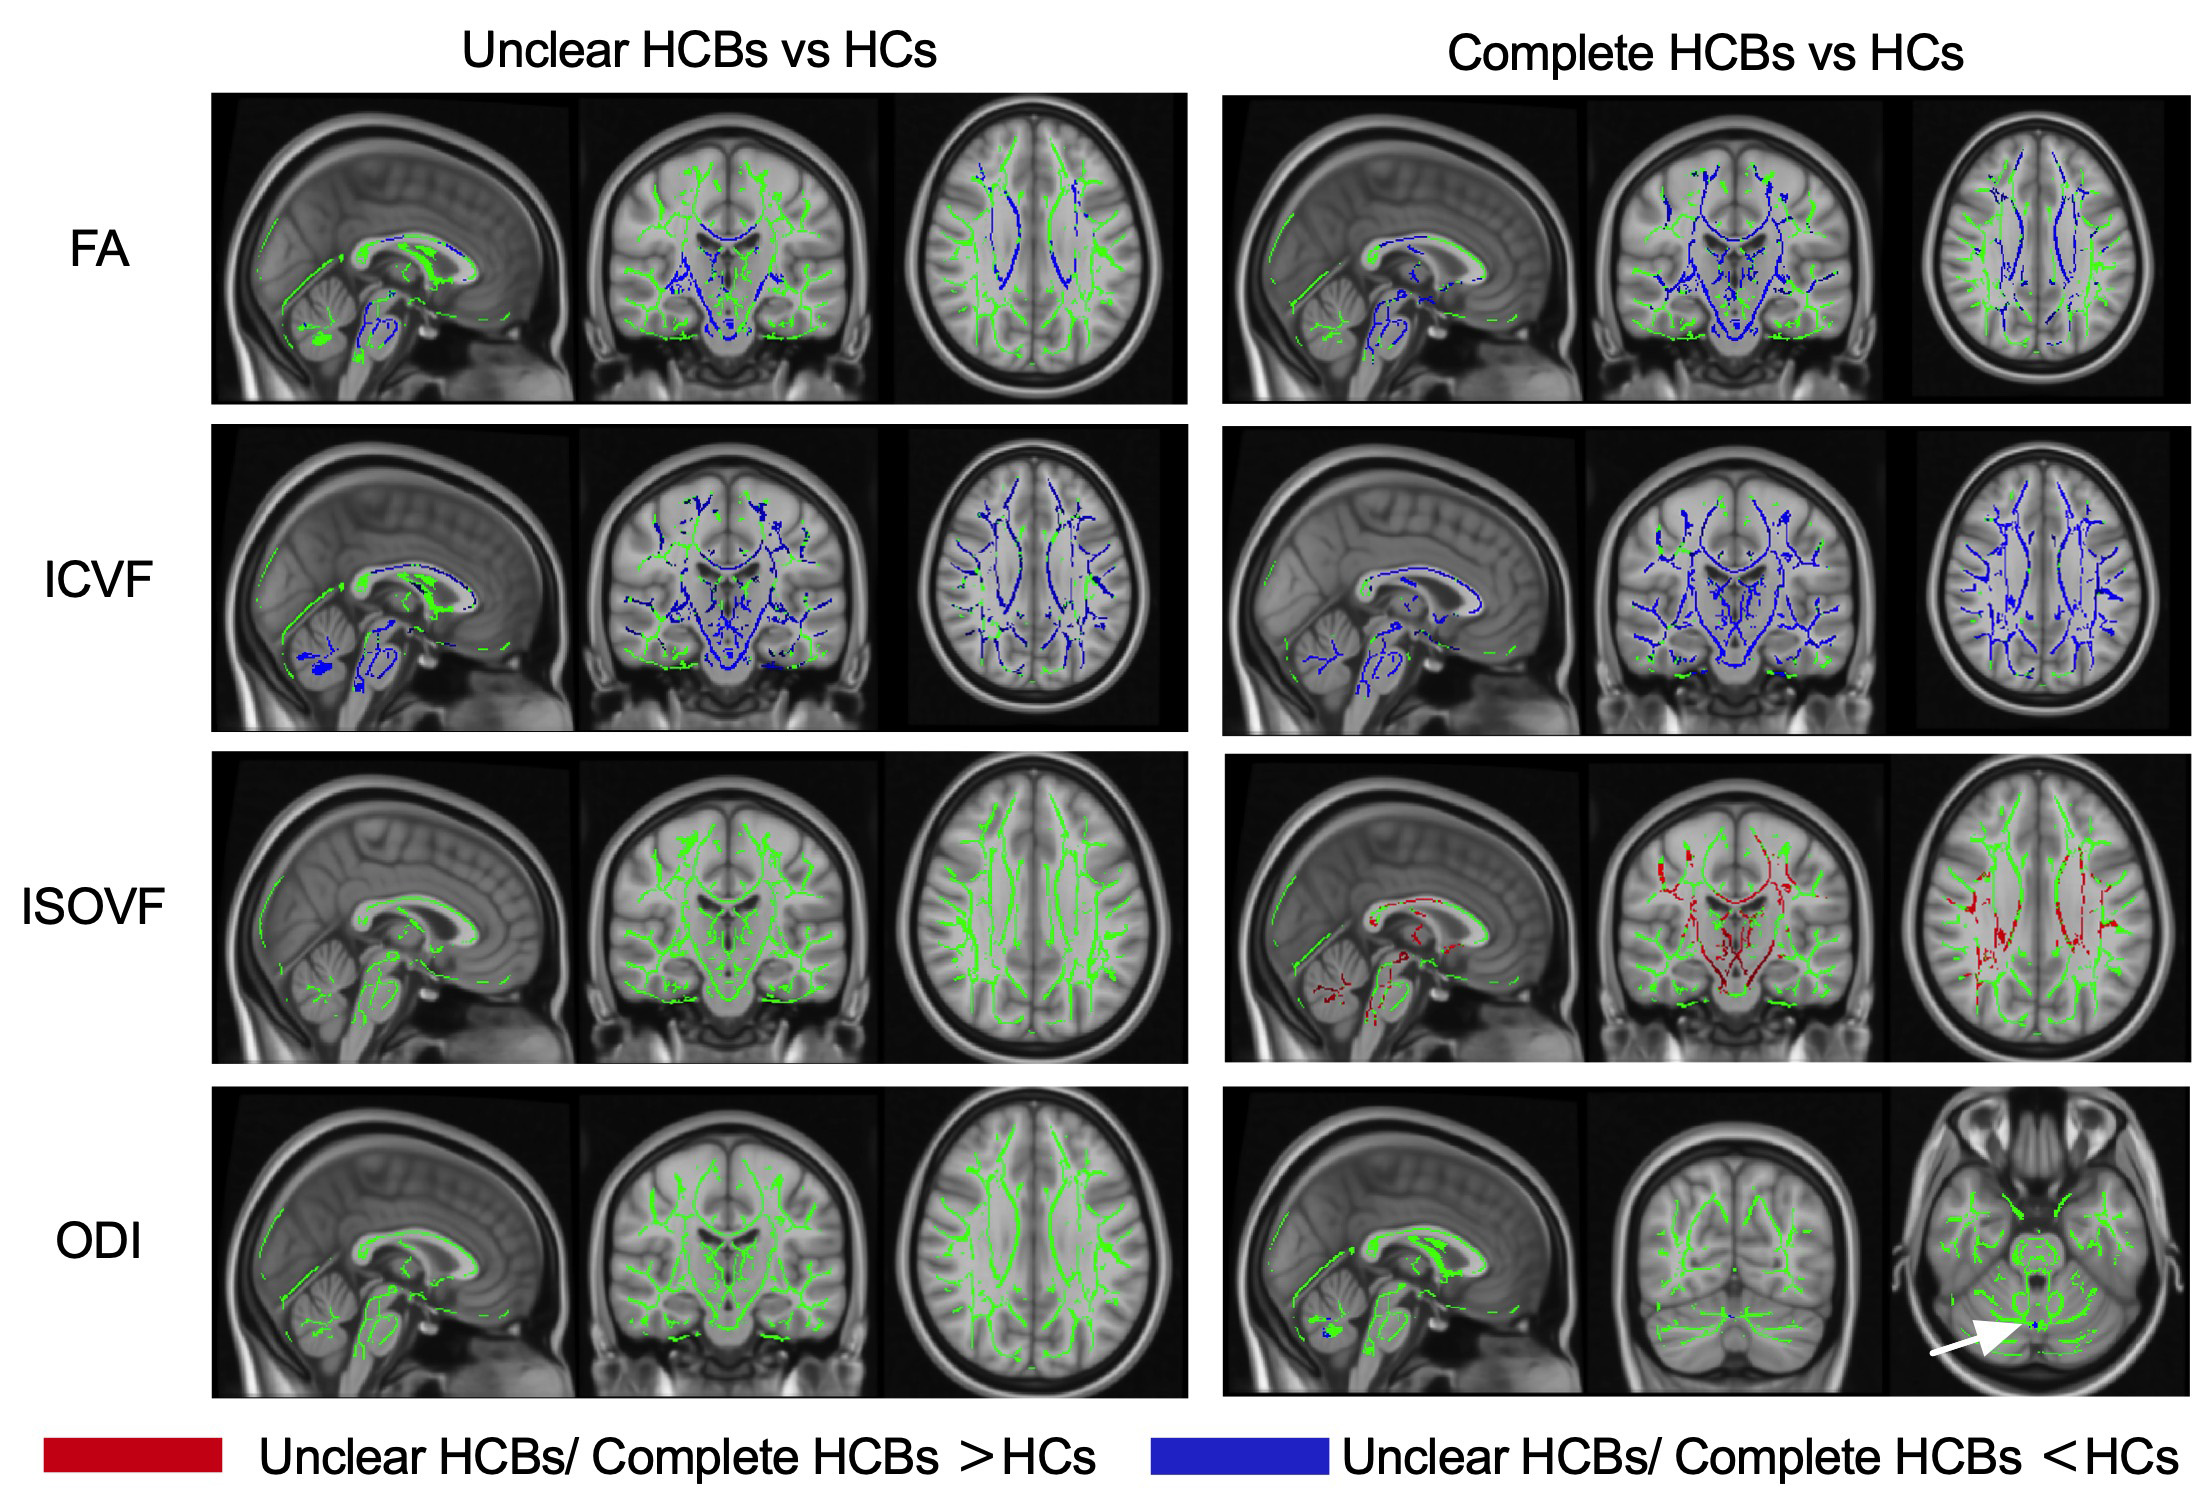
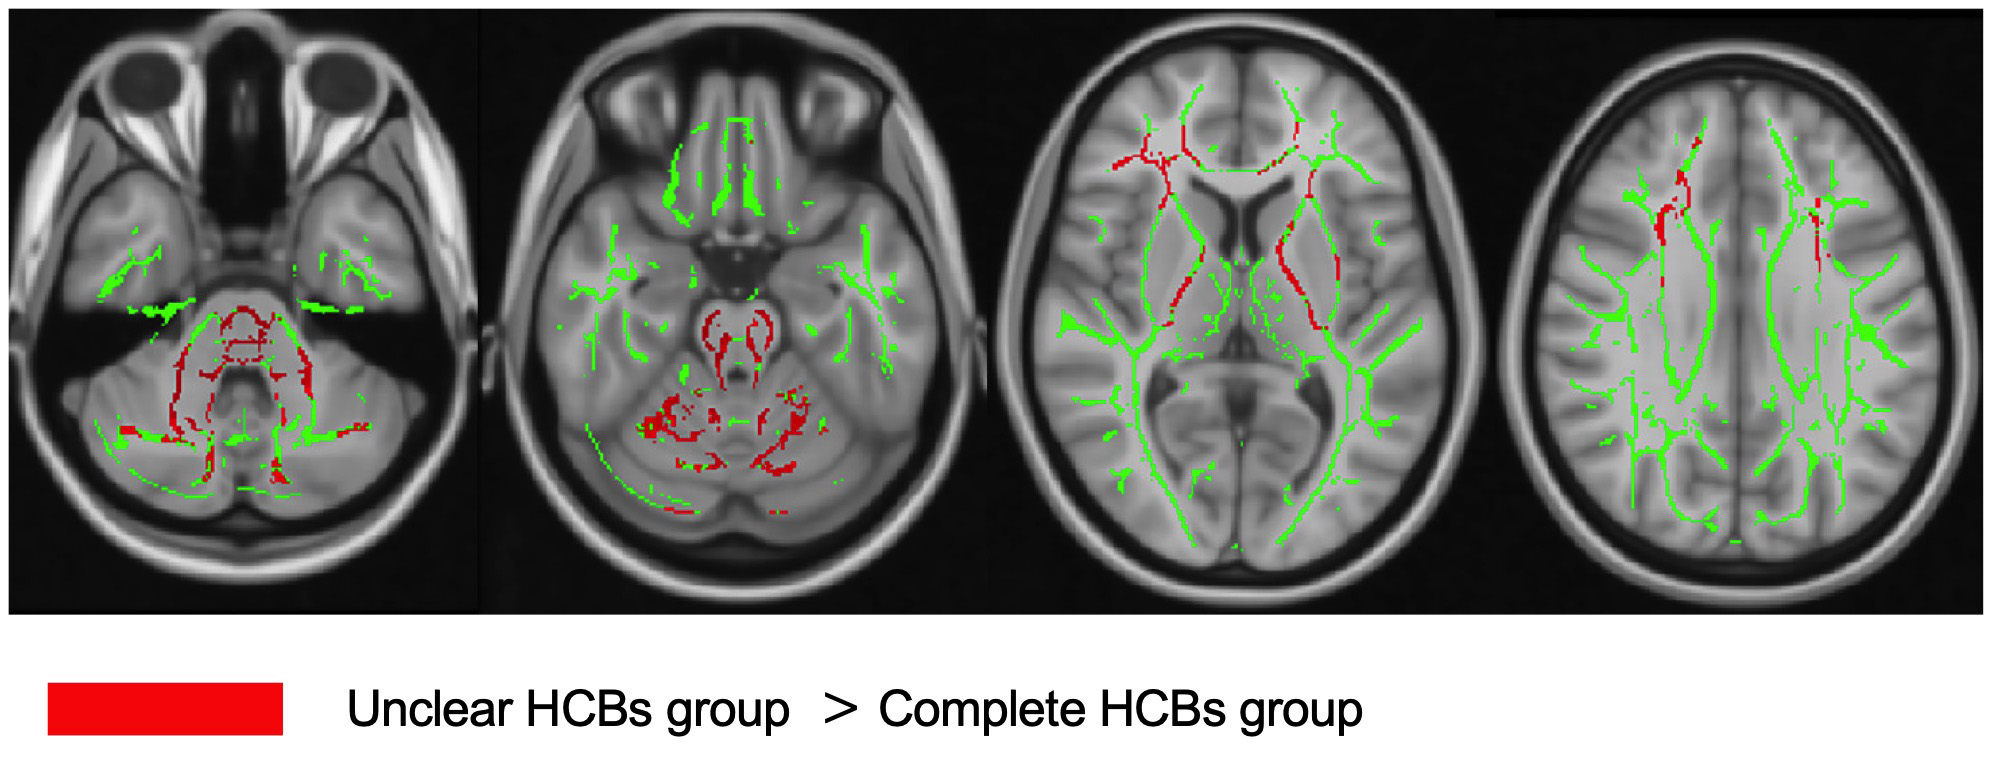
The difference between the unclear HCBs group and the complete HCBs group, regarding UMSARS Part I scores, part II scores and the sum of the two, were statistically significant ( all p<0.05). Shown in Fig 2.TBSS results shown that compared with HCs, both HCBs groups had lower FA and ICVF, and the different scope were greater in the complete HCBs group. The complete HCBs group had higher ISOVF in diffuse WM regions, as well as lower ODI in vermis cerebelli, but the unclear HCBs group showed no difference in ISOVF and ODI. (Fig 3) Compared with the complete HCBS group, the unclear HCBs group had higher ICVF in diffuse WM regions, especially in brainstem and cerebellar WM. (Fig 4) There were no differences in FA, ISOVF and ODI between two groups.Discussion
HCBs was proved to be a marker for the severity of cerebellar ataxia in recent study, 1 and in this study, higher HCBs grade also meant higher UMSARS scores, more WM alterations and broader changing regions. MSA-C patients with higher HCBs grade had lower ICVF, indicating the decrease neurite density in WM, 6 than lower HCBs grade and not limited to the brainstem and cerebellum. Compared with HCs, higher HCBs group also showed more diffuse regions than lower group in ICVF, ISOVF and ODI, which means more extensive changes of intracellular volume fraction. 6 TBSS analysis showed low ICVF in low grade group, and furthermore, the different scope became broader in high group. ISOVF difference only been found in high grade group. This finding may remind us that the neurite density decreased earlier than the volume fraction of isotropic diffusion increased. ODI difference was only found in vermis cerebelli between high grade group and HCs, and been thought that neurite dispersion had small changes in MSA-C.Conclusion
NODDI showed greater and more diffuse regions of WM alterations in higher HCBs grade MSA-C patients, underlying that HCBs grading can be thought to be an imaging marker to estimate the severity and scope of WM changes in MSA-C patients.Acknowledgements
This article is supported by Science Foundation of Liaocheng People’s Hospital (No. LYQN201924).References
1. Zhu S, Deng B, Huang Z, et al. "Hot cross bun" is a potential imaging marker for the severity of cerebellar ataxia in MSA-C. NPJ Parkinsons Dis 2021;7:15.
2. Horimoto Y, Aiba I, Yasuda T, et al. Longitudinal MRI study of multiple system atrophy - when do the findings appear, and what is the course? J Neurol 2002;249:847-854.
3. Yoo HS, Chung SJ, Lee YH, et al. Urate is closely linked to white matter integrity in multiple system atrophy. Ann Clin Transl Neurol 2020;7:1029-1039.
4. Ogawa T, Hatano T, Kamagata K, et al. White matter and nigral alterations in multiple system atrophy-parkinsonian type. NPJ Parkinsons Dis 2021;7:96.
5. Mao J, Zeng W, Zhang Q, et al. Differentiation between high-grade gliomas and solitary brain metastases: a comparison of five diffusion-weighted MRI models. BMC Med Imaging 2020;20:124.
6. Masutani Y. Recent Advances in Parameter Inference for Diffusion MRI Signal Models. Magn Reson Med Sci 2022;21:132-147.
Figures